Watch the entire 1 hour 57 minute class that James taught on market corrections here:
This class was taught on November 18, 2020 via webinar with Brian Williams.
This class picks up where my class on Should I Wait for a Real Estate Dip to Invest in Real Estate? leaves off.
In the “market dip” class, I talked about:
- The obvious idea that: if you buy at relative lows, you perform better
- Historically, recessions are not necessarily real estate market corrections
- Predicting the future: technical analysis versus fundamental analysis
- The smartest investors all say: timing the market is incredibly difficult, and no-one has been consistently successful at it
- No market timers have ever made it to the Forbes richest people list
- If you were going to try to time the market, how you might do it (including possible triggers to signal that you should start buying/selling)
- 4 phases of real estate market cycles and their approximate frequency
- Impact to the Return on Investment Quadrant™ during a market dip
- How that class could have been a full day or more. This is true even with this extra 2-hour class on market corrections. There’s so much to cover here.
- Modeled buying properties immediately (with a dip at various times)
- Modeled buying after a dip (10% decline in stocks, property values and rents)
If you have not watched that class, I might suggest you watch that first since I rewatched it just before I created this one. I consider this one a stand-alone sequel.
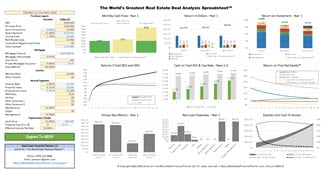
Instead of discussing timing the market, we will now look at how a sampling of real estate investing strategies performed with random market corrections.
Market Corrections Class Modeling Assumptions
While we will change some of these assumptions as we model a variety of things, here’s the basic, core assumptions for what we used to model the investing strategies for the market corrections class.
- Investor earns $5,500 per month with $5,000 in personal expenses (including taxes) so they’re saving about $500 per month. These adjust with inflation over time.
- Needs $5K per month to achieve financial independence. It can come from cash flow from rentals AND 4% safe withdrawal rate from any money they have invested in the stock market.
- Starting with $300K invested in the stock market and no properties
- Random stock market rate of return (based on historical data)
- Appreciation and rent appreciation are also random (average of 3% per year)
- Everyone buys a property to live in with 5% down at the start then start buying investments when $20K reserves + down payment + closing costs. We will be modeling 5% Nomad™, 20% or 25% down rentals.
- Market corrections consist of random stock market corrections – happen on average once every 10 years with a random, but average 10% decline in value of the account balance in the stock market that month. For more technical folks, the amount of the decline is based off a normal distribution with an average of 10% but a range of 0% to 20%.
- Market corrections also consist of random real estate market corrections that happen on average once every 18 years with a random, but average 10% decline in property value and rent in that month. Same 0-20% range as I described for stocks above.
- If the investor’s bank account balance gets low on money (less than $10K), the investor will sell property (paying closing costs, sales costs including real estate commissions, long-term capital gains and depreciation recapture) to replenish their account.
Owner-Occupant (and Nomad™) Property Assumptions
- $400,000 property value and purchase price and it goes up at an average rate of 3% per year.
- Both random + market corrections; 3% average was for random only
- 5% of purchase price for down payment.
- 1% of purchase price in closing costs at time of purchase.
- No seller concessions.
- 2.625% is the mortgage interest rate with a term of 360 month mortgage term.
- Private Mortgage Insurance (PMI) at a rate of 0.3% of the initial loan balance until the loan-to-value drops below 80%.
- $2,274.24 per month in rent but rent increases at an average rate of 3% per year
- Both random + market corrections; 3% average was for random only
- 3% of the monthly income is the assumed vacancy rate.
- 10% of the monthly income is the assumed maintenance rate.
- 10% of the monthly income is the assumed property management rate.
- $400 per year for HOA fees on the property and they increases at a rate of 3% per year.
- 1% of the value of the property each year is the assumed property taxes rate. Based on the initial value of $400,000 that’s about $4,000 per year in property taxes at the start and it changes as the property value changes.
- 0.4% of the value of the property each year is the assumed property insurance rate. Based on the initial value of $400,000 that’s about $1,600 per year in insurance costs at the start and it changes as the property value changes.
- This is a residential property and 15% of purchase price is considered the value of the land (when doing our depreciation calculation when it becomes a rental).
Since we’re owner-occupying this property, it is not a rental. However, in some of the other modeling we do, we do convert this property to a rental. Hypothetically, if we were to convert his property to a rental in the very first month that we bought it with 5% down payment as an owner-occupant (which we can’t… but if we did), here’s what the Cash Flow Power Meter™ for the property would look like:

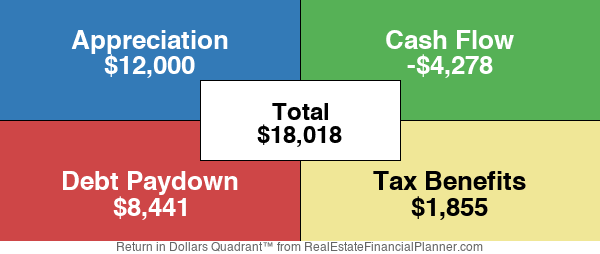
And, similarly, if we could convert it to a rental, here’s what the Return in Dollars Quadrant™ would look like:
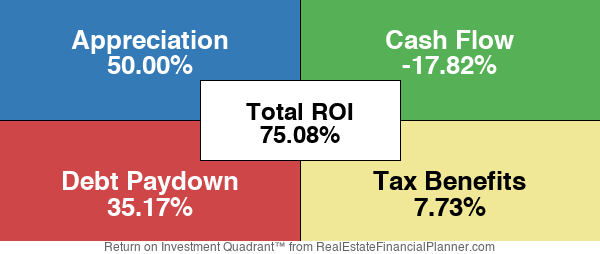
And, if we divided by the 5% down payment and closing costs, here is the Return on Investment Quadrant™:
Rental Property Assumptions
The rental property is the same as the owner-occupant/Nomad™ property except:
- Putting 25% down instead of 5% down.
- Because we’re putting more than 20% down, there is no longer Private Mortgage Insurance (PMI).
- Interest rate for an investor, 25% down loan (at the time this class was taught) was 3.00% for a 30-year fixed rate financing loan. So, we used that.
Using these numbers the Cash Flow Power Meter™ says it is basically break-even cash flow with professional property management:

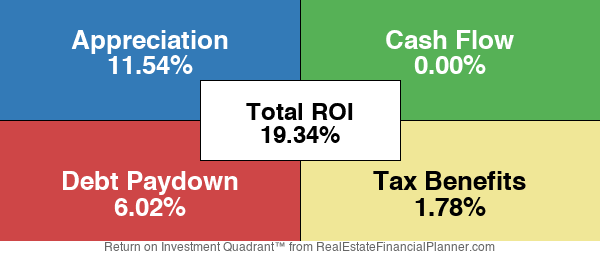
The Return in Dollars Quadrant™ for the 25% down payment investment property looks like this at the time of purchase of the first property (before any appreciation, rent appreciation or market corrections):

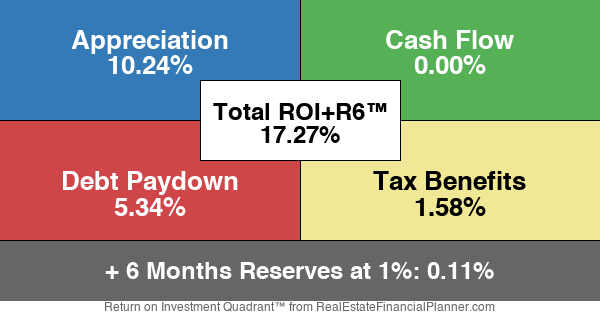
And, if we take the return from each quadrant and divide by the total amount we had to invest to purchase this property with 25% down payment and closing costs, we get the Return on Investment Quadrant™ shown below:
While we don’t go over the ROIQ+R™ in the class, as we’ve discussed in the Everything You Learned About Deal Analysis is Wrong – ROIQ+R™ class, here’s the ROIQ+R6™:
Modeling Market Corrections
For modeling market corrections I ran a number of  Scenarios
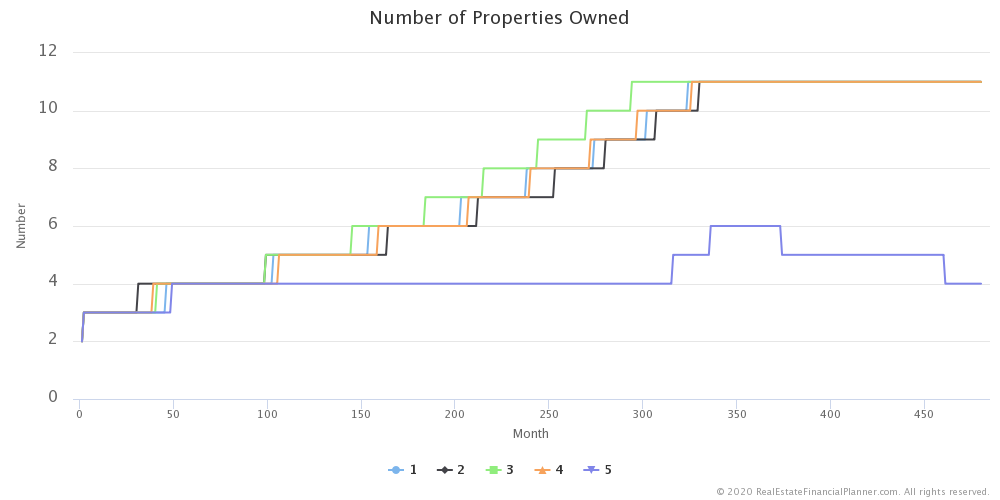
In the chart below, I am showing how quickly/slowly you are buying properties in 5 different Scenarios
And, here I am showing you how it looks when I run it for 50 Scenarios
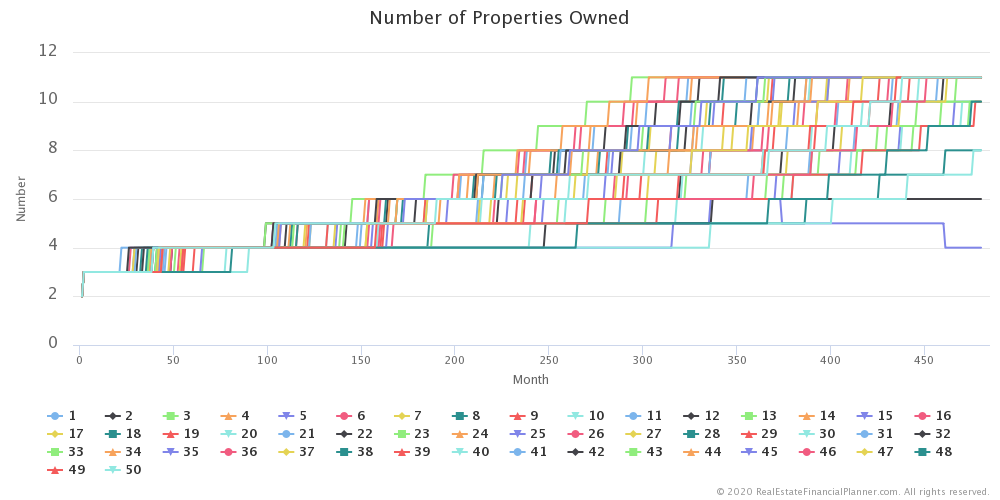
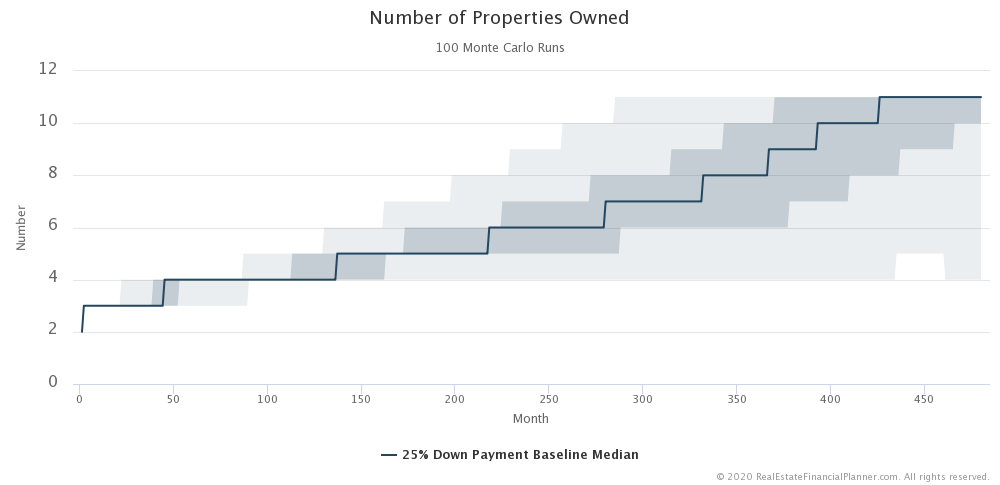
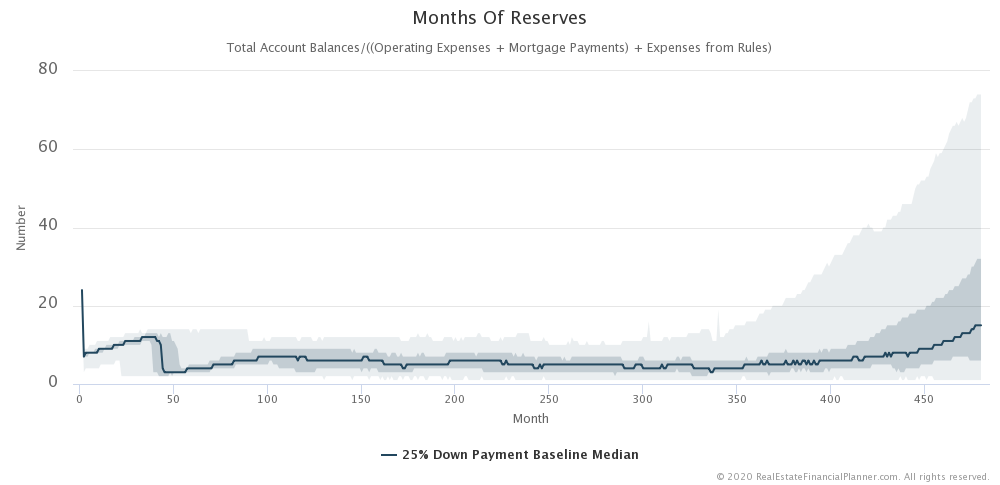
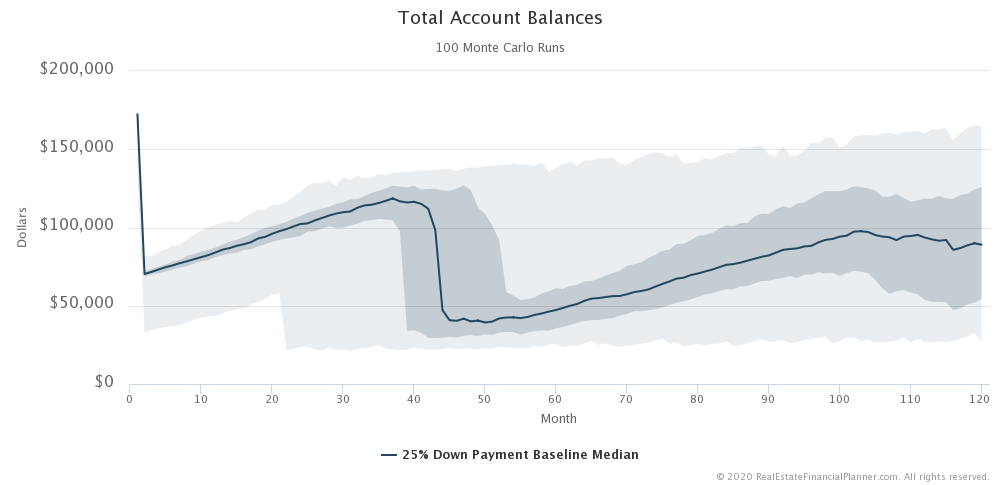
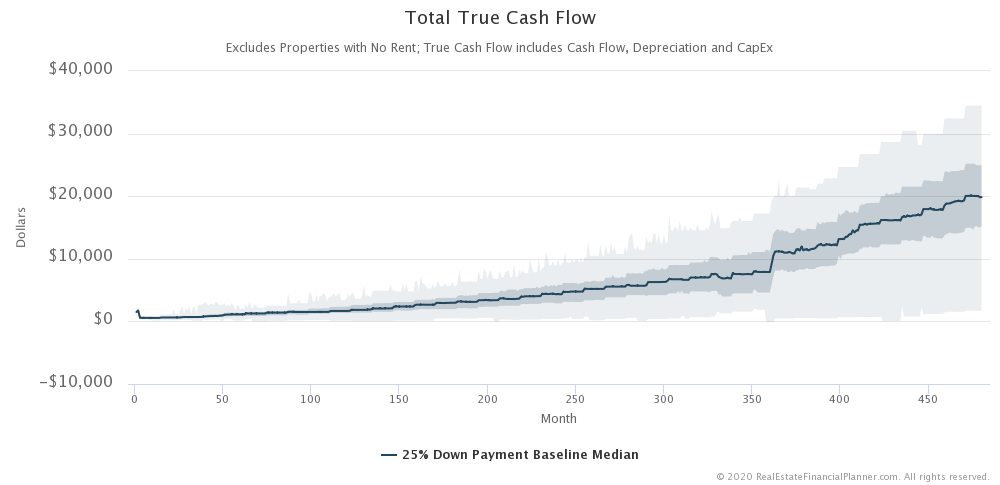
It starts to get too busy to really interpret what is going on. So, I start to summarize the data. The following chart shows the middle 50% of the 100 Scenarios
The dark blue line in the center is the middle most Scenario
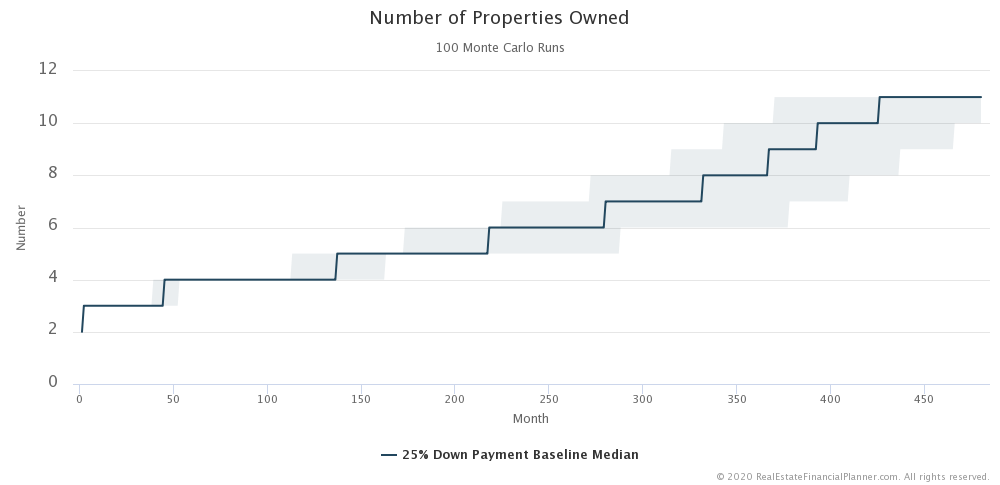
The light blue now shows the full range of when we buy properties (the fastest and the slowest) for all 100 Scenario
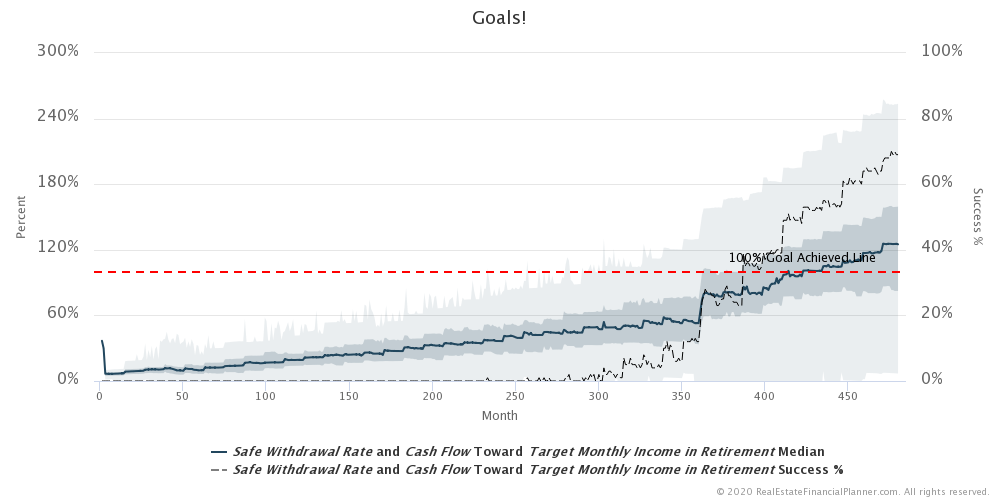
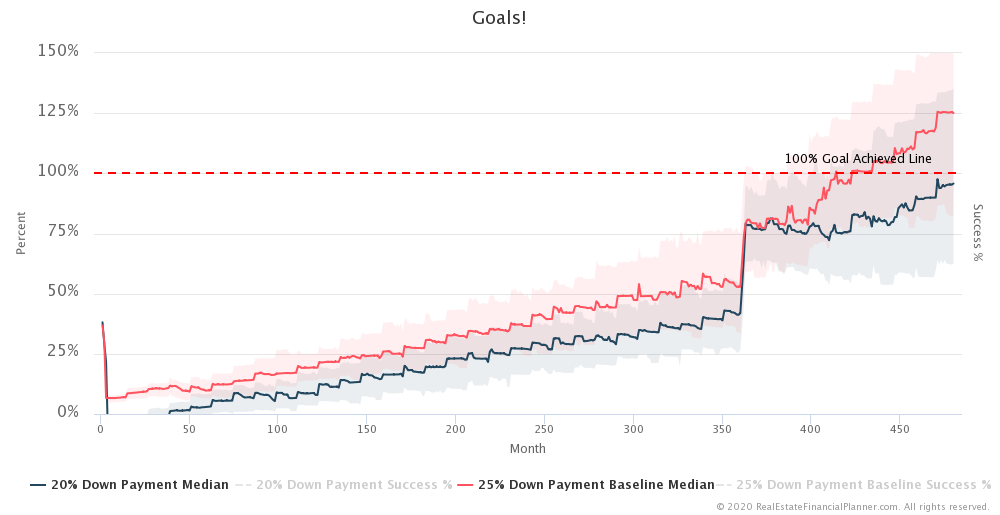
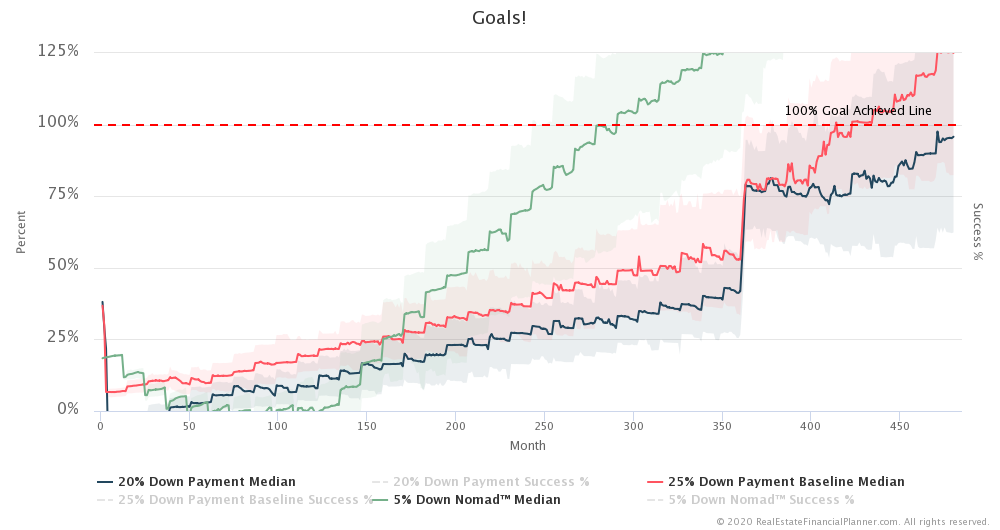
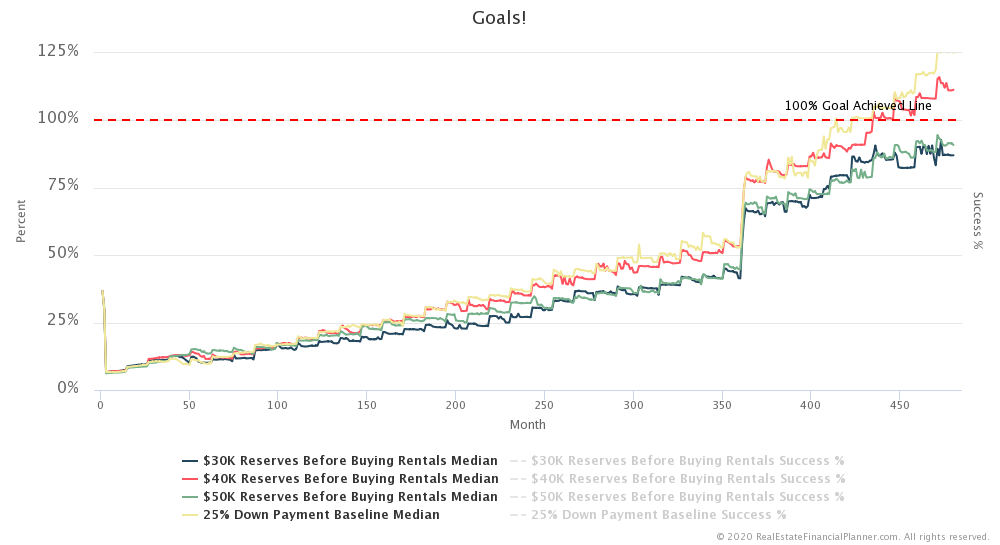
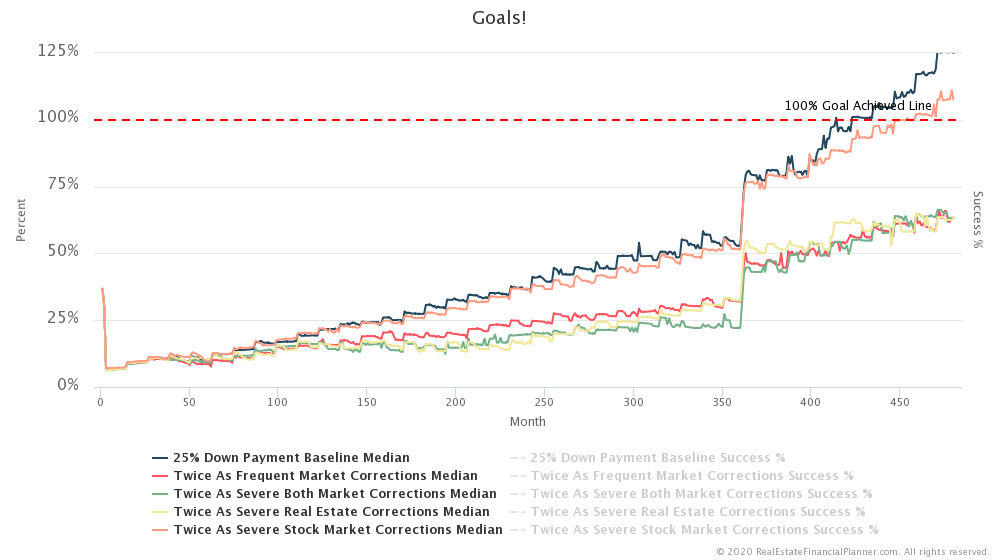
So, how quickly are we able to achieve our goal of financial independence?
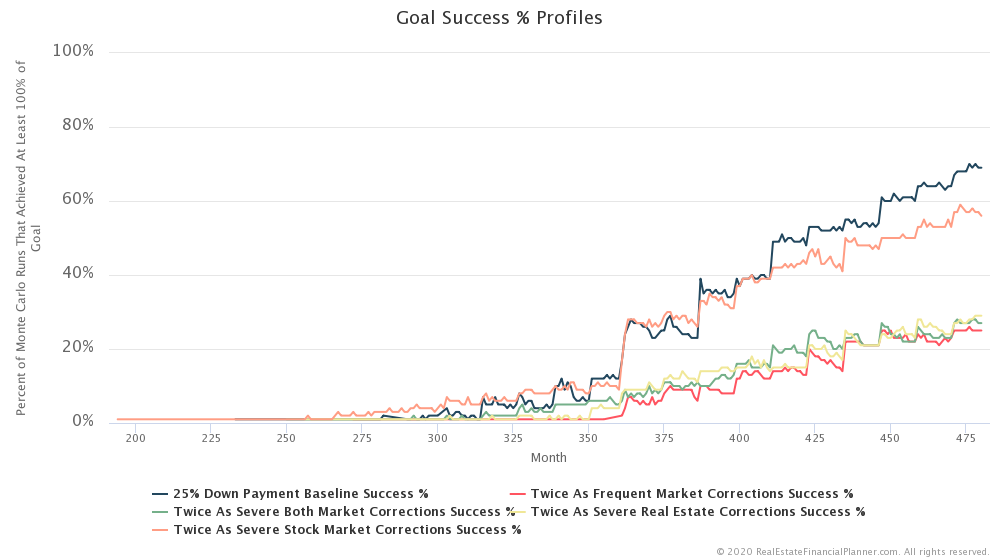
Here’s a chart showing what percentage of our $5,000 per month in passive income from a combination of cash flow from rental properties and the 4% safe withdrawal rate of money we have in the stock market we’ve achieved over time.
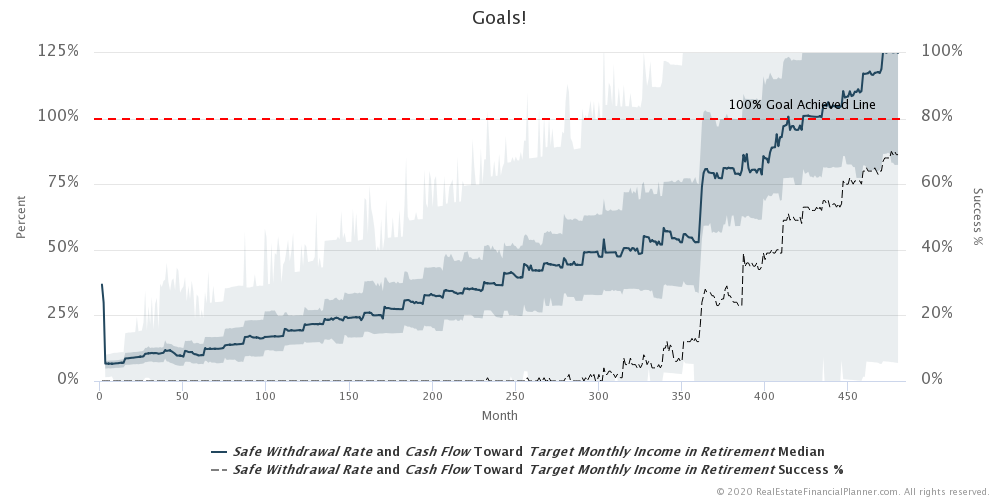
This is merely a zoomed in version of the same chart.
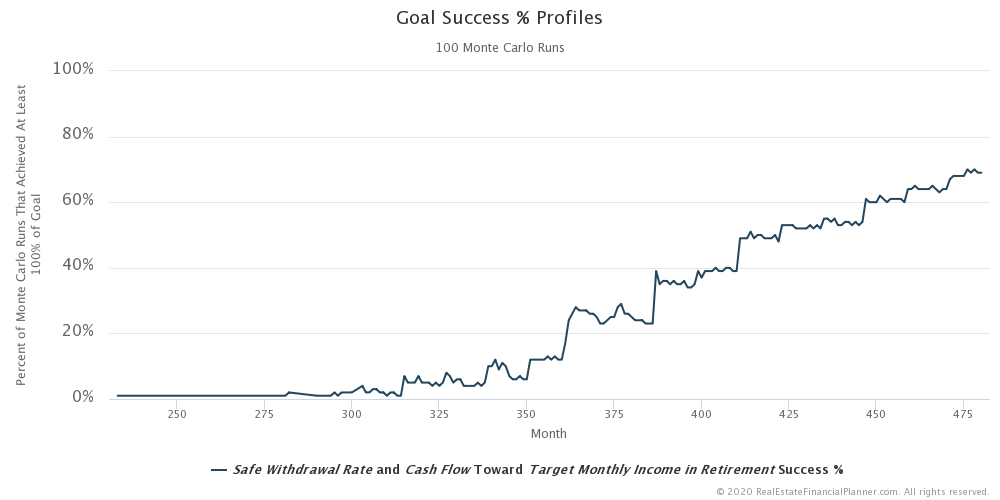
This chart shows you how many (what percentage actually) of the 100 Scenarios
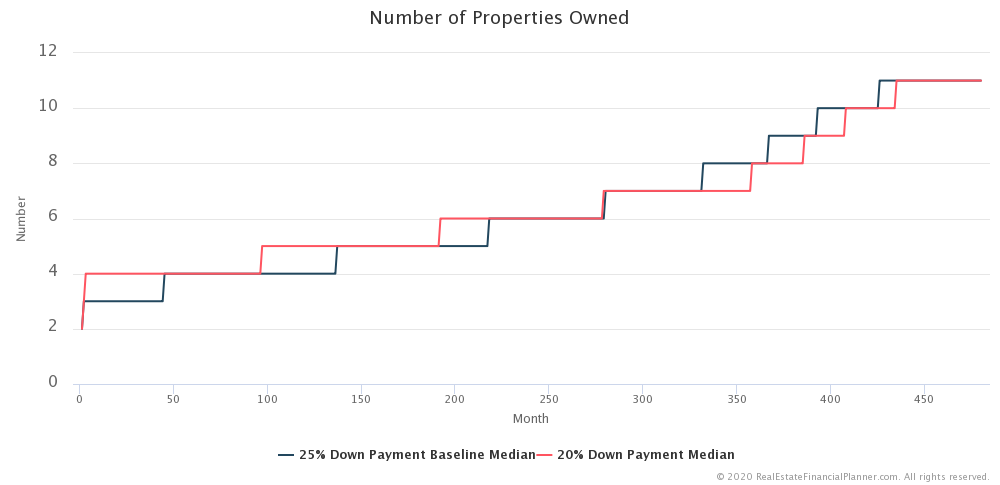
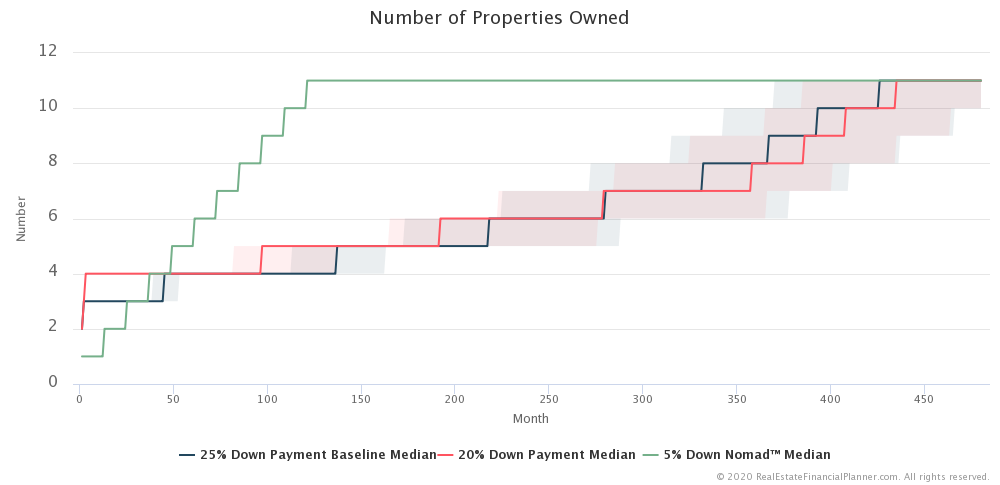
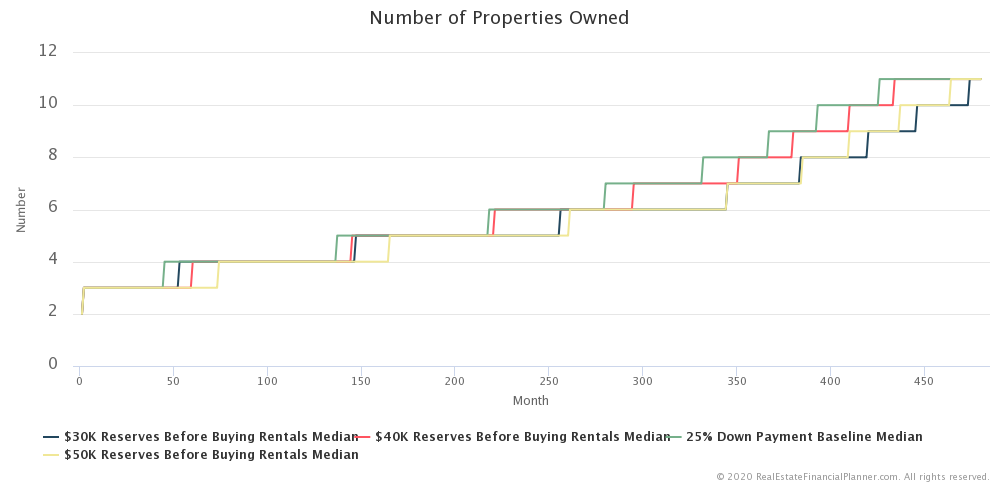
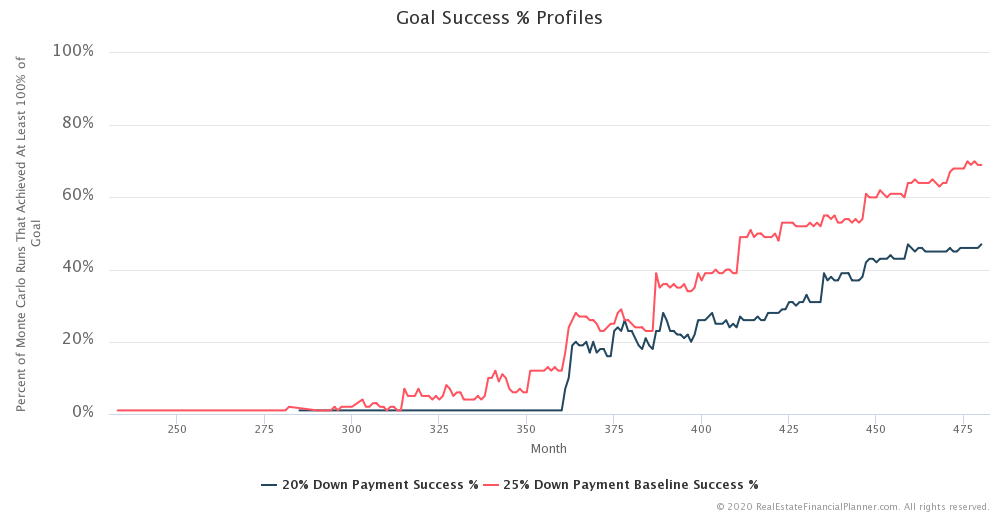
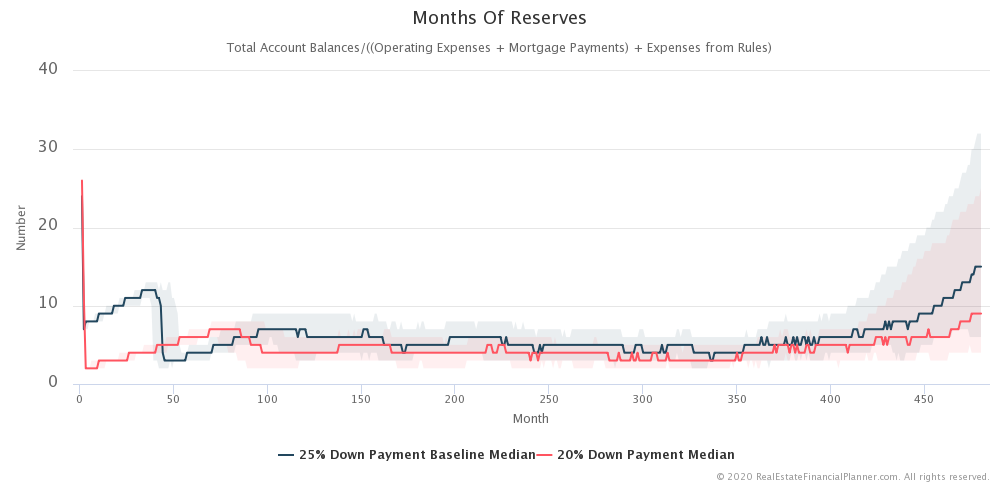
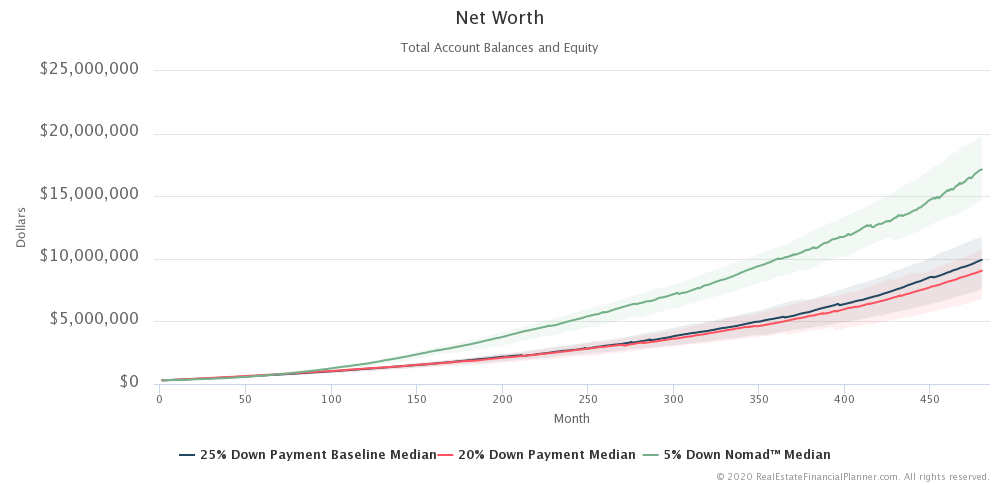
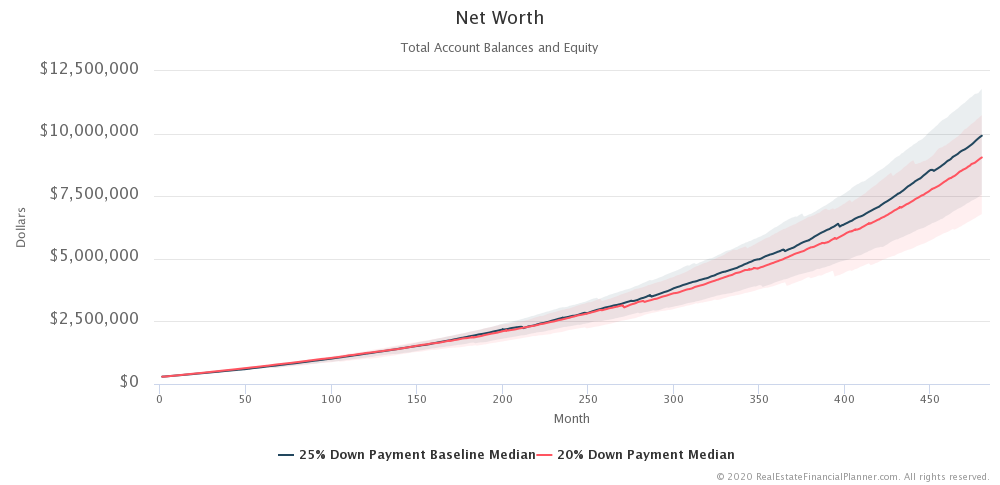
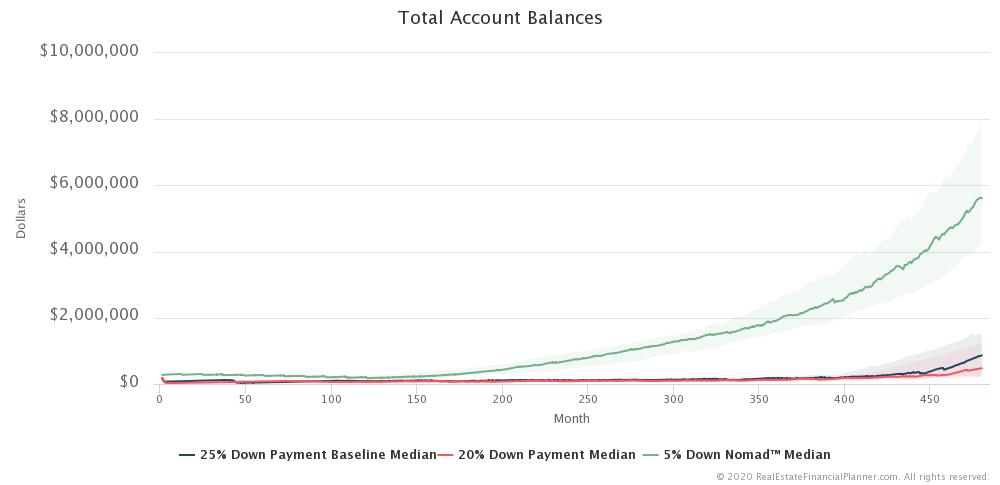
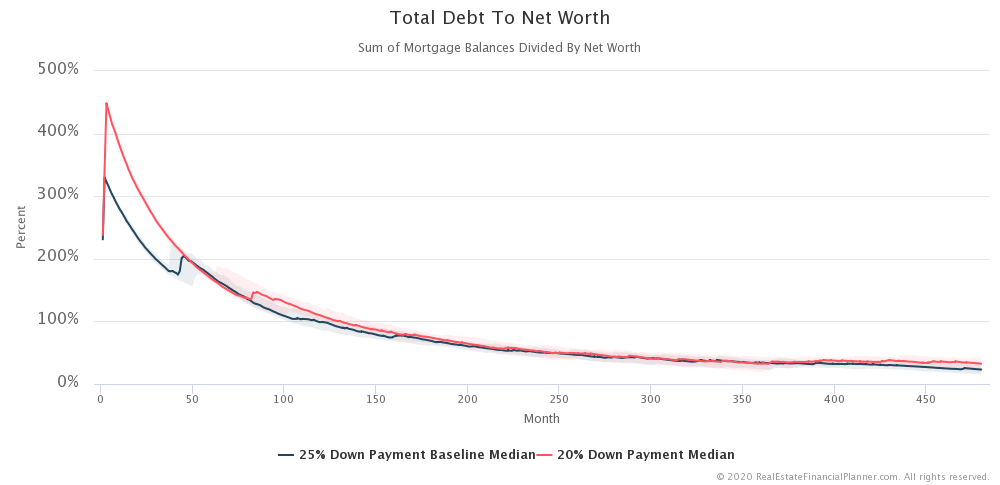
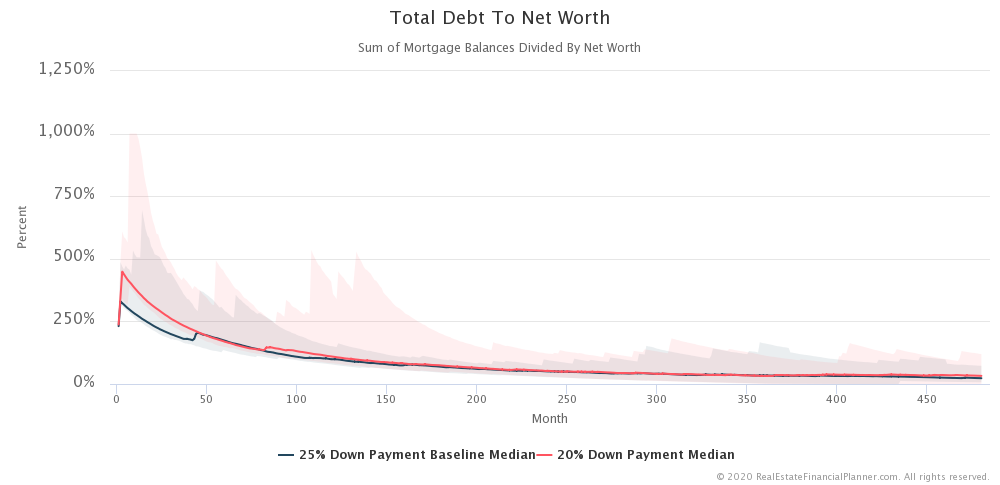
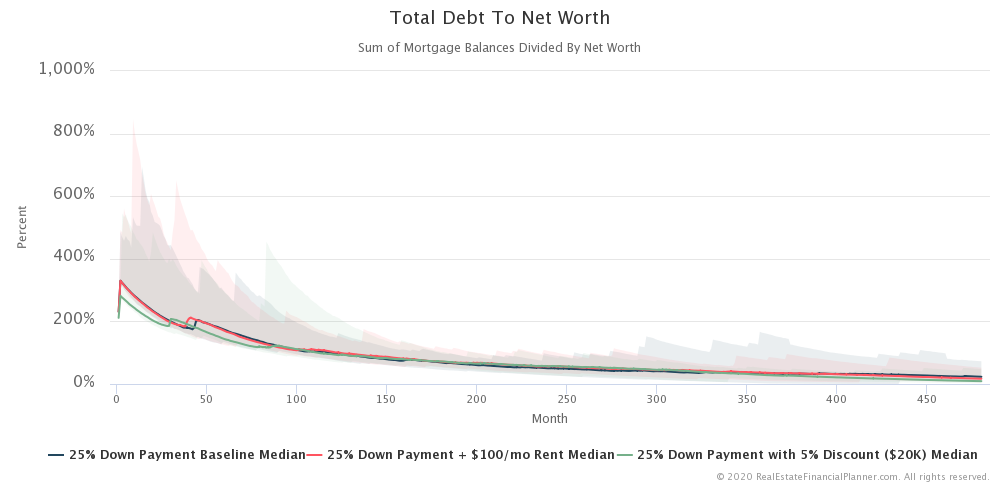
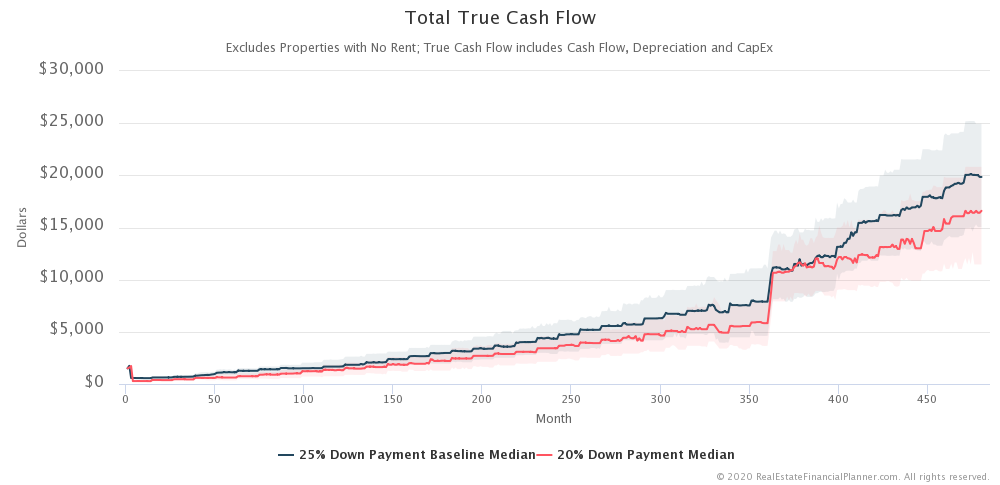
Comparing Market Corrections with 20% Down Payment to 25% Down Payments
If we look at the median case (the 50th percentile) of how slowly/quickly we are acquiring properties comparing buying the properties with 20% down payment to buying them with 25% down payments, we can see the difference in the chart below.
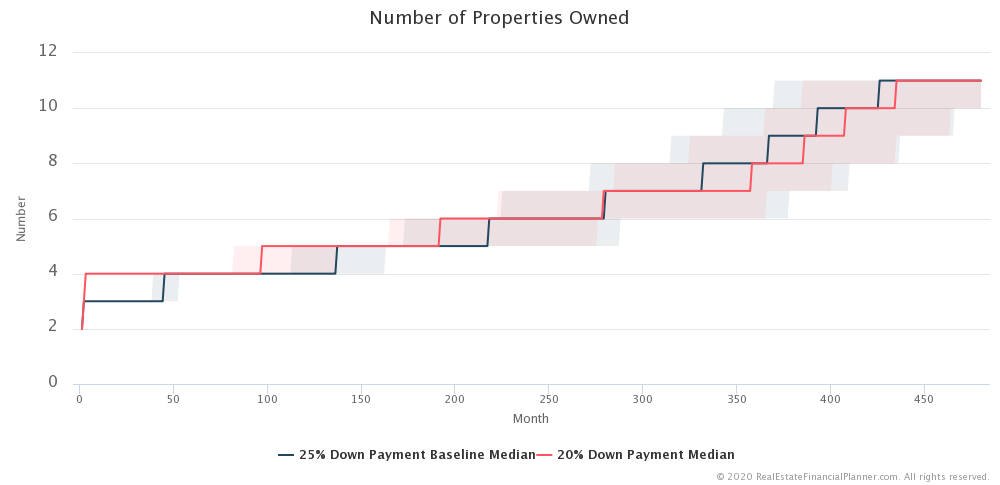
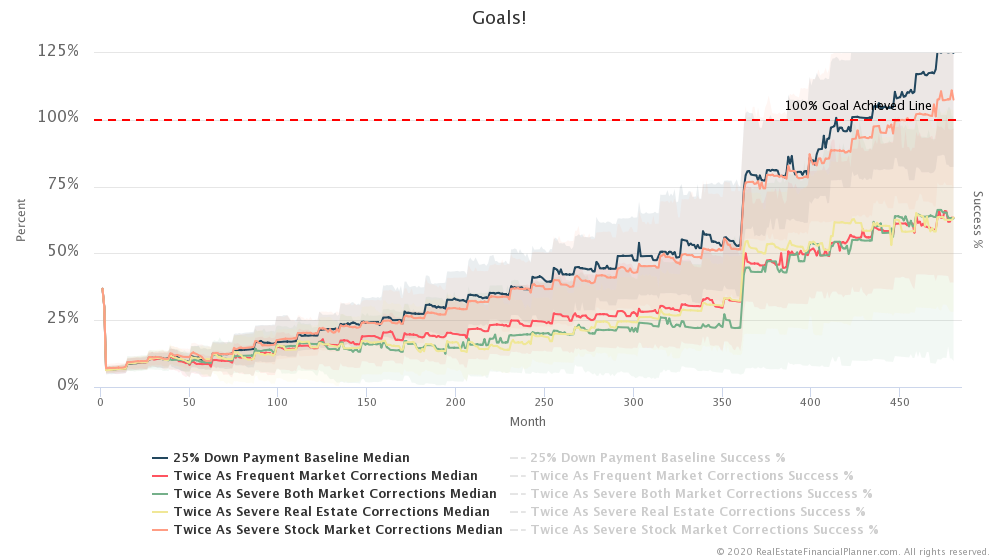
This chart includes the range of the middle 50% of all the Scenarios
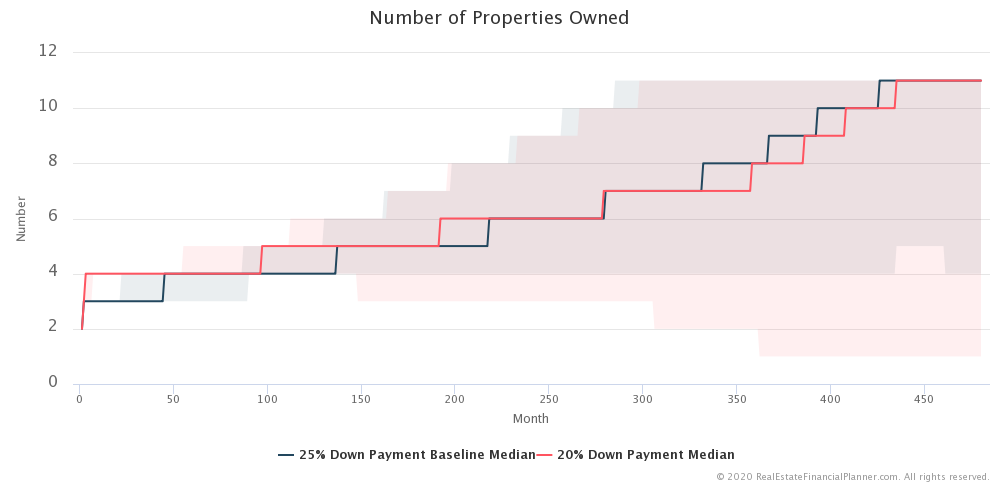
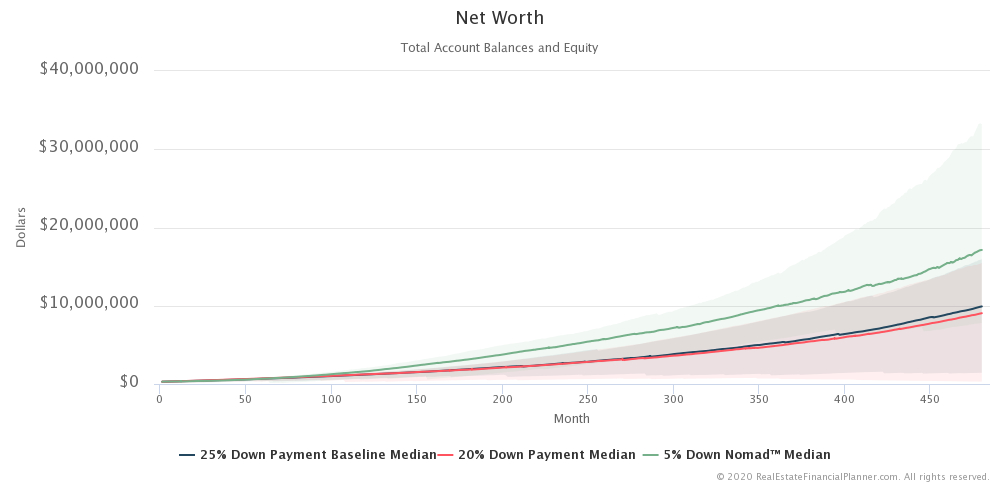
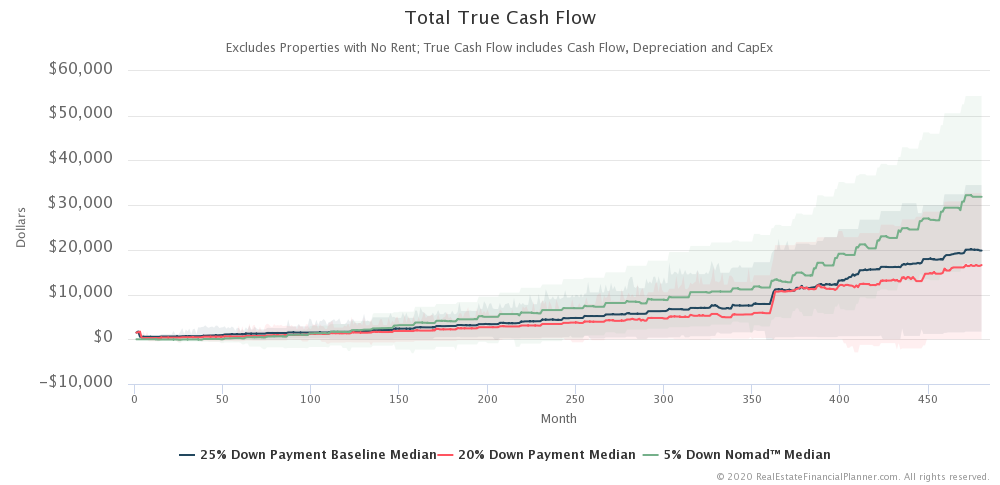
And finally, this shows the full range of the 100 Scenarios
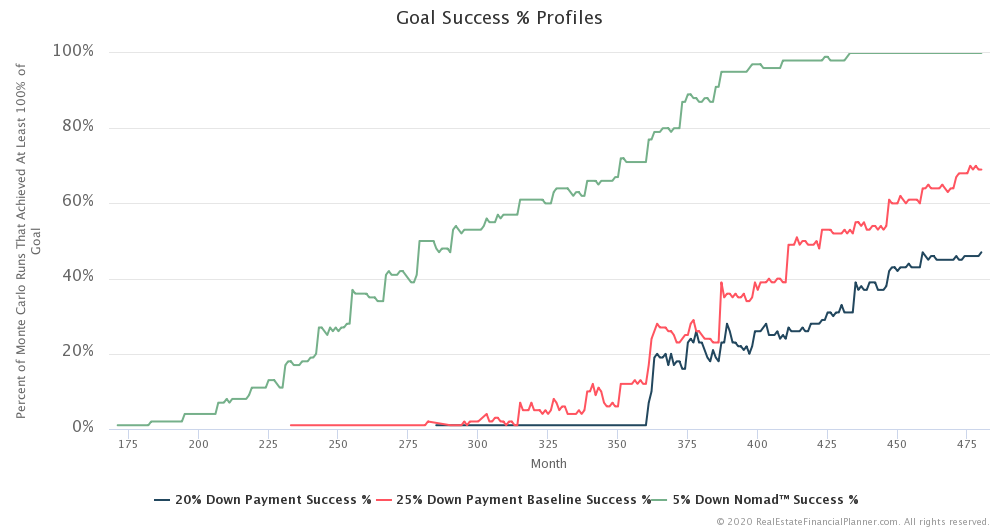
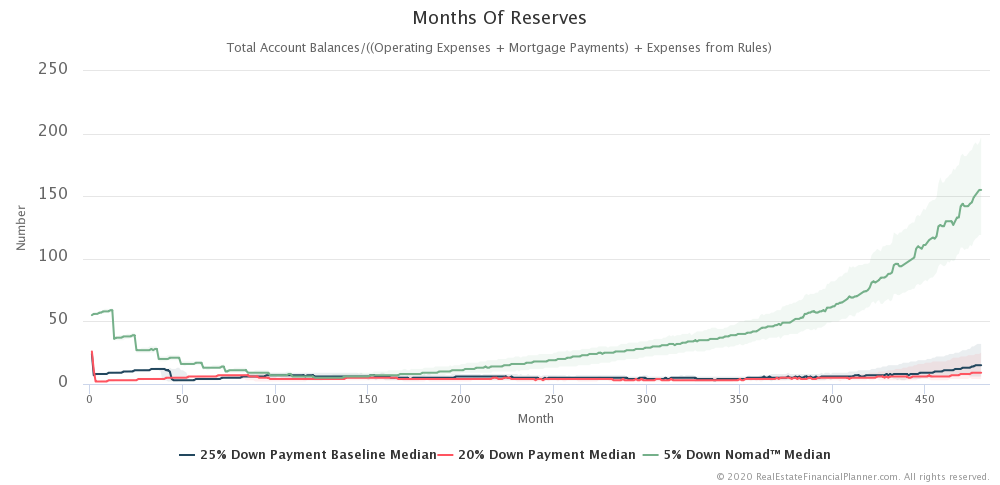
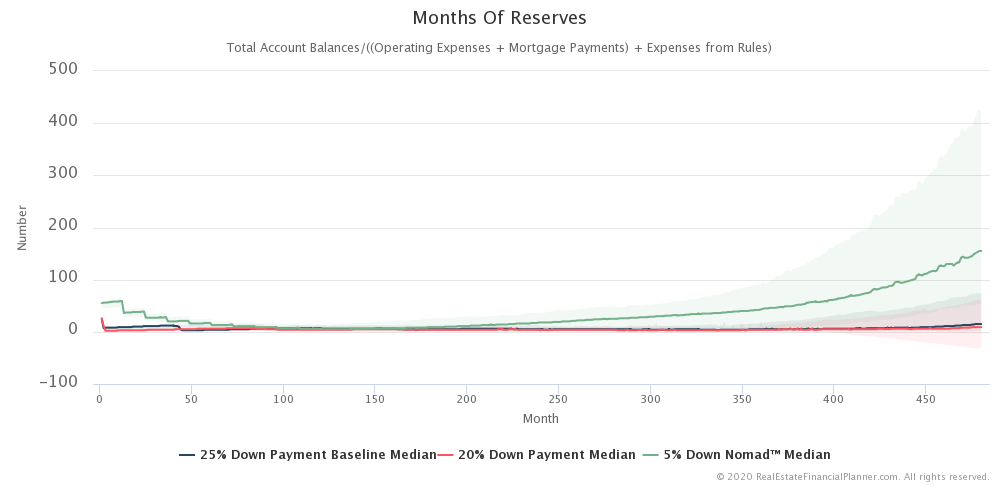
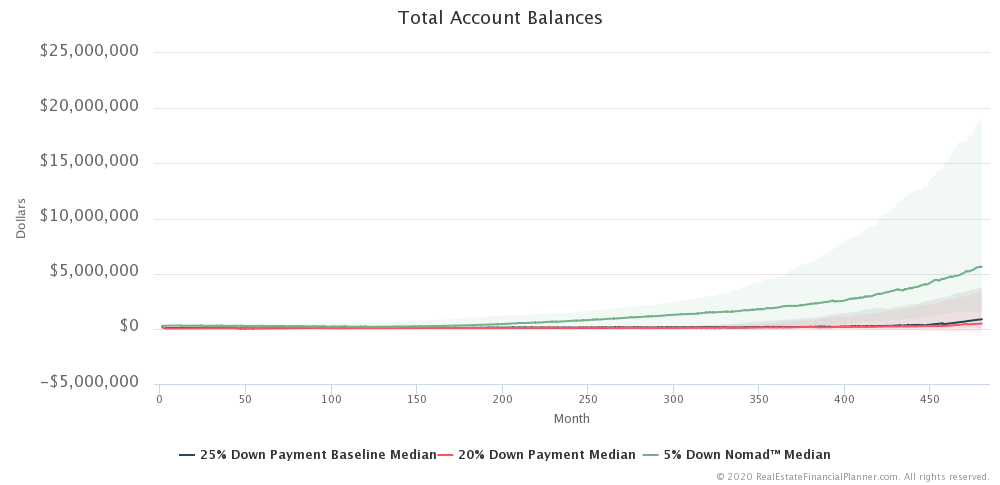
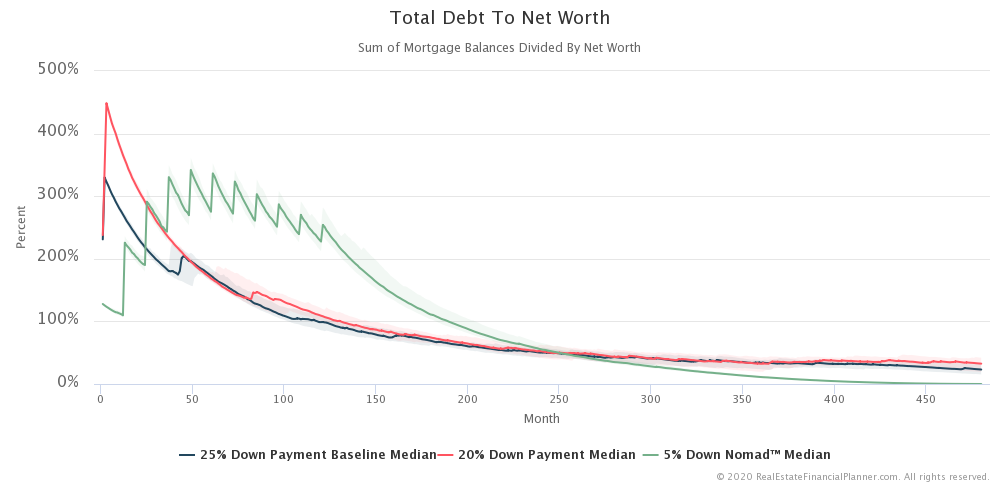
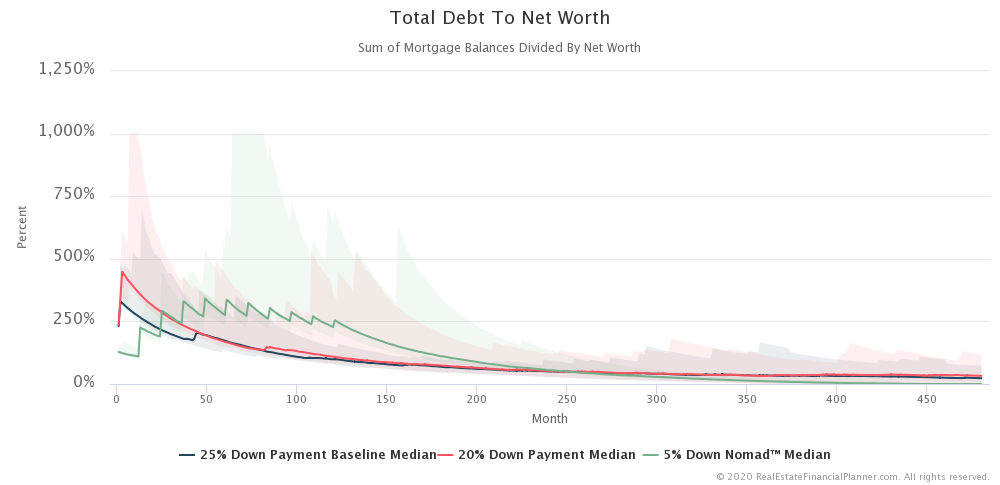
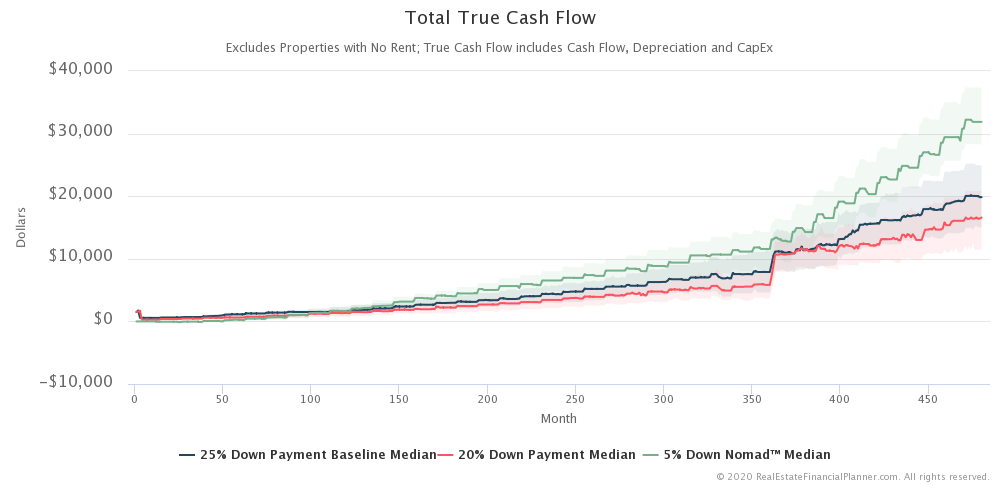
Market Corrections with Nomad™
What if we add in Nomad™?
Here’s how that looks for how slow or quickly we’re able to acquire properties even with random market corrections over 100 Scenarios
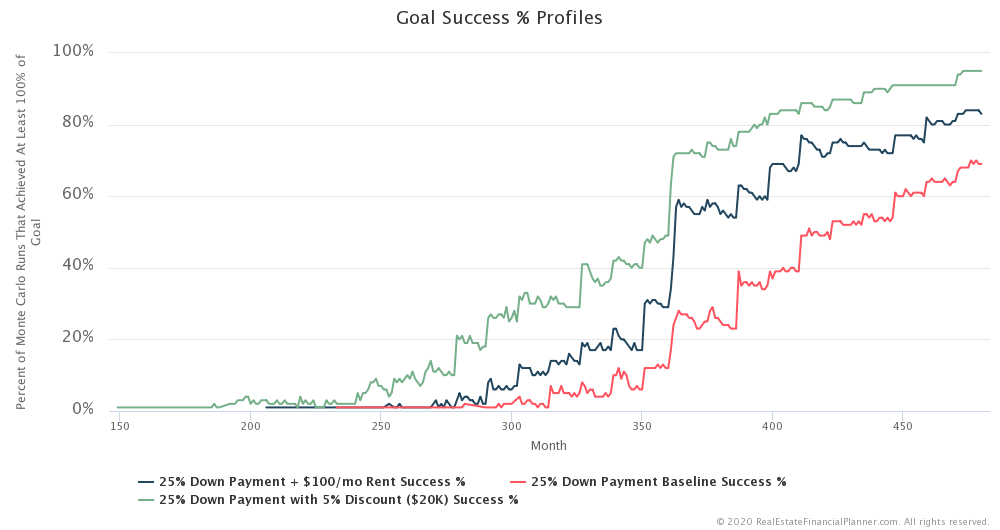
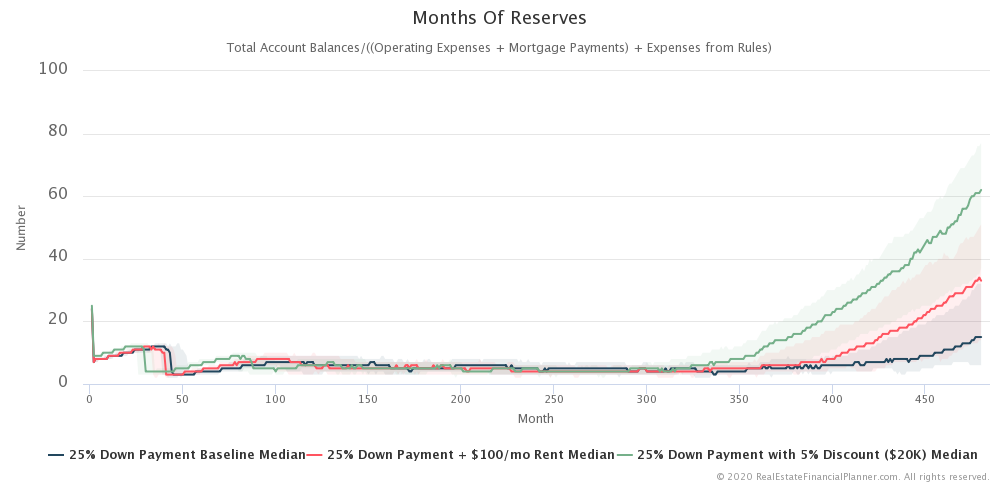
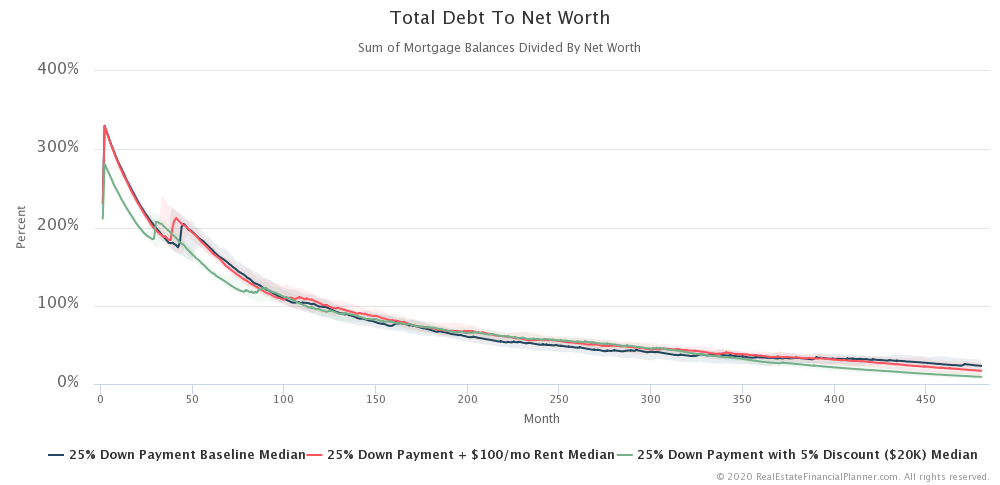
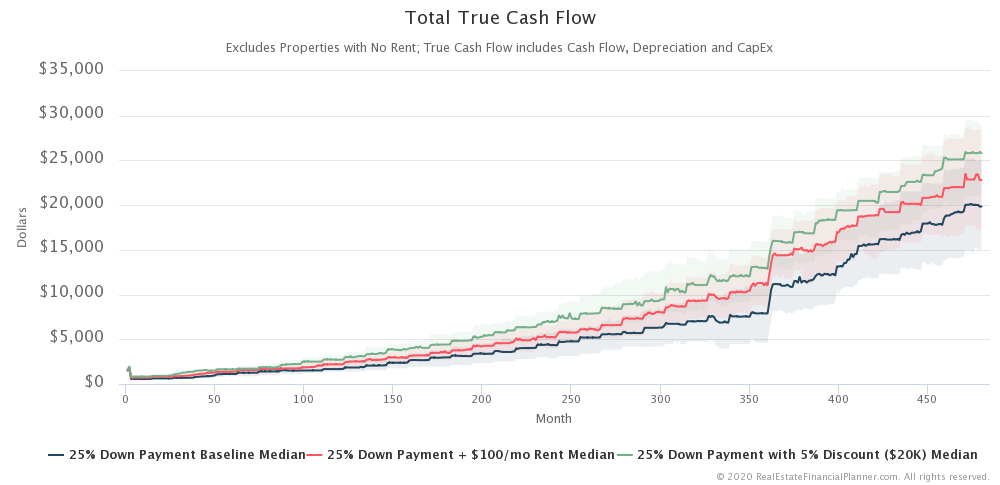
Buying Better Properties With Market Corrections
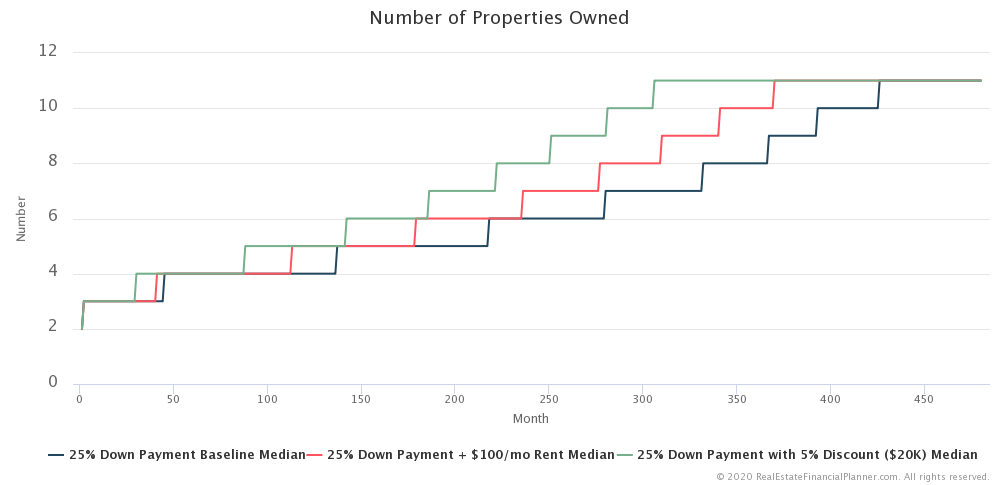
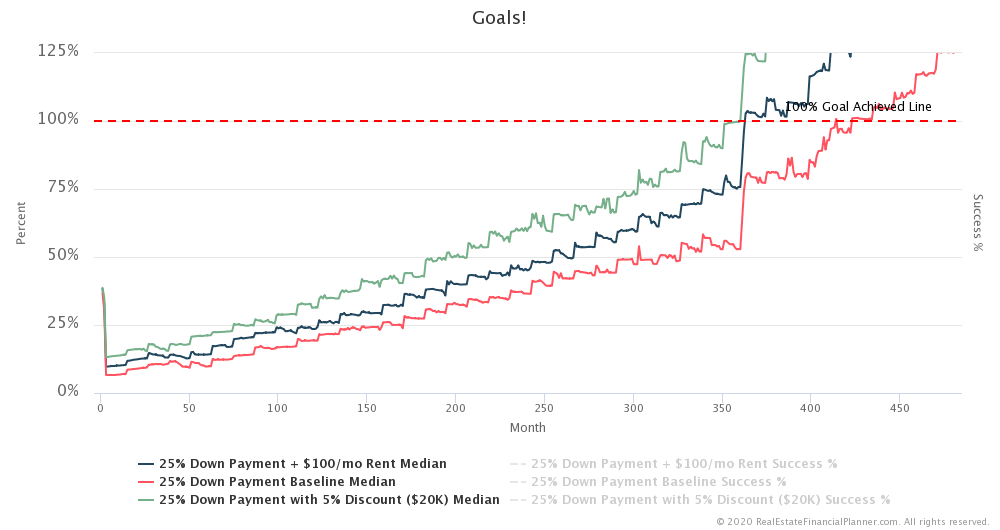
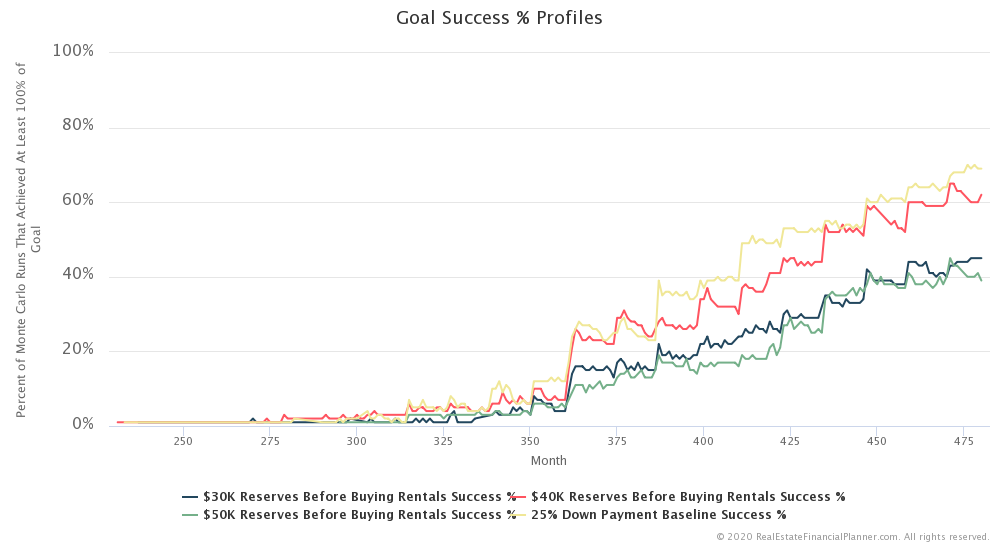
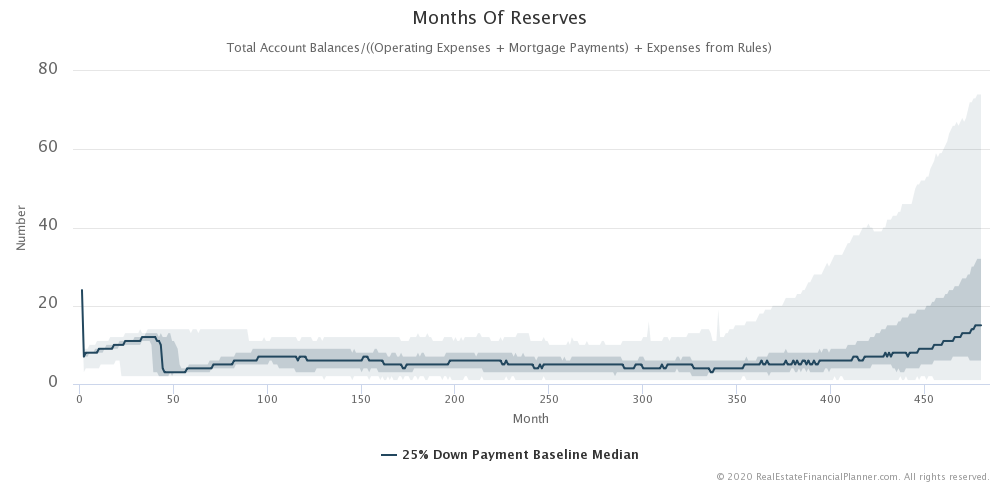
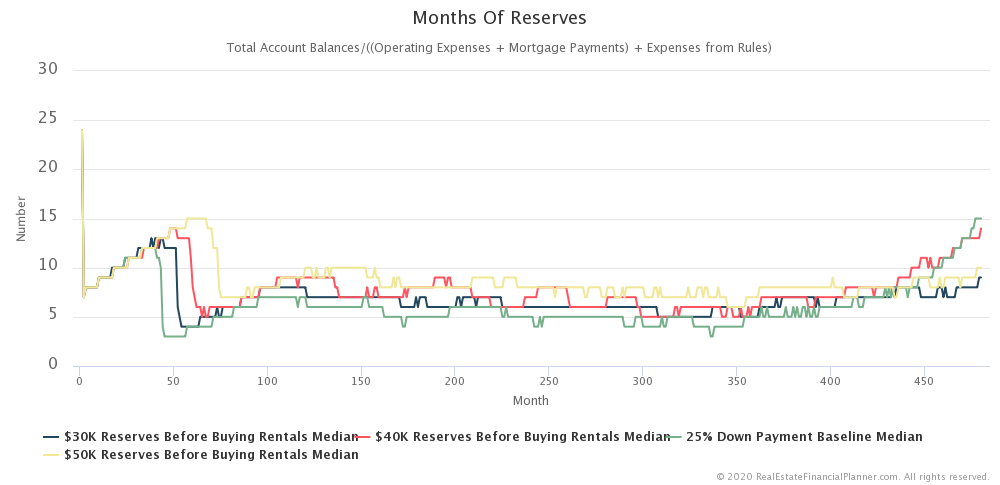
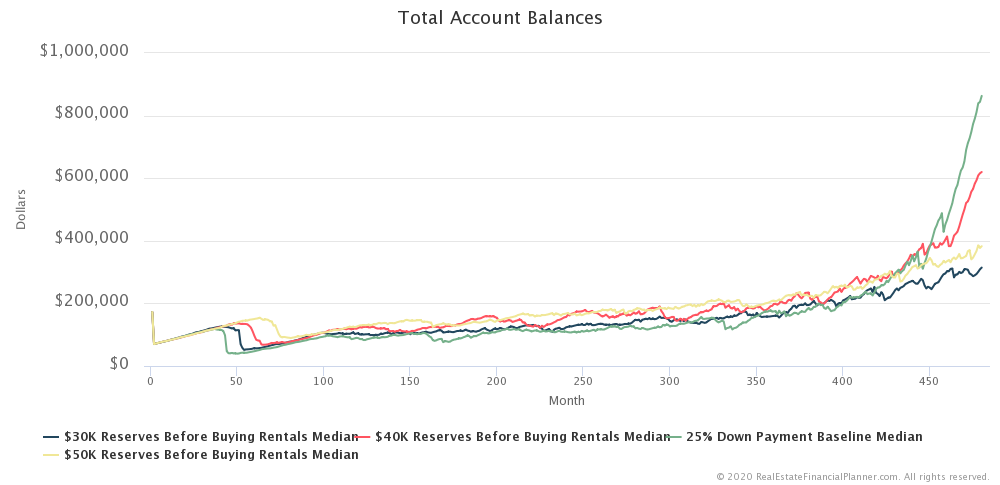
Better Reserves When Buying With Market Corrections
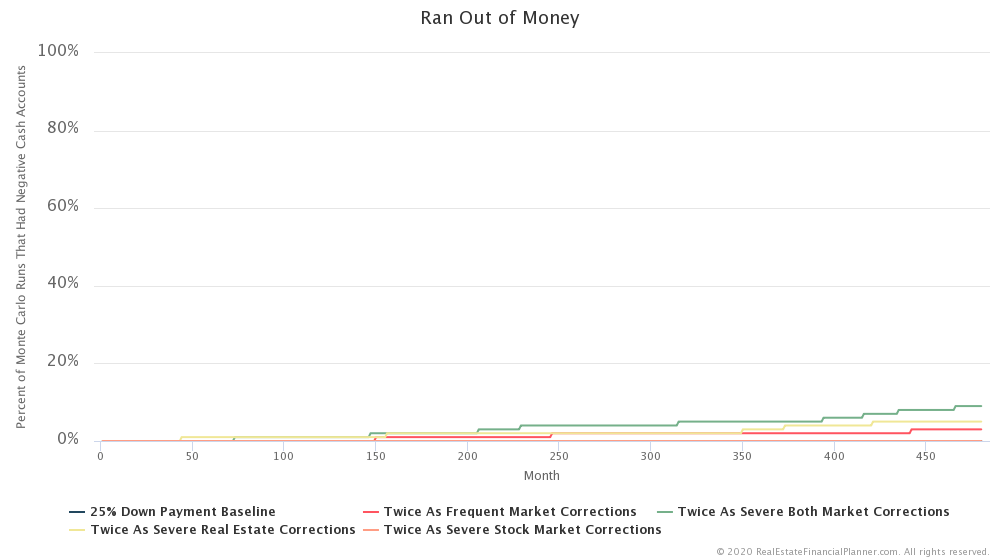
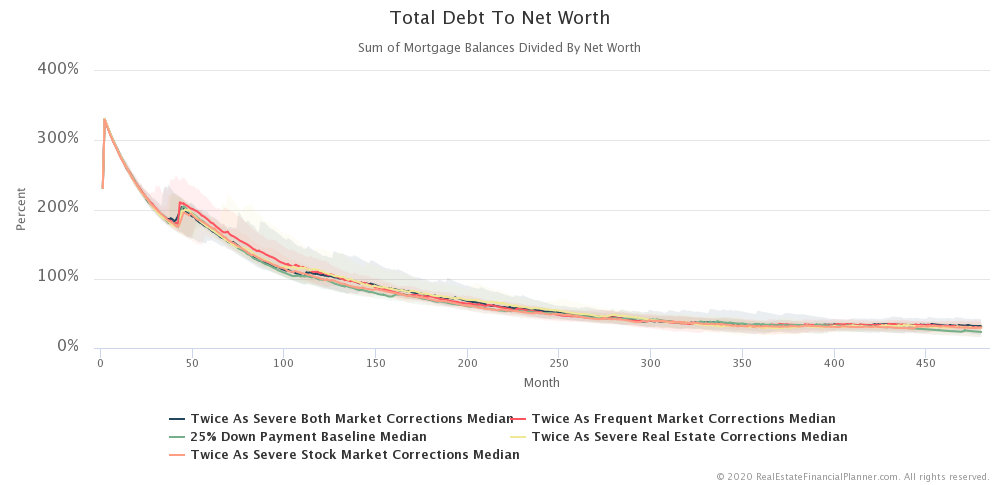
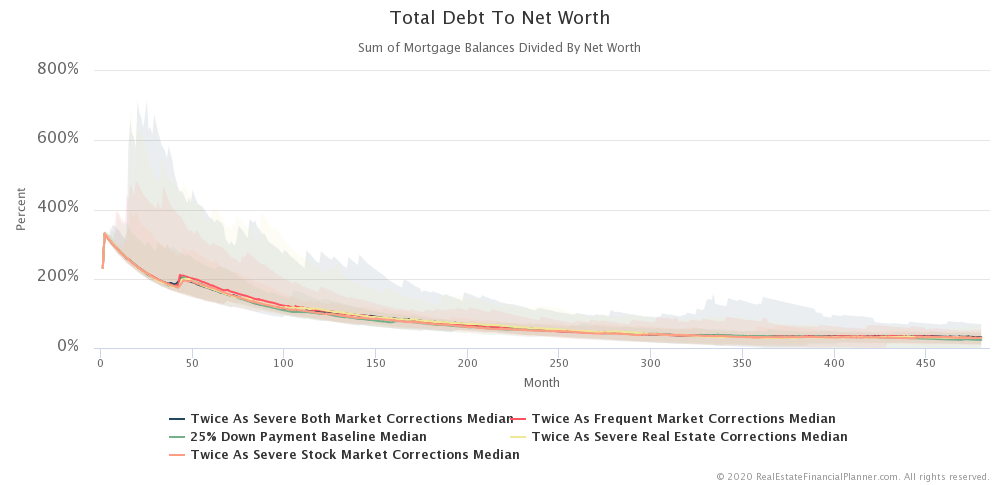
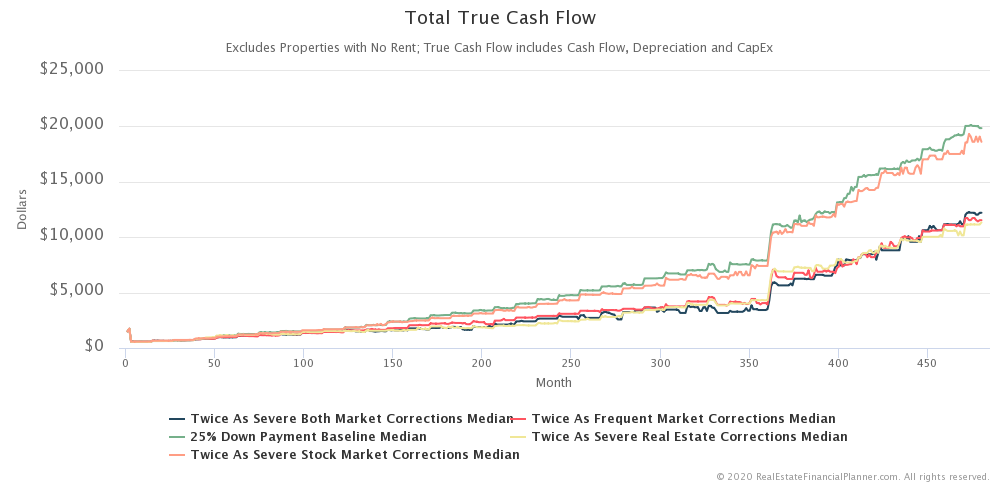
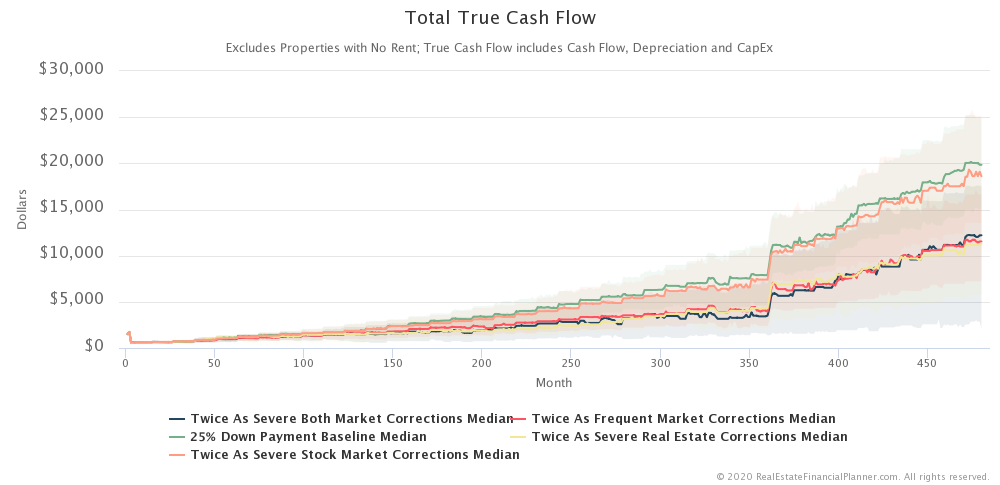
More Severe Market Corrections
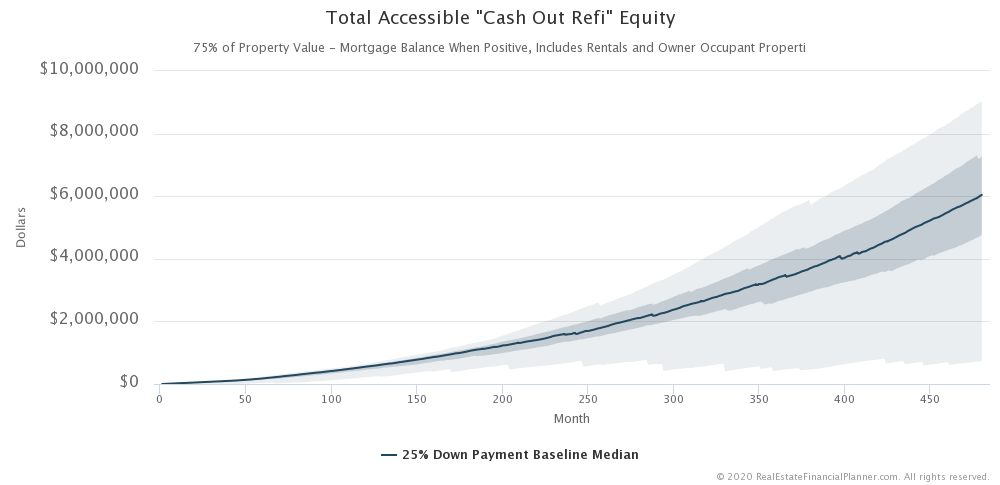
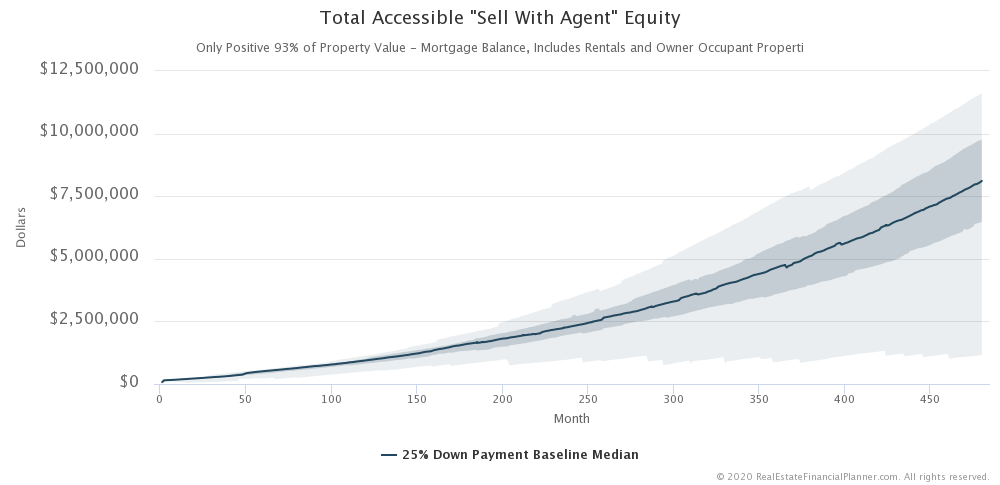
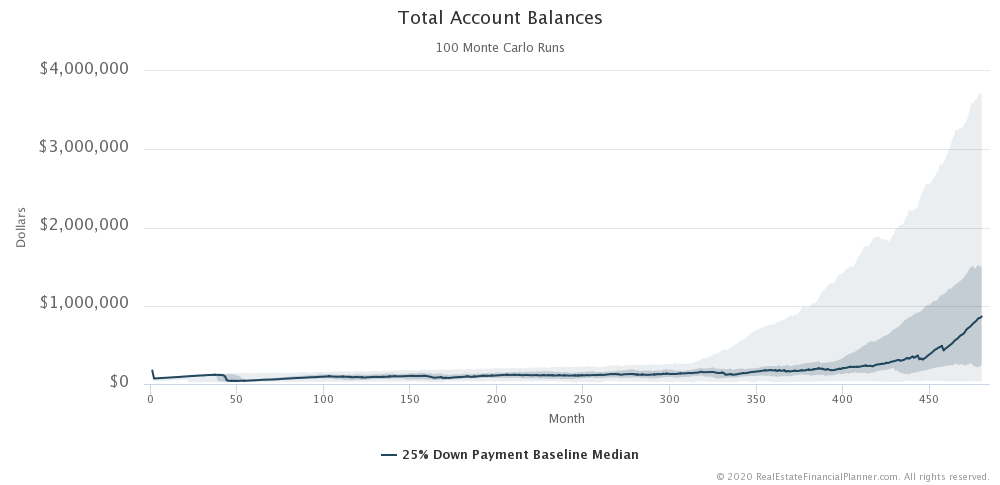
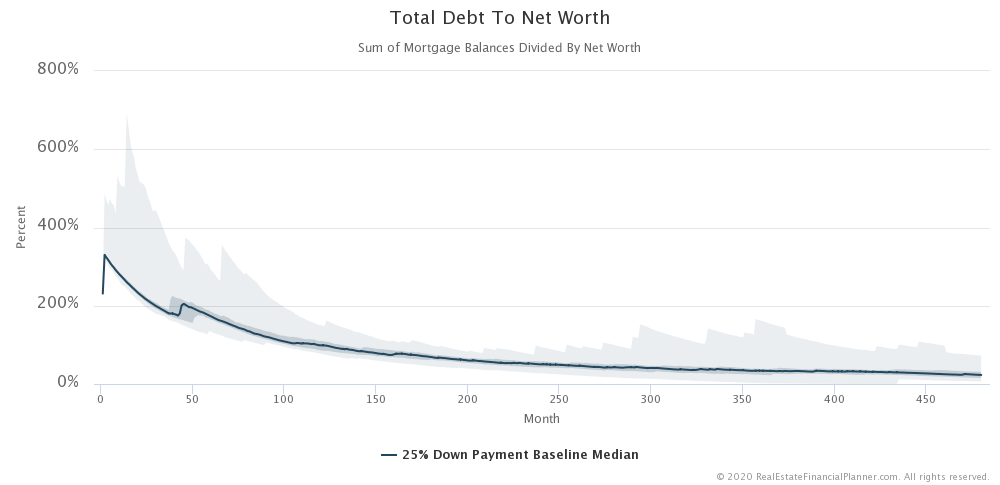
More Charts
And, here are some of the additional charts from the presentation.
Expanded Version of This Class
I think I could easily do a full day seminar on modeling market corrections (if not longer). In an expanded version of this class, I might cover:
- What are you starting with… how many properties, how much cash, etc.What you do with your money while waiting? Savings, bonds, stocks, small business, etc.
- How you buy in… all at once, once per year, once every 6 months, etc.
- Strategy… 25% down payments, 20% down payments, 15% down payments, Nomad™, house hack, BRRR, creative financing, etc.
- Number of properties… do you stop at 1, 2, 5, 10, 100 properties?
- Dollar amounts… do you start with nothing, $10K, $100K, a million or more?
- Down payment %… do you opt to do 25%, 20%, 15%, 5%, 3.5% FHA, nothing down VA loans or USDA loans?
- Reserve amounts… do you choose to be aggressive and keep only $10K in reserves or $100K or $500K?
- Private Mortgage Insurance – if you choose to buy properties with less than 20% down payments, which of the three ways do you choose to deal with PMI?
- Interest rates varying… do you model this with interest rates remaining at all time lows? Or, do you model a more realistic future?
- Property characteristics… are you buying single-family-homes, duplexes, triplexes, fourplexes, commercial, industrial, apartments?
- Stock market and real estate market in “sync” or asynchronous… do market corrections happen independently (like history might suggest) or do they happen together, synchronously?
- Inflation – will we remain in a period of low inflation? Or, will we see a period of high inflation? Hyper-inflation? Or… gasp… negative inflation?!
IMPORTANT NOTE: Based on what I model, we are very likely to see very different results. It is best to model your specific situation by entering your stuff in the Real Estate Financial Planner™ software and then evaluating a variety of market corrections and plans.
Ultimate Guides
For additional Ultimate Guides we’ve created, check out these:
More posts: Ultimate Guide