The World’s Greatest Real Estate Deal Analysis Spreadsheet™
Version 2024.02

Subscribe to our substack to have the spreadsheet emailed to you…

Watch the Video Overview…

All Other Deal Analysis Spreadsheets Are Wrong…

If you’re not accounting for:

  • Reserves (including the return you earn on your reserves)
  • All 4 areas of returns (appreciation, debt paydown, depreciation and cash flow)
  • Return on equity (actually your True Net Equity™ after expenses)
  • The cost of accessing equity, and
  • Negative cash flow (if applicable)…

…when analyzing deals, then you’re analyzing deals all wrong.

The World’s Greatest Real Estate Deal Analysis Spreadsheet™ is the only spreadsheet that analyzes deals correctly… all other spreadsheets come up short and do not correctly account for everything above.

Track Your Investment Property Return Over Time

Plus, The World’s Greatest Real Estate Deal Analysis Spreadsheet™ allows you to track your investment and returns over time.

Enter in how much your property appreciated each year that you own it and see the spreadsheet update all your returns.

Do the same with debt paydown, cash flow and depreciation. Easily track how your rental property is performing by updating the spreadsheet with numbers for each year in the Overrides tab.

Simpler to Use

The new rental property analysis spreadsheet is simpler to use.

We’ve moved all the information we rarely look at when analyzing a deal from the main Inputs & Dashboard tab to the Overrides tab.

We took the 9 most important decision-making metrics, made them easy-to-read charts that take up 80% of the main tab.

More Powerful Than Ever

First, we simplified the input for making a decision if the property is a deal or not.

But, we also empowered you to do what you’ve never been able to do before in a deal analysis spreadsheet… override EVERYTHING.

The new rental property analysis spreadsheet is more powerful than ever because you can edit just about any input, for any year. This allows you to model incredibly complexed and nuanced situations like changing tax situations, changing costs to sell or refinance depending on the year, plus much, much more.

Improve Cash Flow

Use the spreadsheet and our comprehensive list of 88 strategies to improve cash flow on your rental properties to ensure that you’re only doing the best, most profitable deals.

Have suggestions? Found an error? Email [email protected]

Everything on One Screen

Use “Full Screen Mode” in Excel with 100% zoom to see the entire Inputs & Dashboard on one, reasonably-sized screen (1920×1080).

The World's Greatest Real Estate Deal Analysis Spreadsheet™
The World’s Greatest Real Estate Deal Analysis Spreadsheet™

Easily Print to One “Landscape” Page

Want to print your deal analysis to share it with others? Easily print the entire Inputs & Dashboard on one “landscape” page.

TWGREDAS - Print to One Landscape Page
TWGREDAS – Print to One Landscape Page

Legal-sized paper is better, but letter-sized paper works.

Simplified Inputs

Everything you need, but nothing you don’t.

Simplified Inputs for The World's Greatest Real Estate Deal Analysis Spreadsheet™... and you can still override EVERYTHING in the Overrides tab.
Simplified Inputs for The World’s Greatest Real Estate Deal Analysis Spreadsheet™… and you can still override EVERYTHING in the Overrides tab.

Color coded:

  • Manilla Boxes: Inputs
  • Gray Background with Blue Text: Calculated

Advanced Input Overrides

Feel empowered: override just about ANY variable using the Overrides tab.

Override Just About Anything

Sparklines help understand what is happening at a glance.

Drill down more if needed and see Return Quadrants™ and more calculated.

Different Tools

  • The World’s Greatest Real Estate Deal Analysis Spreadsheet™ = analyzing a deal/property.
  • Real Estate Financial Planner™ = analyze/compare entire investment strategy/strategies, goals and risks.

There are plenty of different real estate investing strategies… some better than others depending on your specific goals. Find out which works for you with the Real Estate Financial Planner™ software.

The Real Estate Financial Planner™ software gives you unprecedented insight into how your entire strategy of stocks, bonds, commodities and, of course, rental properties performs in a variety of market conditions.

It answers questions about how quickly you can achieve financial independence and how much risk you have with each strategy you’re considering with questions like:

  • Should I pay off my rentals? Sell some to pay off others?
  • Should I refinance? Cash out refi? Buy more properties when I refi? Invest in something else?
  • Should sell properties? Buy more properties when I sell? Invest in something else?
  • What if I stop working on this date?
  • What if I take social security on a specific date and/or buy an annuity?
  • Plus, much much more…
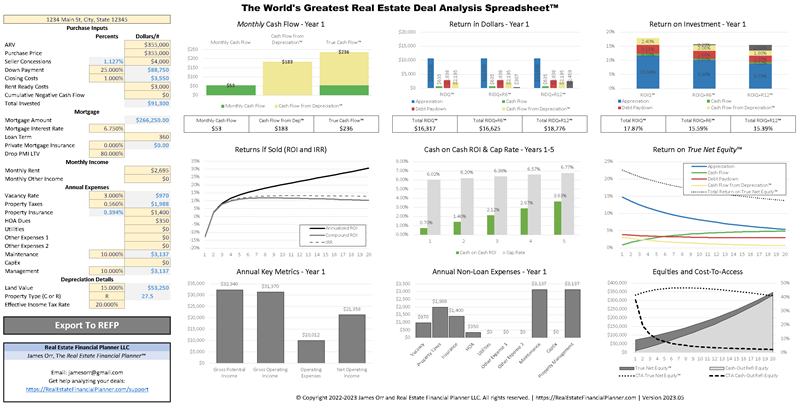
Export to Real Estate Financial Planner™

One-click export will allow you to go straight from deal analysis to full portfolio and strategy analysis.

Easily Export Charts for Presentations

Raising money?

Sharing your deal with a partner, spouse, lender, or banker?

Teaching classes?

Easily export charts from The World’s Greatest Real Estate Deal Analysis Spreadsheet™ to Microsoft Power Point or Microsoft Word.

Export as an image like this:

1 - Monthly Cash Flow - Year 1
1 – Monthly Cash Flow – Year 1

Or, export as a dynamic chart that updates when you make changes to the original spreadsheet like this:

Return in Dollars as Embedded Chart in Power Point from TWGREDAS

9 Primary Charts

The 9 Primary Charts
  1. Monthly Cash Flow – Year 1
  2. Return in Dollars – Year 1
  3. Return on Investment – Year 1
  4. Returns if Sold (ROI and IRR) – Years 1-20
  5. Cash on Cash ROI & Cap Rate – Years 1-5
  6. Return on True Net Equity™ – Years 1-20
  7. Key Metrics – Annual – Year 1
  8. Non-Loan Expenses – Year 1
  9. Equities and Cost-To-Access – Years 1-20

Monthly Cash Flow – Year 1

1 - Monthly Cash Flow - Year 1
1 – Monthly Cash Flow – Year 1

Shows the monthly value of:

Cash Flow tends to be the primary metric folks look at when analyzing a rental property.

Return in Dollars – Year 1

2 - Return in Dollars - Year 1
2 – Return in Dollars – Year 1

This shows you the Return in Dollars Quadrant™ values (in chart form) for year 1.

That’s the dollar amount of each of the following in the first year:

There is more to buying rental properties than cash flow. This chart shows you this succintly.

It answers the questions of:

  • How much did the property appreciate in year 1?
  • How much cash flow did you generate in year 1?
  • How much did you pay down in debt in year 1?
  • How much cash flow did your tax benefits of depreciation generate?
  • What was the TOTAL benefit (in dollars) you gained by owning this property in year 1? The number at the top in bold.

Then, it does the same numbers but also includes the amount you earned from reserves.

We have 2 “flavors” of reserves depending on how people choose to handle their reserves: 6 months of reserves in an account that earns 1% per year (RIDQ+R6™) or 12 months of reserves in an account that earns 8% per year (RIDQ+R12™). For more information on this concept, check out Everything You Learned About Deal Analysis is Wrong – ROIQ+R™.

Return on Investment – Year 1

3 - Return on Investment - Year 1
3 – Return on Investment – Year 1

In the last chart, we showed the DOLLAR AMOUNT from appreciation, cash flow, debt paydown and Cash Flow from Depreciation™… but this chart we show you that dollar amount divided by the Total Invested.

In the case of Return on Investment Quadrant + 6 Months Reserves (ROIQ+R6™) and Return on Investment Quadrant + 12 Months Reserves (ROIQ+R12™) it is the dollar amount divided by the Total Invested PLUS… either 6 months of reserves or 12 months reserves.

Astute investors will recognize that the “cash flow” ROI here is the same calculation as Cash on Cash Return on Investment.

Returns if Sold (ROI and IRR) – Years 1-20

4 - Returns if Sold - ROI and IRR
4 – Returns if Sold – ROI and IRR

This chart shows you the returns you’d earn if you sold the property calculated 3 different ways.

First, the total returns you earned for the entire holding period (after all sales costs) divided by the Total Invested and the number of years you held the property. This is the Annualized Return on Investment (aka Annualized ROI).

Second, the same calculation except the compounding rate of return version. This is the Compound Return on Investment (aka Compound ROI).

And finally, the Internal Rate of Return (IRR) calculation that better accounts for WHEN you put money in and take money out of the property to calculate the return you’re earning on the investment. One could argue that this is the best return to use.

Many investors who plan on selling their property after holding it for a period of time will find this chart invaluable.

Cash on Cash ROI & Cap Rate – Years 1-5

5 - Cash on Cash ROI and Cap Rate - Years 1-5
5 – Cash on Cash ROI and Cap Rate – Years 1-5

In the Return on Investment chart above, we showed Cash on Cash Return on Investment as one of the returns.

It is so important to some investors that we list it again here and compare it to Capitalization Rate (aka Cap Rate).

Most investors prefer to use Cash on Cash Return on Investment, but a good number of investors prefer to use Cap Rate in their decision-making process.

So, here’s both.

Return on True Net Equity™ – Years 1-20

6 - Return on True Net Equity - Years 1-20
6 – Return on True Net Equity – Years 1-20

After year 1, taking the dollar amount of return earned in that year and dividing it by the initial Total Invested when you bought the property becomes a less important measure.

One could easily argue that taking the dollar amount that you earn in that year and dividing by the equity you have in the property that year is a better measure of the return you’re earning on the amount you have in the deal.

Further, one could argue even better that it is not the return you’re earning on gross equity, but rather, the return you’re earning on the money you’d walk away with after sales costs (real estate commissions, closing costs, depreciation recapture tax and capital gains tax).

Really, what you want to know is the return you’re earning on the money you’d get if you exited the deal. If you sold the property, this is the return you’d need to earn on another, different investment to do better than this property.

This chart shows you the return you’re earning from the 4 component returns (appreciation, cash flow, debt paydown and Cash Flow from Depreciation™) divided by True Net Equity™ (equity after all those sales costs) for the first 20 years.

It also shows the total return for all 4 component returns divided by True Net Equity™.

Key Metrics – Annual – Year 1

7 - Key Metrics - Year 1
7 – Key Metrics – Year 1

Some real estate investors would like to know Gross Potential Income (GPI), Gross Operating Income (GOI), Operating Expenses (OpEx), and Net Operating Income (NOI) for year 1.

So, that’s what this chart shows.

Non-Loan Expenses – Year 1

8 - Non-Loan Expenses - Year 1
8 – Non-Loan Expenses – Year 1

Often investors will want to get a feeling for the expenses on the property. This chart shows the non-loan expenses for the property in the first year.

It also includes the dollar amount for the vacancy allowance as well.

Equities and Cost-To-Access – Years 1-20

9 - Equities and CTA - Years 1-20
9 – Equities and CTA – Years 1-20

Some real estate investors will want to either sell the property or refinance the property to access the equity in the property at some point in the future.

This chart shows the amount of equity (after all sales costs… which we define as True Net Equity™) that they’d walk away with if they sold the property.

It also shows the amount of equity they could walk away with if they did a cash out refinance of the property.

Additionally, it shows the cost-to-access the equity in both cases as a percent of the money they’d walk away with.

Did we miss a key metric you use to make a buying decision when analyzing deals? Have suggestions? Found an error? Email [email protected]

You can still drill down into the Overrides tab.

Modeling Variable Returns

Appreciation isn’t always 3% per year (or whatever number you’re using). One year it may be 3%, then next 0%, the next 6.13% and so on.

With The World’s Greatest Real Estate Deal Analysis Spreadsheet™ you can use formulas for OVERRIDES to model variable returns for things like:

  • Appreciation Rate
  • Rent Appreciation Rate
  • Maintenance Rate

And, you can see how your investment might perform with variable returns.

For example, you could use =NORMINV(RAND(),0.03,0.01) to override Appreciation Rate and Rent Appreciation Rate.

The overrides might look like this:

Variable Return Modeling - Appreciation and Rent Appreciation
Variable Return Modeling – Appreciation and Rent Appreciation

And, the new charts on the Inputs & Dashboard might look like this:

The 9 Primary Charts

Professional Sponsorship Licensing

If you’re a professional that works with real estate investors (real estate agents/brokers, lenders, Accountants/CPAs, and financial planners) and want to license The World’s Greatest Real Estate Deal Analysis Spreadsheet™ to have your contact information on it so you can give it to your clients, we offer the ability to license it and have your contact info on it.

Professional Sponsorship Licenses Available

Available in Two Editions: Silver and Gold

The Silver Edition includes everything above with the two tabs: Inputs & Dashboard and Overrides.

The Gold Edition has yet to be released but will have extra tabs and have additional dashboards/insights specifically for:

  • Partnerships – Extra dashboard and insight for modeling buying your property with more than one partner with, possibly, unequal investments, cash flow and equity allocations between the partners.
  • Return Quadrants™ – A summary tab showing a variety of Return Quadrants™ for your property.
  • Lease-Options – Extra dashboard and insight if you’re considering selling the property to a tenant-buyer using a lease-option.
  • Should I Sell My Property – Extra dashboard and insight if you’re considering selling your property.
  • Should I Refi My Property – Extra dashboard and insight if you’re considering refinancing your property.
  • Track Your Property’s Performance – Because we now allow you to OVERRIDE just about any variable for any year, you can use TWGREDAS™ to keep track of how your property has performed over time and calculate returns based on actual performance (not just pro-forma).

James plans to work on the Gold Edition sporadically, irregularly over the next year or two. He accepts bribes (of significant size) to move the thing you need toward the top of the list. Pay for and schedule a “support” call with James to discuss what you want moved toward the top of the list.

Something wrong? Found an error? Got a suggestion? Email [email protected]

Or, if you need support with your specific situation or property, book a paid support call and we can go over the spreadsheet together.

Other Spreadsheets

The spreadsheet on this page is obviously for deal analysis, but we also offer other spreasheets.

Real Estate Bookkeeping Spreadsheet - Year Summary
Real Estate Bookkeeping Spreadsheet – Year Summary

Maintenance and CapEx Estimator for Rental Property - Advanced
Maintenance and CapEx Estimator for Rental Property – Advanced

Plus many more…

Real Estate Investing Classes and Videos

Check out our free real estate investing classes as well to learn more.

4 thoughts on “Real Estate Deal Analysis Spreadsheet”

  1. Hey James, we’re both ostensibly pretty transactional people but you’ve got so many moving parts going in so many directions, I can’t keep up.
    I’d love to just buy some of your expertise if we could figure out how.
    First off, I’m not your targeted demographic. I’m not an RE investor, but an overly analytical home buyer (Nomad?) buying my own (non-conventional) residence — using investor methods.
    I have a bunch of spreadsheets — but would love to have yours if I can edit it — especially the macros — for my residential purposes.
    Would also love to buy downloadable files or documents on “creative deals” owner carry, wraps, subject to, etc. that I can share with a researcher.
    Thanks,
    Dru

    Reply
    • Thanks for the comment Dru. Sorry you’re not able to keep up.

      Yes, we definitely focus on providing resources for buy-and-hold real estate investors, Nomads™ and house hackers. That is our target audience.

      You’re welcome to download Brian’s spreadsheet (aka The World’s Greatest Real Estate Deal Analysis Spreadsheet). He has it locked down so that anyone who is not an Excel expert can’t mess up the formulas and macros. If you’re an Excel expert you, of course, know how to unlock it so it is fully editable. If you need to ask Brian how to unlock it, you probably shouldn’t be messing with the formulas.

      I don’t think I offer downloadable files or documents for “creative deals” like owner carry, wraps, subject to for you to share with your researcher that I can think of except maybe the spreadsheet I created for modeling buying creative properties using marketing (linked below).

      Reply
  2. Hello,

    Really great resources and lessons. Even though I am from Europe and focus on flats (its europe …), most of the things are applicable.

    Though I really had to dig and change the excel as Depreciation does not exist in Europe. We have here buildings old few centuries and people are still living in them. Also tax on RE is like nonexistent here 🙂

    If you have more ppl watching from EU, maybe add a feature to disable the depreciation part of the excel.

    Kind Regards,
    Kamil.

    Reply

Leave a Comment