As a real estate investor, your credit can be an important factor in how well your investment performs. How much of a difference does your credit score make? That’s what I will cover below.
Why Your Credit Score Matters
There are real estate investing strategies that you can do with little or no money and no or bad credit, but (as you might imagine) they do limit the number and types of deals you can do. We won’t be discussing the no and bad credit strategies here specifically. Instead, we will focus on how to improve your credit so you can do additional and better deals.
Better Credit for Better Deals
Improving Your Credit Score as a Real Estate Investor
In this class, Jassen covers how your credit score is calculated, as well as how you can improve your credit score to maximize the return on your investments.
Later in the presentation, Jassen (with a little help from me) covers exactly how your credit score impacts both the dollar amount of your returns and the percentage return on investment for a number of scenarios.
Credit Score Impact When Buying Rental Property
One of the comparisons I did for the class was to compare how different credit scores impact your returns when buying a rental property with 20% down payment. I called a local lender and asked them to send me the interest rate for a variety of credit scores with 20% down payment buying a rental.
I share the data he replied with below, but keep in mind that this information is a snapshot in time. You will need to call your own lender to get your own rates.
Here’s what my lender told me:
- For someone with 740 or better credit score, they would get 5.375% with no points (to buy down the rate) and 20% down payment.
- 720-740: 5.5%
- 700-720: 5.75%
- 680-700: 5.875%
At the time, this lender said they couldn’t do a loan to an investor with less than 680 credit score, and that anything above 740 did not improve the interest rate.
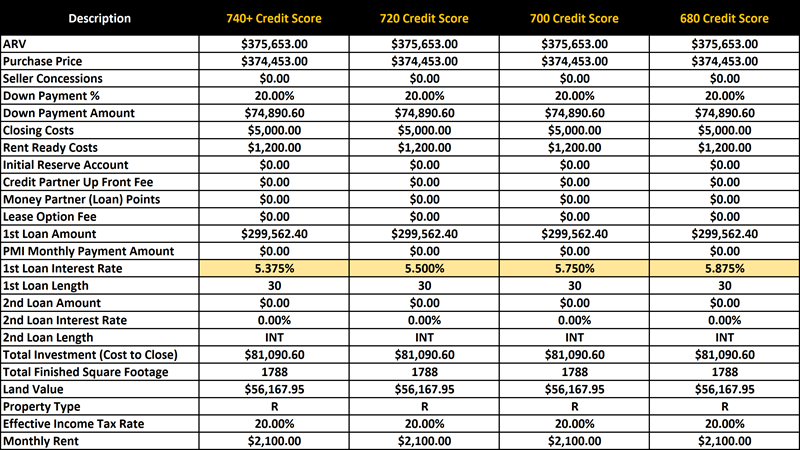
Then, I took our rental property calculator for Excel and ran the same property through all four credit situations above.
20% Down Payment Non-Owner-Occupant
This is a table summarizing my inputs for the four scenarios.
When we compare the four areas of return (appreciation, cash flow, debt paydown, and Cash Flow from Depreciation™), we can see which are affected by someone’s credit score.
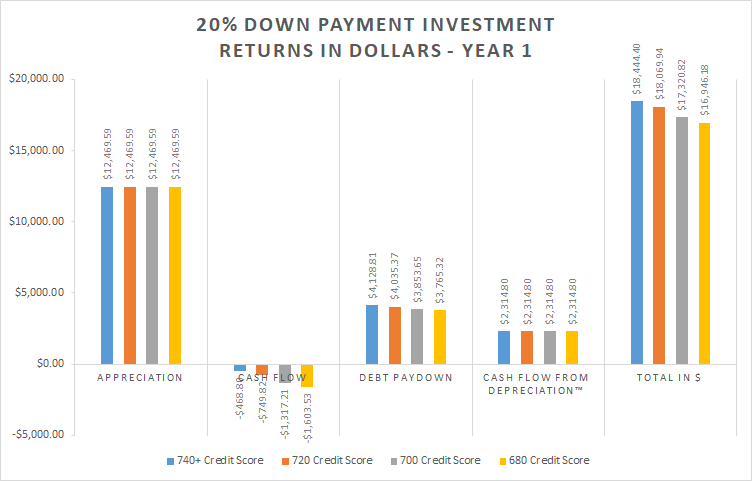
As you can see in the chart above, appreciation is unaffected by someone’s credit score. The property will go up or down in value regardless of what kind of credit the buyer has.
Your tax benefits of owning a rental property, the Cash Flow from Depreciation™, is also not credit dependent. You get the same tax benefits from depreciation from the government regardless of your credit score.
However, cash flow and debt paydown in Year 1 are both affected by your credit score as a real estate investor, because both of those areas of return are related to the interest rate on your mortgage.
Overall, buying the exact same property but with different credit scores can change your overall return from $18,444 to $16,946 — or about $1,500 in Year 1 when comparing the best credit score of 740 to the worst of 680. Compound this over a number of years and a number of properties, and that becomes significant.
How does this impact your return on investment (as a percentage)? Let’s look at that chart next.
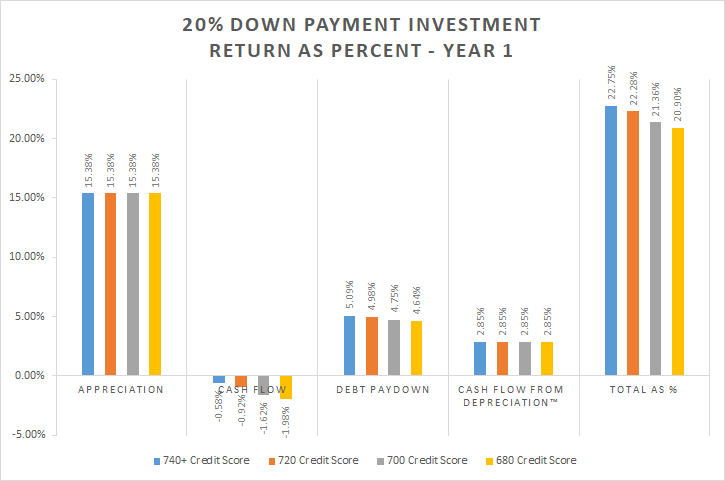
As you can see, you go from a 22.75% return on investment with great credit to a 20.90% return on investment (from all four areas of return combined).
Credit Score Impact When Buying Owner-Occupant Properties
Owner-occupant properties are a little different, because your credit score can also impact your private mortgage insurance payment as well if you’re putting less than 20% down.
I ran three different scenarios for owner-occupant financing with a variety of credit scores.
- 20% down payment (with no PMI)
- 10% down payment (with monthly PMI) and…
- 5% down payment like a Nomad™ (with monthly PMI)
I’ll skip the 10% down payment charts (since we cover them in the video above), but I will look at the 20% down payment and the 5% down payment scenarios.
20% Down Payment Owner-Occupant
Let’s start with the 20% down payment owner-occupant property, since the 20% down payment non-owner-occupant scenario is still be fresh in our minds.
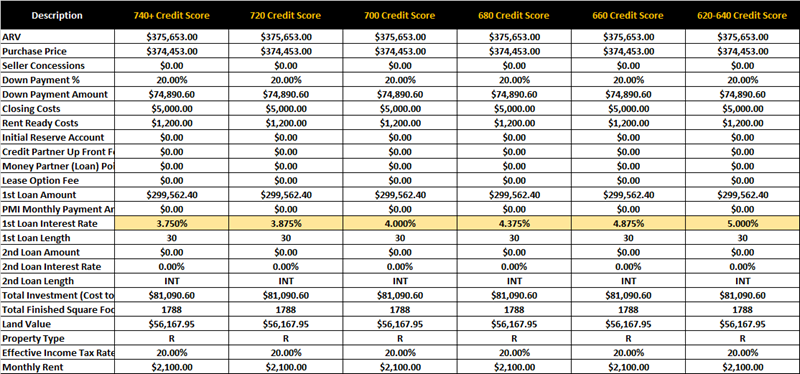
As you can see in the chart above, we have six different credit score ranges for conventional, owner-occupant financing, with six different interest rates from when I emailed a local lender.
It varies from 3.75% with a greater than 740 credit score and it goes to a full 5% interest rate with a credit score between 620 and 640.
Even though we’re not renting it in year, what if we were? If you’re Nomading™, you’d really start renting it in Year 2, but to make the comparison to the 20% down non-owner-occupant as close to an apples-to-apples comparison as possible, let’s pretend we are renting it in Year 1.
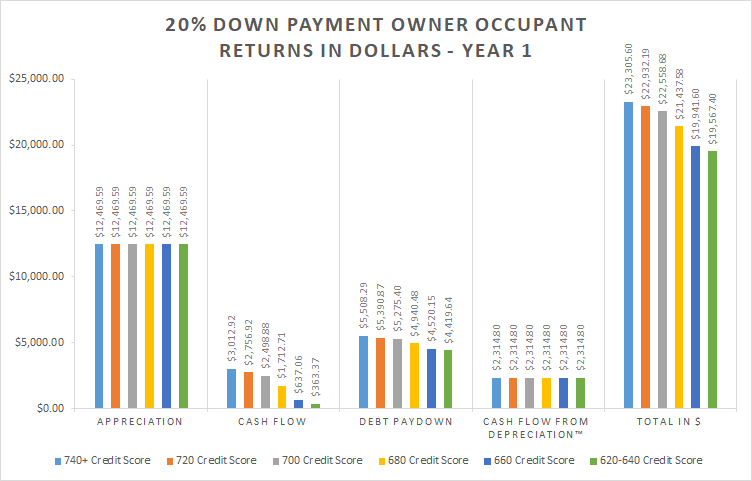
As you can see in the chart above, appreciation and Cash Flow from Depreciation™ remain the same regardless of credit score. However, cash flow and debt paydown do vary depending on your interest rate, which is directly impacted by your credit score.
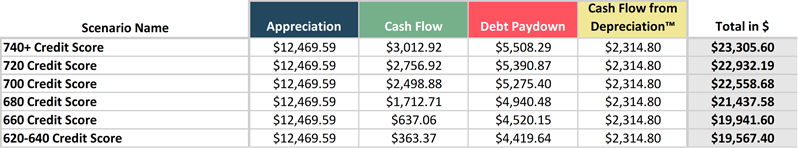
We vary from having $3,012.92 in cash flow with the best credit score (above 740) to just barely above break-even at $363.37 per year with a credit score between 620 and 640. Here’s the same data presented in a table:
But what if we’re really interested in seeing how that impacts the return on investment and not just the raw dollar amount of the return? That’s the chart below.
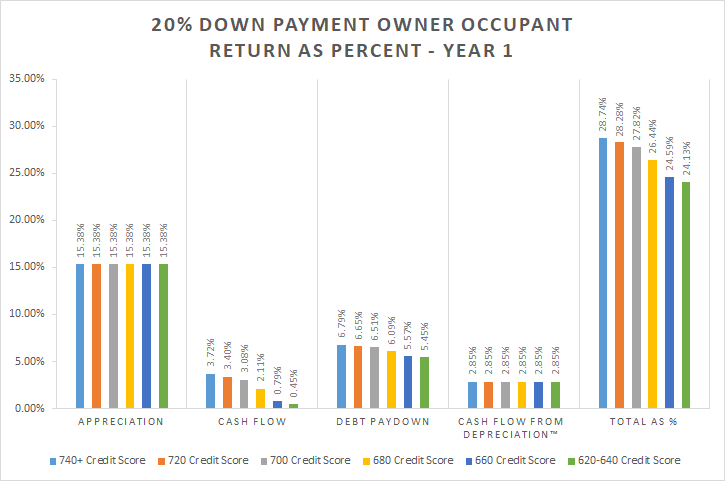
In this chart, you can see that your overall return on investment varies from 28.74% with the best credit score of 740+ all the way down to 24.13% with a credit score between 620 and 640.
5% Down Payment Owner-Occupant With Monthly PMI
What if we Nomad™ with just 5% down? How does your credit score impact your returns with that loan option? Let’s find out.
The following table (click to zoom in on it), shows you a variety of credit score scenarios, and how both the interest rate and the private mortgage insurance varies depending on your score with just 5% down payment.
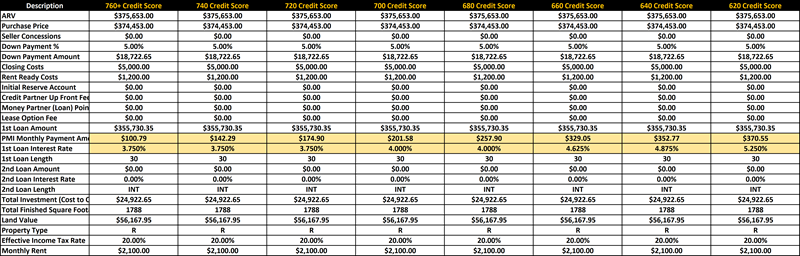
There are more credit score scenarios because even though the interest rate does not change with some of the credit score changes, the private mortgage insurance does.
- Interest rate varies from as low as 3.75% with a credit score of 720 or better to 5.25% with a credit score of 620 to 640.
- Private mortgage insurance is as low as $100.79 to as high as $370.55 if your credit score is between that 620 to 640.
Again, we can’t really rent it out in Year 1, because to be able to buy a property as a Nomad™, we need to live in it for the first year. (It is a requirement of the lender for owner-occupant loans where we are able to put just 5% down payment). But, if we could rent it out in Year 1, what would the return in dollars look like?
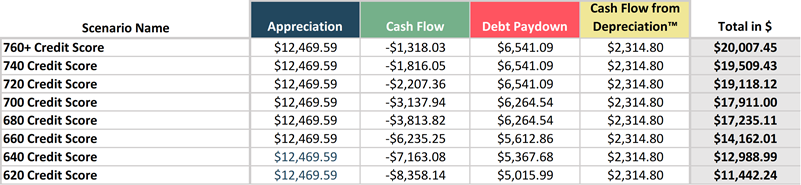
Cash flow, with just a 5% down payment, varies between -$1,318.03 and -$8,358.14 per year! Wow… that’s a really wide spread of cash flow numbers.
You need a credit score of 720 to have Cash Flow from Depreciation™ offset the negative cash flow. Anything lower than that, and you really have negative cash flow (even taking into account the tax benefits from Cash Flow from Depreciation™).
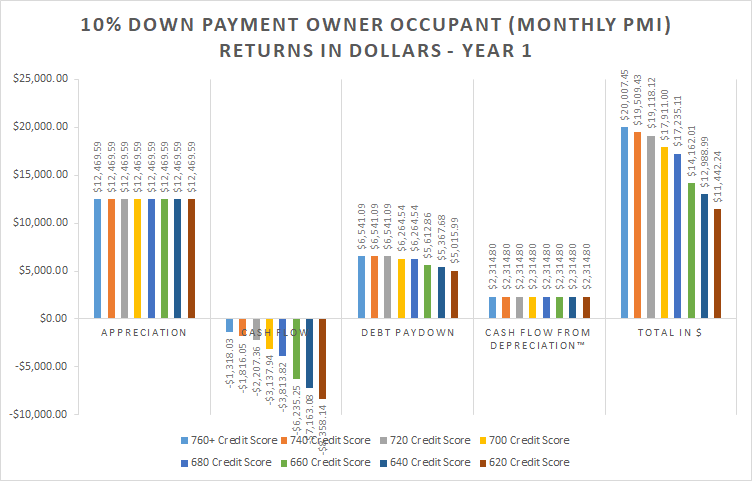
In the chart above, you can see the impact in all four areas of return. Appreciation and Cash Flow from Depreciation™ are not impacted by credit score. Nothing new there.
Cash flow does vary with each different credit score. That’s because the interest rate (and therefore mortgage payments) and private mortgage insurance do vary.
With debt paydown, some are the same and some differ. Debt paydown is only impacted by credit score, so in credit scores where the interest rate didn’t change, we’d expect to see the same debt paydown amount. And that’s what we do see.
When the credit score causes a change in rate, the debt paydown amount does change.
Looking at the summary, Total in $, you can see that the overall return varies from $20,007.45 with the best credit score to as low as $11,442.24 with a credit score between 620 and 640. That’s a huge difference.
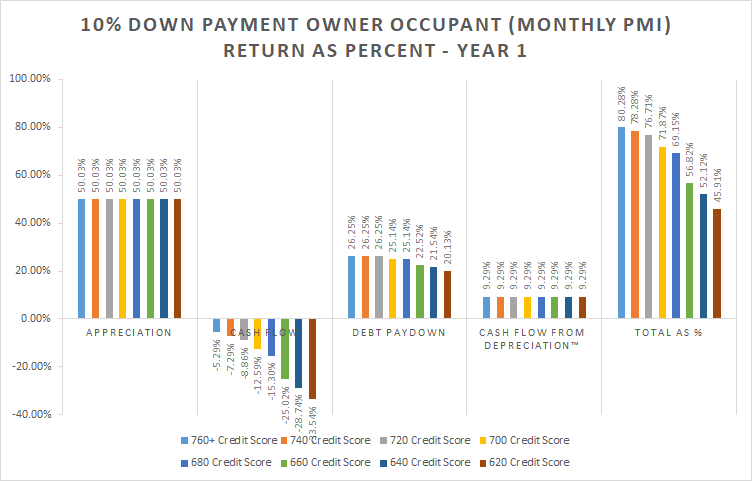
In the chart above, you can see the same data for the 5% down payment owner-occupant scenario, but as a return on initial investment instead of just raw dollars. The return varies from a best-case scenario of 80.28% return with the best credit score (above 760) to a low of 45.91% for credit scores of 620 to 640.
When did a yearly 45% return on your money in the first year become a bad return? I guess only when you compare it to the 80% you could have gotten if you had great credit.
Conclusion
If you have great credit: awesome! Work on keeping it by watching Jassen’s class recording above and avoiding the things that can tank your credit score. Your credit matters to you as a real estate investor.
If you don’t have great credit, I hope that now you can see why it is important to work on it. Watch Jassen’s class and follow some of the advice he gives on how to improve your score.
Even small improvements will result in improvements to your cash flow and debt paydown returns. I believe it is worth the effort.
Ultimate Guides
Interested in checking out more of our “Ultimate Guides”? Here are some for you to consider:
More posts: Ultimate Guide