The Cash Flow Power Meter™ is a new way to evaluate rental property cash flow. It presents information we might otherwise see in a Return in Dollars Quadrant™, Return on Equity Quadrant™ or Return on Investment Quadrant™ in a new, simple and powerful way.
Before I start explaining what the Cash Flow Power Meter™ is and how we use it, I want to say: if you invest in a real estate market that has positive cash flow, you should absolutely be buying properties with positive cash flow. The need for the Return in Dollars Quadrant™, Return on Equity Quadrant™ and Return on Investment Quadrant™ in a positive cash flow real estate market is as important as anywhere else.
However, in real estate markets where it is challenging or near impossible to purchase properties with positive cash flow as a Nomad™ or house hacker with 0%, 3%, 3.5% or 5% down payments or as a buy-and-hold real estate investor with 15%, 20%, 25% or more down the Cash Flow Power Meter™ is an exciting, powerful new tool.
Watch James (and a little bit of Brian) in the 1 hour and 25 minute keynote unveiling the full Cash Flow Power Meter™:
This class was taught on October 28, 2020.
I’m a Real Estate Broker located in Northern Colorado and it is challenging to find properties that cash flow with 20% down payments. In fact, in our market we’re lucky to have break-even cash flow if we are managing the property ourselves with 20% down payment or be break-even with professional property management with 25% down payment.
In the past, when I’ve sat down with clients to discuss a deal they are considering buying we’d first look to see if it had positive cash flow with 20% down payment. In many cases we’d discuss the several benefits of increasing their down payment from 20% to 25% and we would analyze the property to see if the property had positive cash flow with professional property management with 25% down payment.
In our market, self-managed properties with positive cash flow with 20% down and professionally managed properties with positive cash flow with 25% down tend to be amongst the best deals. However, there are a large number of properties where we would be break-even or slightly negative.
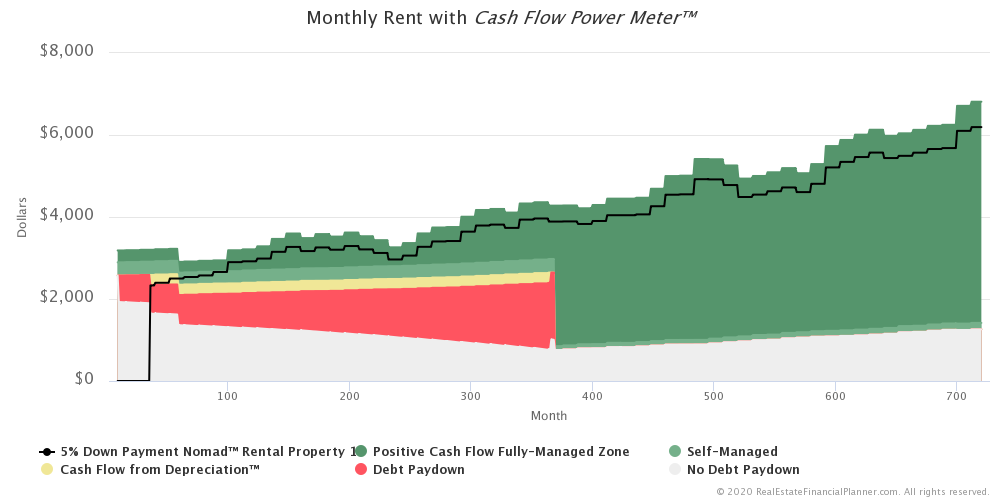
If we were going to buy the property as a Nomad™ with a smaller down payment (often 5% down payment conventional owner-occupant financing), the chance of us having positive cash flow after we live it in for a year and then convert it to a rental—even with the better interest rate we get as an owner-occupant—was very, very low.
Often house hackers can boost the income on their properties and achieve better cash flow than a Nomad™ that is converting the property to a more traditional rental.
For clients that had less than amazing cash flow, the next thing I’d often look at would be if they have positive cash flow if we included the benefit of the Cash Flow from Depreciation™. If a property, including the cash flow they’d get from the tax benefits of depreciation, is positive, that’s often a decent rental. In those cases, you’re not “feeding the property” each month.
Finally, if cash flow is low enough that—even with the Cash Flow from Depreciation™—it is not positive… then I might ask: is the benefit of the tenant paying down the debt on the property better than the amount you need to “feed the property” in the form of negative cash flow monthly?
Another way of asking this is: if I were to get an interest only loan on this investment property, would it have positive cash flow then?
With the Cash Flow Power Meter™, the answers to this series of questions becomes simply clear and obvious.
Here’s how it works with a few examples.
This Property’s Cash Flow
When you enter a  Property
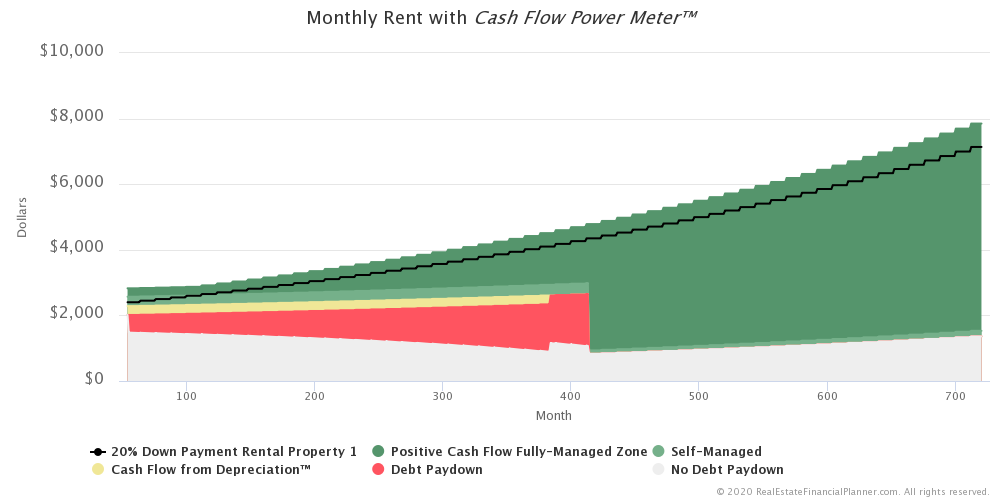
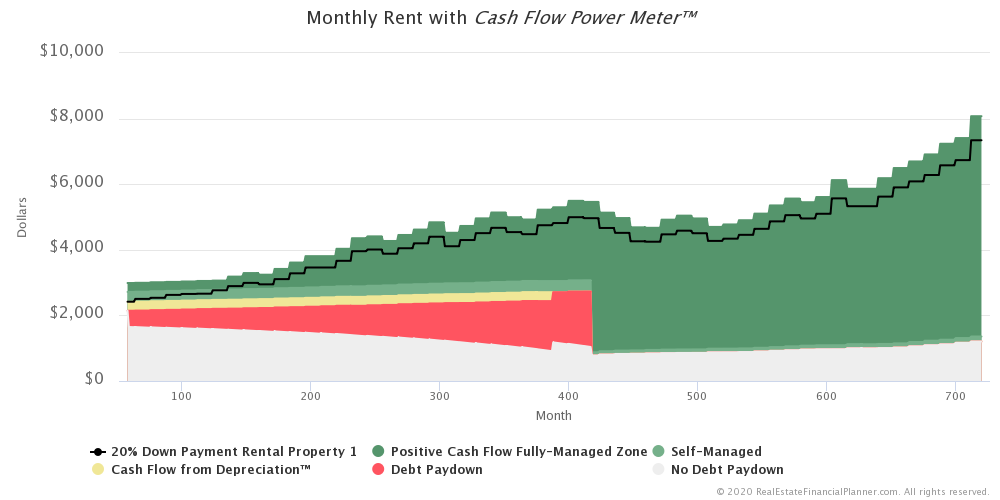
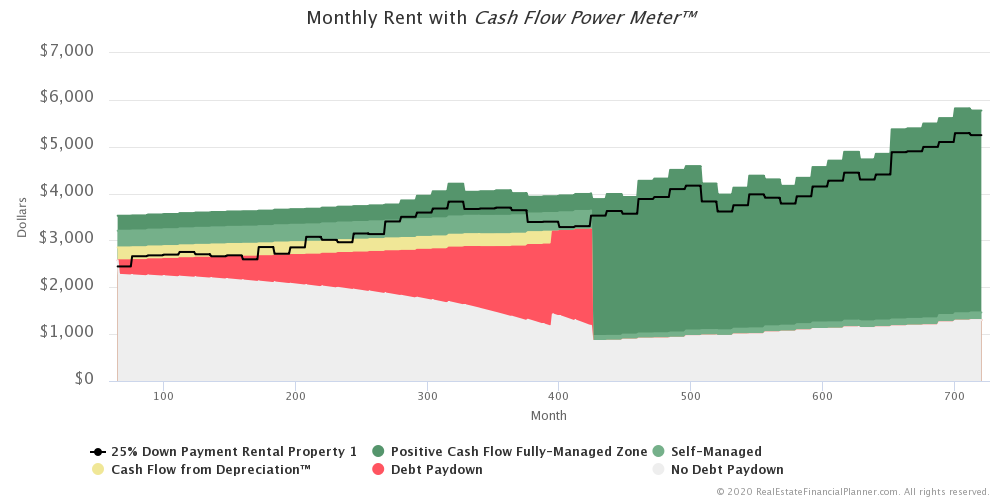
The dark black line shows you how this property is scoring on the Cash Flow Power Meter™.

Positive Cash Flow With Professional Property Management
As you can see in the example above, the dark black line appears in the dark green section of the Cash Flow Power Meter™. The dark green area represents the Gross Potential Income (rent and any additional income) for the property where you’d have positive cash flow with full, professional property management (based on the property management percentage you entered for the Property
If the dark black line on the Cash Flow Power Meter™ appears in the dark green area, this property has positive cash flow with professional property management. The farther into the green the black line appears, the stronger the cash flow.
As another example, here’s a property that is owned free and clear and has super strong cash flow.

As you can see in the example above, it would take a pretty significant decline in Gross Potential Income to get to the light green area.
Positive Cash Flow Self-Managed
The lighter green area is the Gross Potential Income where you would still have positive cash flow if you self-managed the property. Of course, if the dark black line was in the lighter green area and you opted to hire a professional property manager, you would have negative cash flow.
The following example shows a property where you would have positive cash flow if you self-managed.

If you’re accustomed to our Return on Investment Quadrant™, you will notice the Cash Flow Power Meter™ using the same color theme. What we would normally display in the green quadrant (Cash Flow) is still green in the Cash Flow Power Meter™. It is however broken out into two shades of green: one for fully managed cash flow and one for self-managed cash flow. This better reflects a choice we have with how we opt to manage the property.
Side note: the family of quadrants do NOT make the distinction of whether you’re self-managing or having your property professionally managed. It shows cash flow in the same single-shade-of-green quadrant for whatever you’ve used in your deal analysis (self-managed or professionally-managed).
Positive Cash Flow Accounting for Cash Flow from Depreciation™
The yellow area of the Cash Flow Power Meter™ is from the tax benefits of owning a rental property. It represents the Cash Flow from Depreciation™. It really is the Gross Depreciation benefit multiplied by your estimated Effective Income Tax to give you an educated guess about how much money you should get back on your tax returns from owning this investment property.
We call Gross Depreciation times your Effective Tax Rate: Cash Flow from Depreciation™. And that’s what’s represented in the yellow area on the meter.
If the dark black line appears in the yellow area it means that this property as you’ve analyzed it would have positive cash flow, managing it yourself when you take into account the money you’re likely to get back on your tax return from depreciation.
Here’s an example where the property would have positive cash flow if we accounted for Cash Flow from Depreciation™.

Positive Cash Flow with Debt Paydown
The red area of the chart shows where a property would have positive cash flow if you had gotten an interest only loan.
In other words, with the loan you choose you have negative cash flow, but the benefit you’re getting from debt paydown (the red colored quadrant in the Return on Investment Quadrant™) is greater than the negative cash flow.
Negative Cash Flow
The final area is the gray area of the meter. If your dark black line is in the negative cash flow area, that means that you’re not making positive cash flow. In fact, your cash flow is so negative that your tenant is not even paying down your loan enough to justify the negative cash flow you’re putting into the property each month.
In this case, you’re likely speculating on the property value going up (appreciation). Appreciation is the only quadrant of the Return on Investment Quadrant™ not represented in the Cash Flow Power Meter™.
Factors
What affects the Cash Flow Power Meter™?
It is unique to each property. So, changing any of the typical inputs that affect cash flow, tax benefits of the rental property and debt paydown all have an impact.
For example, if you choose to buy down your interest rate, that should reduce your mortgage payment which means it will make it more likely for you to have positive cash flow. It also increases how much you pay down on your loan because lower interest rates have greater debt paydown earlier in their amortization schedules. So, the red area of the meter will be larger.
You may also want to know that the meter changes over time. Each month the debt paydown changes. Maybe you get a new lease with higher (or lower) rent. The meter is not static but changes over time as well as cash flow, debt paydown and depreciation on your property changes. Side note: depreciation tends to be a fixed dollar amount but can go away after the depreciation period.
If we look back at the example of the property we owned free and clear of all mortgages, you’ll notice there isn’t an red section for debt paydown at all. We don’t have a loan, so there is no benefit from debt paydown.
Over Time
We also added the Cash Flow Power Meter™ to the Real Estate Financial Planner™ software when you view the  Rent
Rent
Since the Cash Flow Power Meter™ is UNIQUE and calculated for each property individually, you must select a single property and then turn on the Cash Flow Power Meter™ underlays to see it.
The following are some examples (most of these from Peter’s story considering 5%, 20% or 25% down payments):


Try it out on your own Properties
Questions
I plan to teach a number of classes about the Cash Flow Power Meter™, but if you have any questions in the meantime, please feel free to leave a comment.