Are you looking for information on how to invest $100K? If yes… then grab a cup of your favorite beverage and buckle up for the ride of your life.
Below, I have laid out detailed “financial plans” for investing $100K in a savings account, CDs, bonds, stocks as well as an assortment of real estate strategies.
And, if you’re thinking to yourself… well, I really have $110K… or, I have $10K… or any amount for that matter… you can, quite easily, just change the assumptions in the  Scenarios below, rerun them in your own Real Estate Financial Planner™ account and see the new customized results for your specific situation.
Let’s begin…
Investing $100K in a Savings Account
We will start with a super simple and… what most people would consider to be a too conservative Scenario… investing $100K in a savings account.
A quick search for interest rates on savings accounts pulls up that you can, pretty easily, find a savings account that is paying 2% per year. Some a little higher; some a little lower.
So, what if you invested $100K and earned 2% per year. That’s what we did in this example.
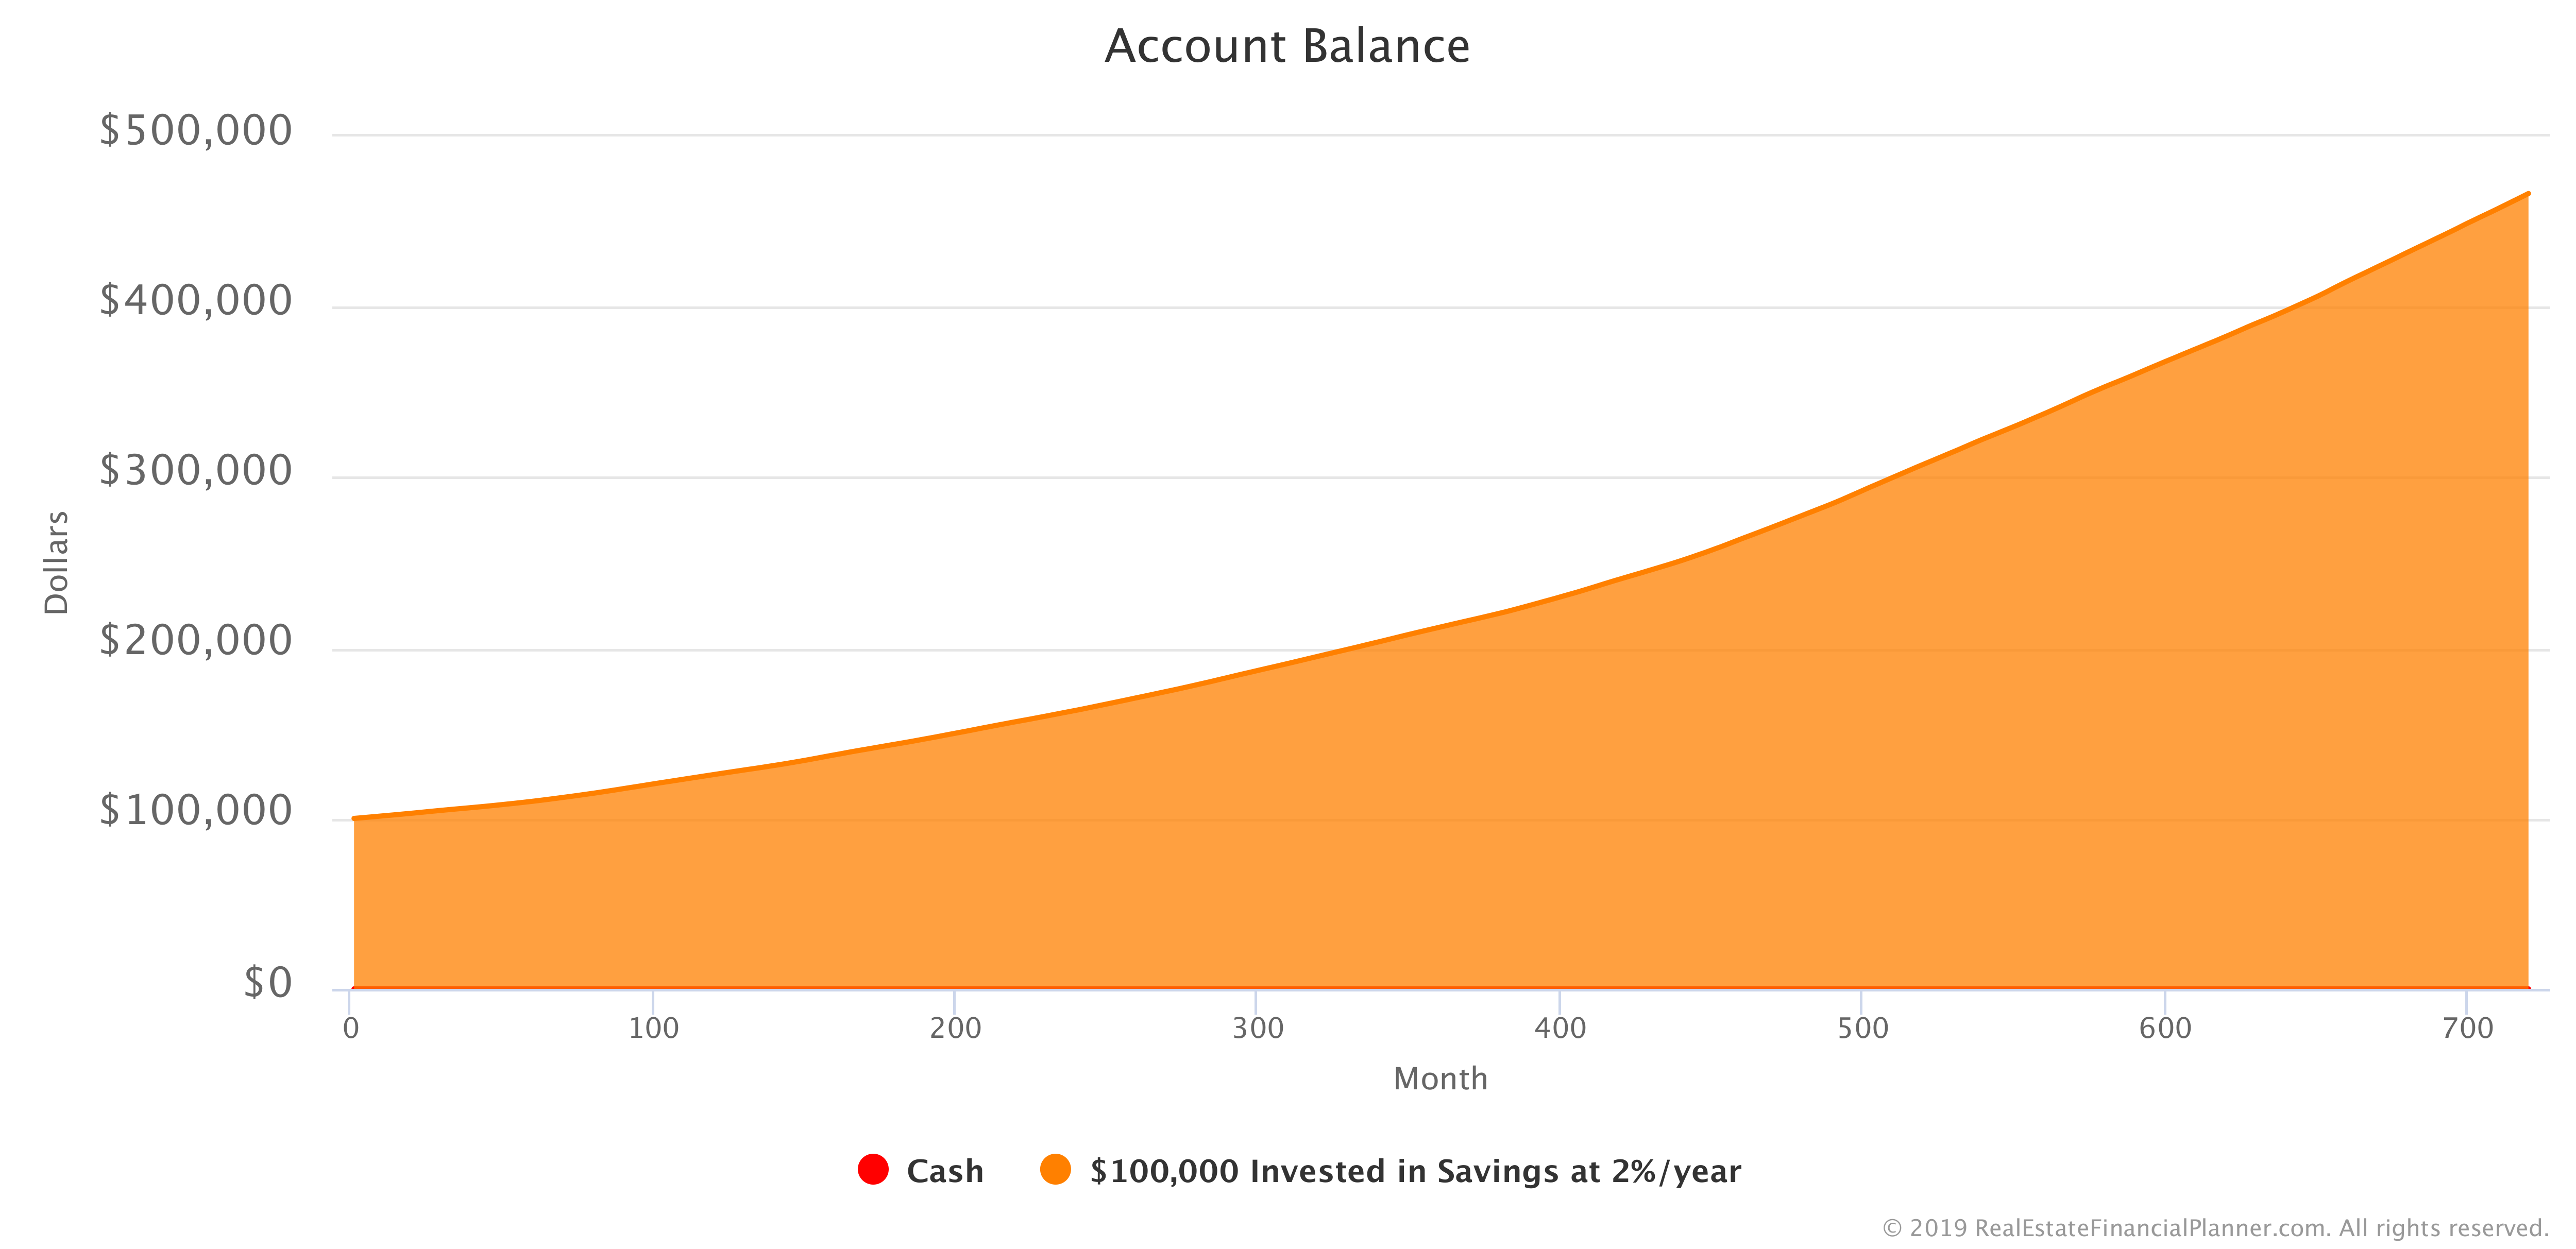
In this Scenario you invested $100K in a savings account earning 2% per year and… well, that’s about it.
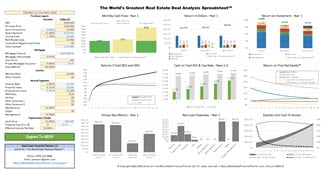
Here’s a  Chart showing your
  Account balance in the savings account over time.
It shows 720 months, that’s 60 years, of investing and compounding.
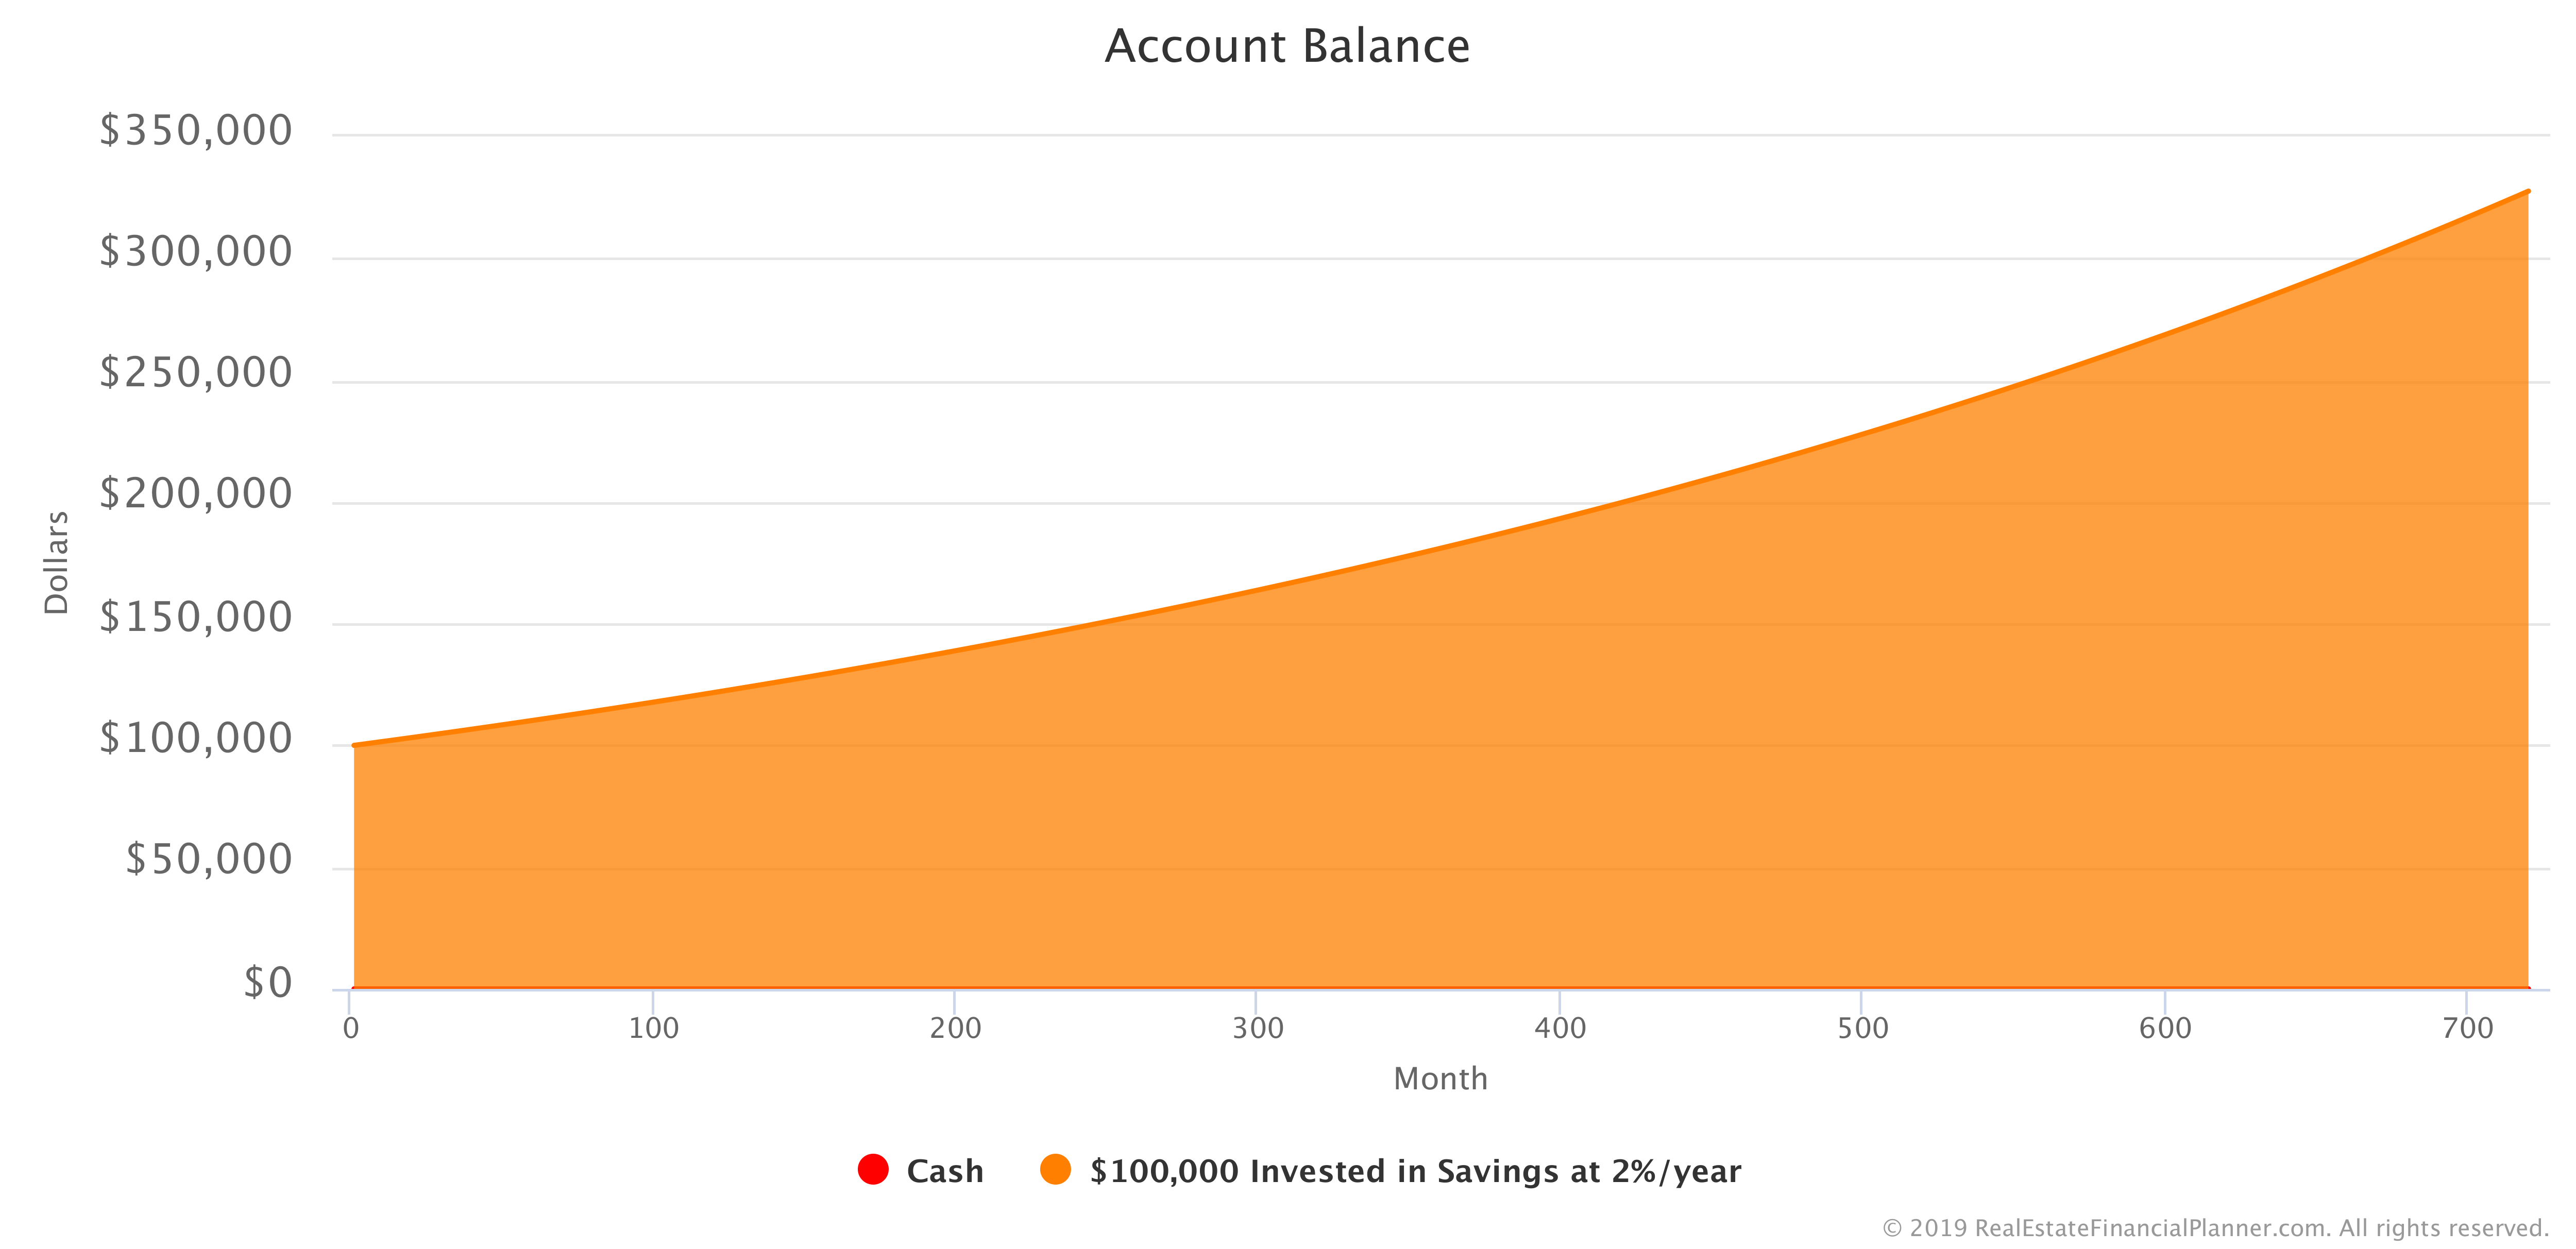
We assumed that your rate of return for investing in the savings account remained constant at exactly 2% per year for the entire 60 years that we ran this Scenario.
I know it seems silly, but here’s a chart showing our fixed, 2% per year interest rate.
If you want to copy this Scenario to your own Real Estate Financial Planner™ account as a starting point for changing the assumptions or adding to the complexity, you can do that using the button directly below.
Login to copy this Scenario. New? Register For Free
Scenario into my Real Estate Financial Planner™ Software
SS 009 Investing $100,000 in Savings at 2%/yr with 2 Accounts, 0  Properties, and 0
  Rules.
Or, read the detailed, computer-generated, narrated  Blueprint™
Variable Rate of Return for the Savings Account
But, what if we varied the rate of return that we could get in the savings account each year? That’s what I did in this next example… instead of having a fixed 2% per year rate of return for the savings account, I made it variable.
Each time we run this Scenario with a variable rate of return, our results will be different.
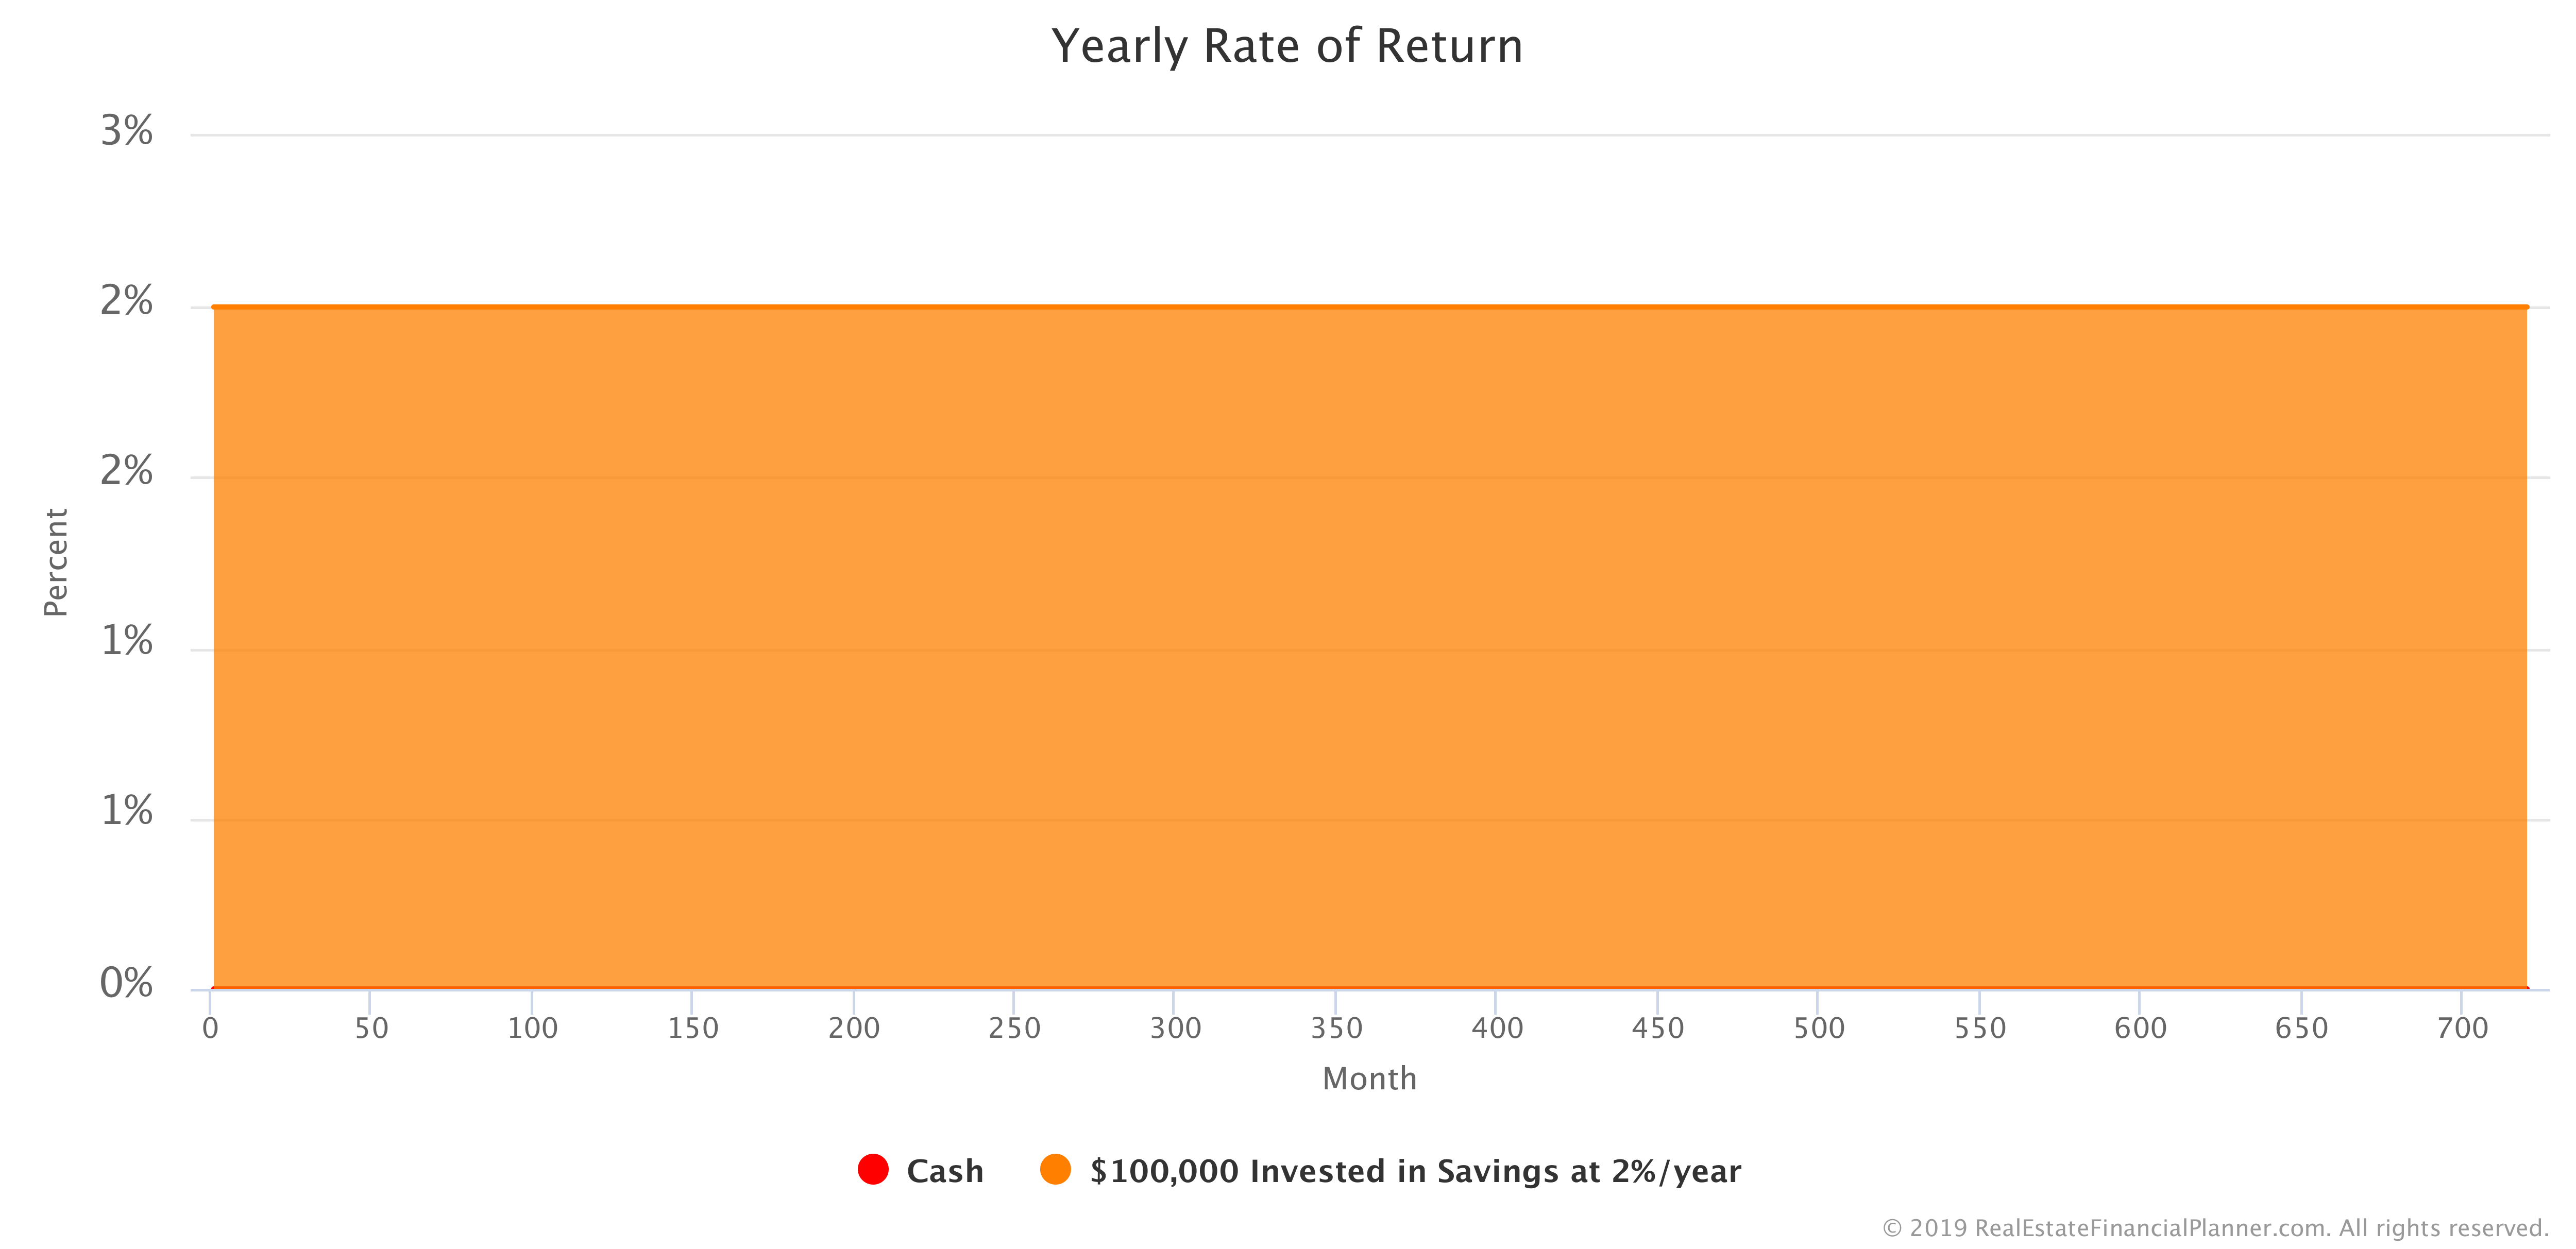
The following is a Chart showing just one example of what the rate of return in the savings account might have been.
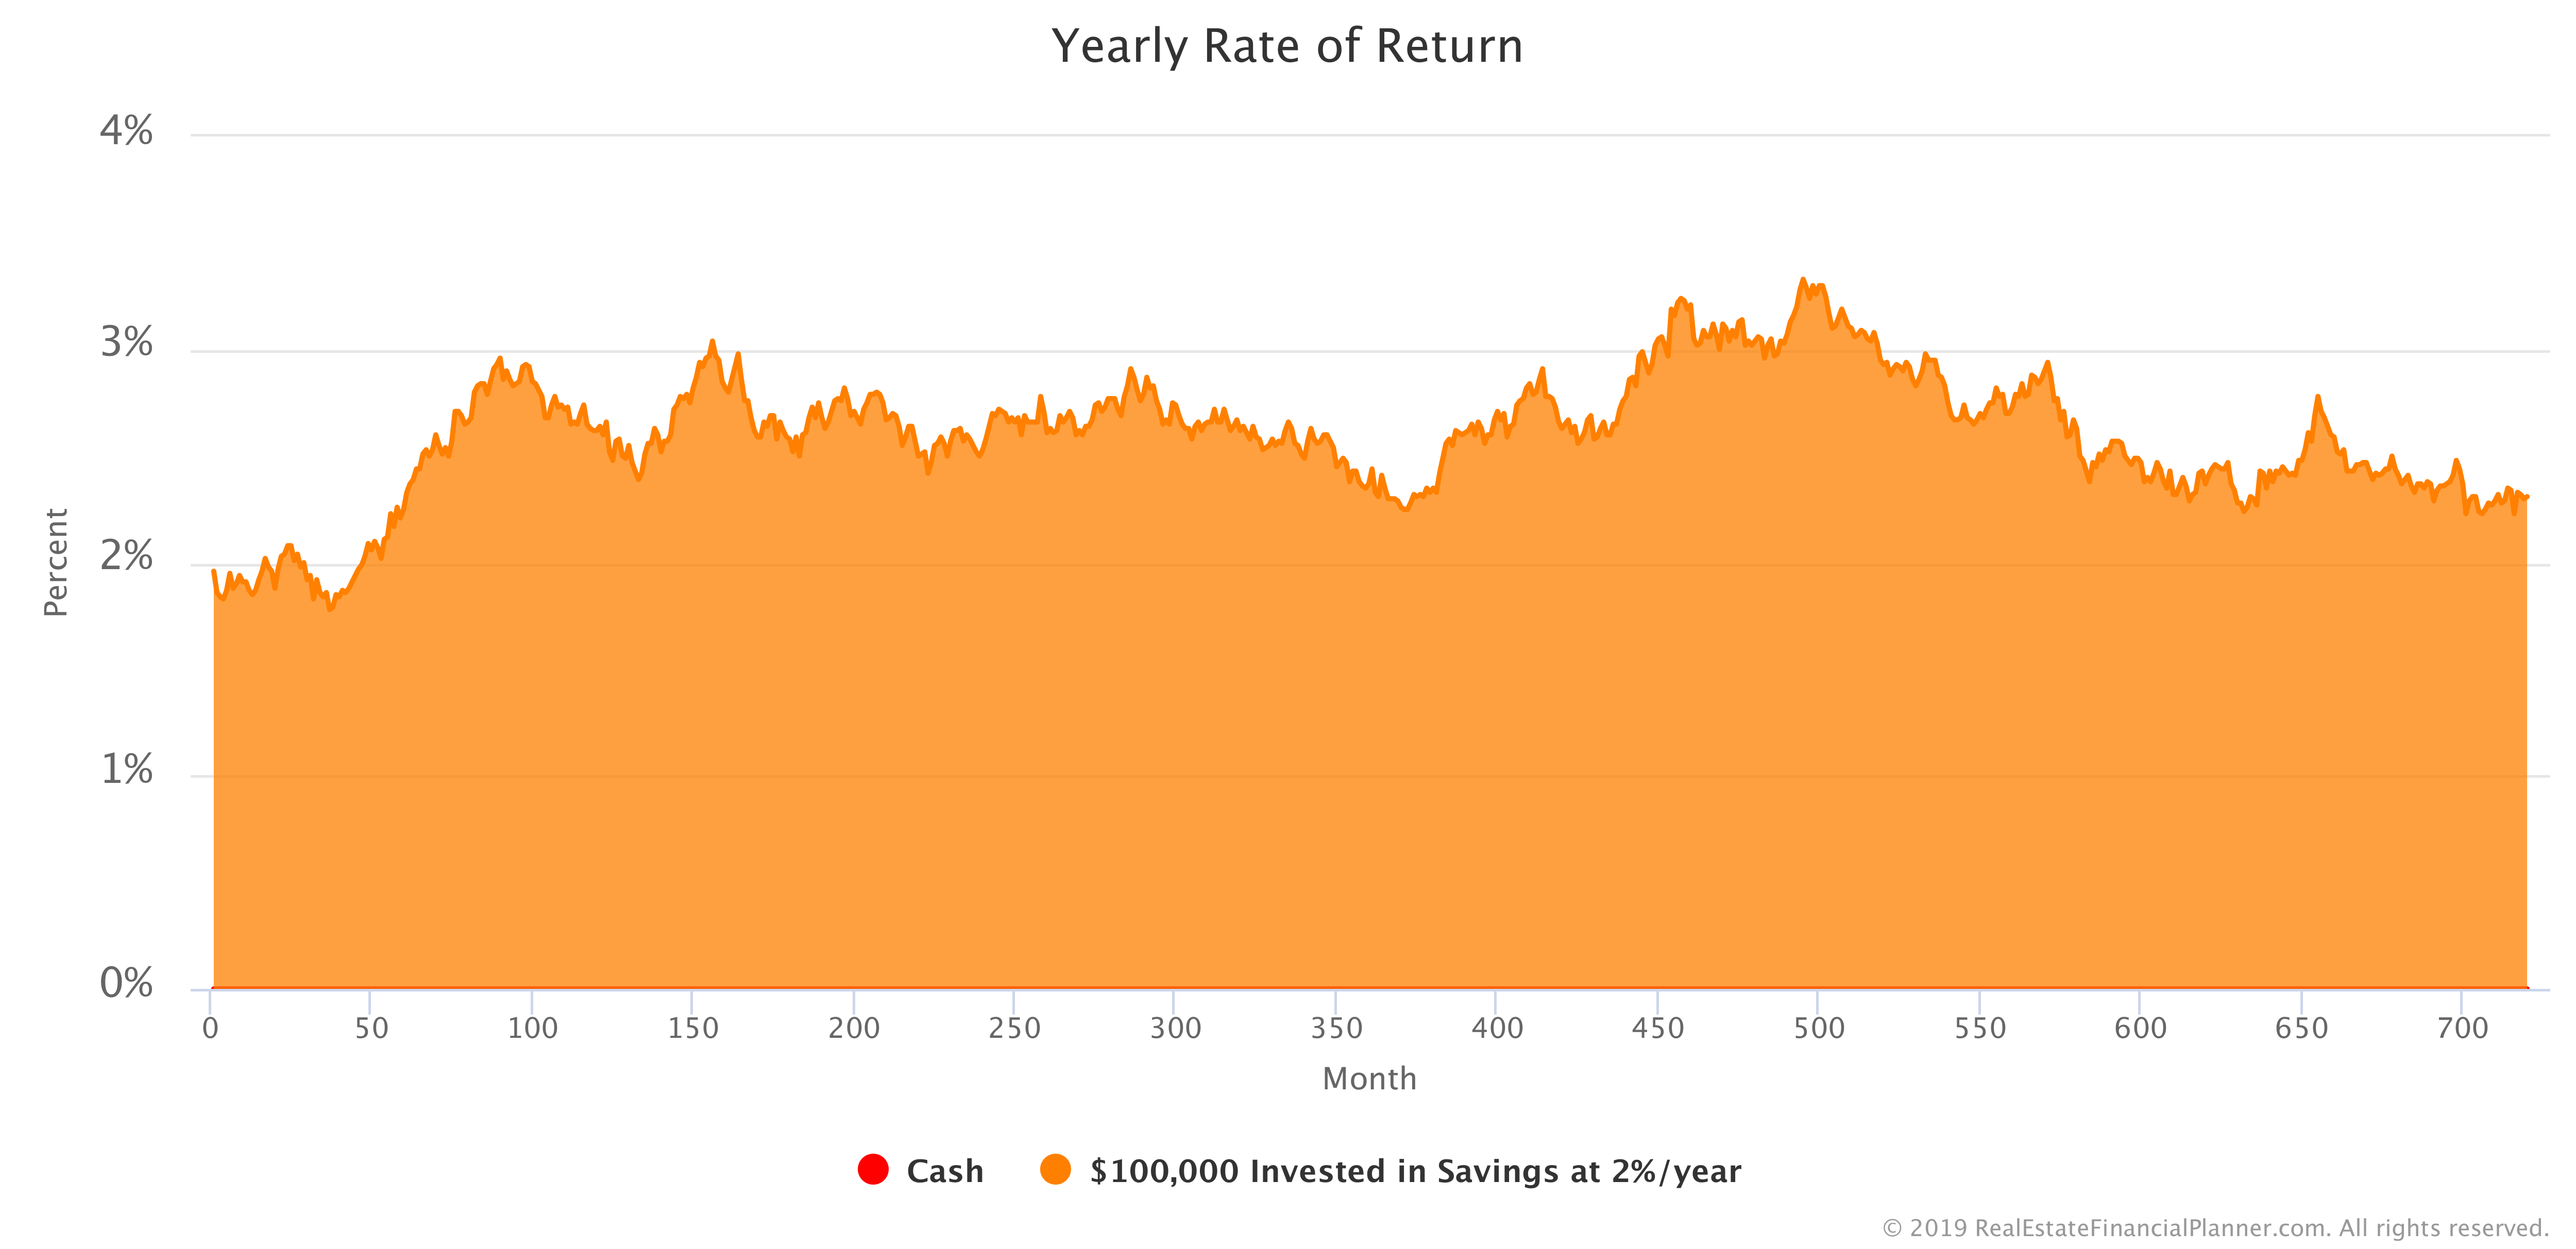
As you can see, while we started at 2%, over time the interest rate in this example largely crept up. If we ran it again, it would undoubtedly look different. If you want to copy the Scenario to your own Real Estate Financial Planner™ account and run it a few times to see the range of values, you can do that using the button below.
Login to copy this Scenario. New? Register For Free
Scenario into my Real Estate Financial Planner™ Software
SS 010 Investing $100,000 in Savings at Approx 2%/yr with 2 Accounts, 0 Properties, and 1 Rule.
Or, read the detailed, computer-generated, narrated Blueprint™
The interest rate you’re getting on your savings account will impact how much you actually have in your account as you let the balance grow. With the new variable rate of return, here’s what the savings account balance would look like if you got the variable rates of return above.
I think what I am about to say is obvious, but I’ll say it out of an abundance of clarity: if you ran this Scenario again with the variable, somewhat random rate of return, the savings account balance would also be different.
Comparing Fixed 2% Return vs Variable Return
I’ve gone ahead and created a Chart comparing your Net Worth (which is really just your savings account balance in these two Scenarios) for the initial $100K invested in a 2% fixed rate of return savings account and the same $100K invested in a savings account that better reflects the reality that your interest rate on a savings account is likely to change each month.
The Chart comparing your Net Worth in both Scenarios is shown below.
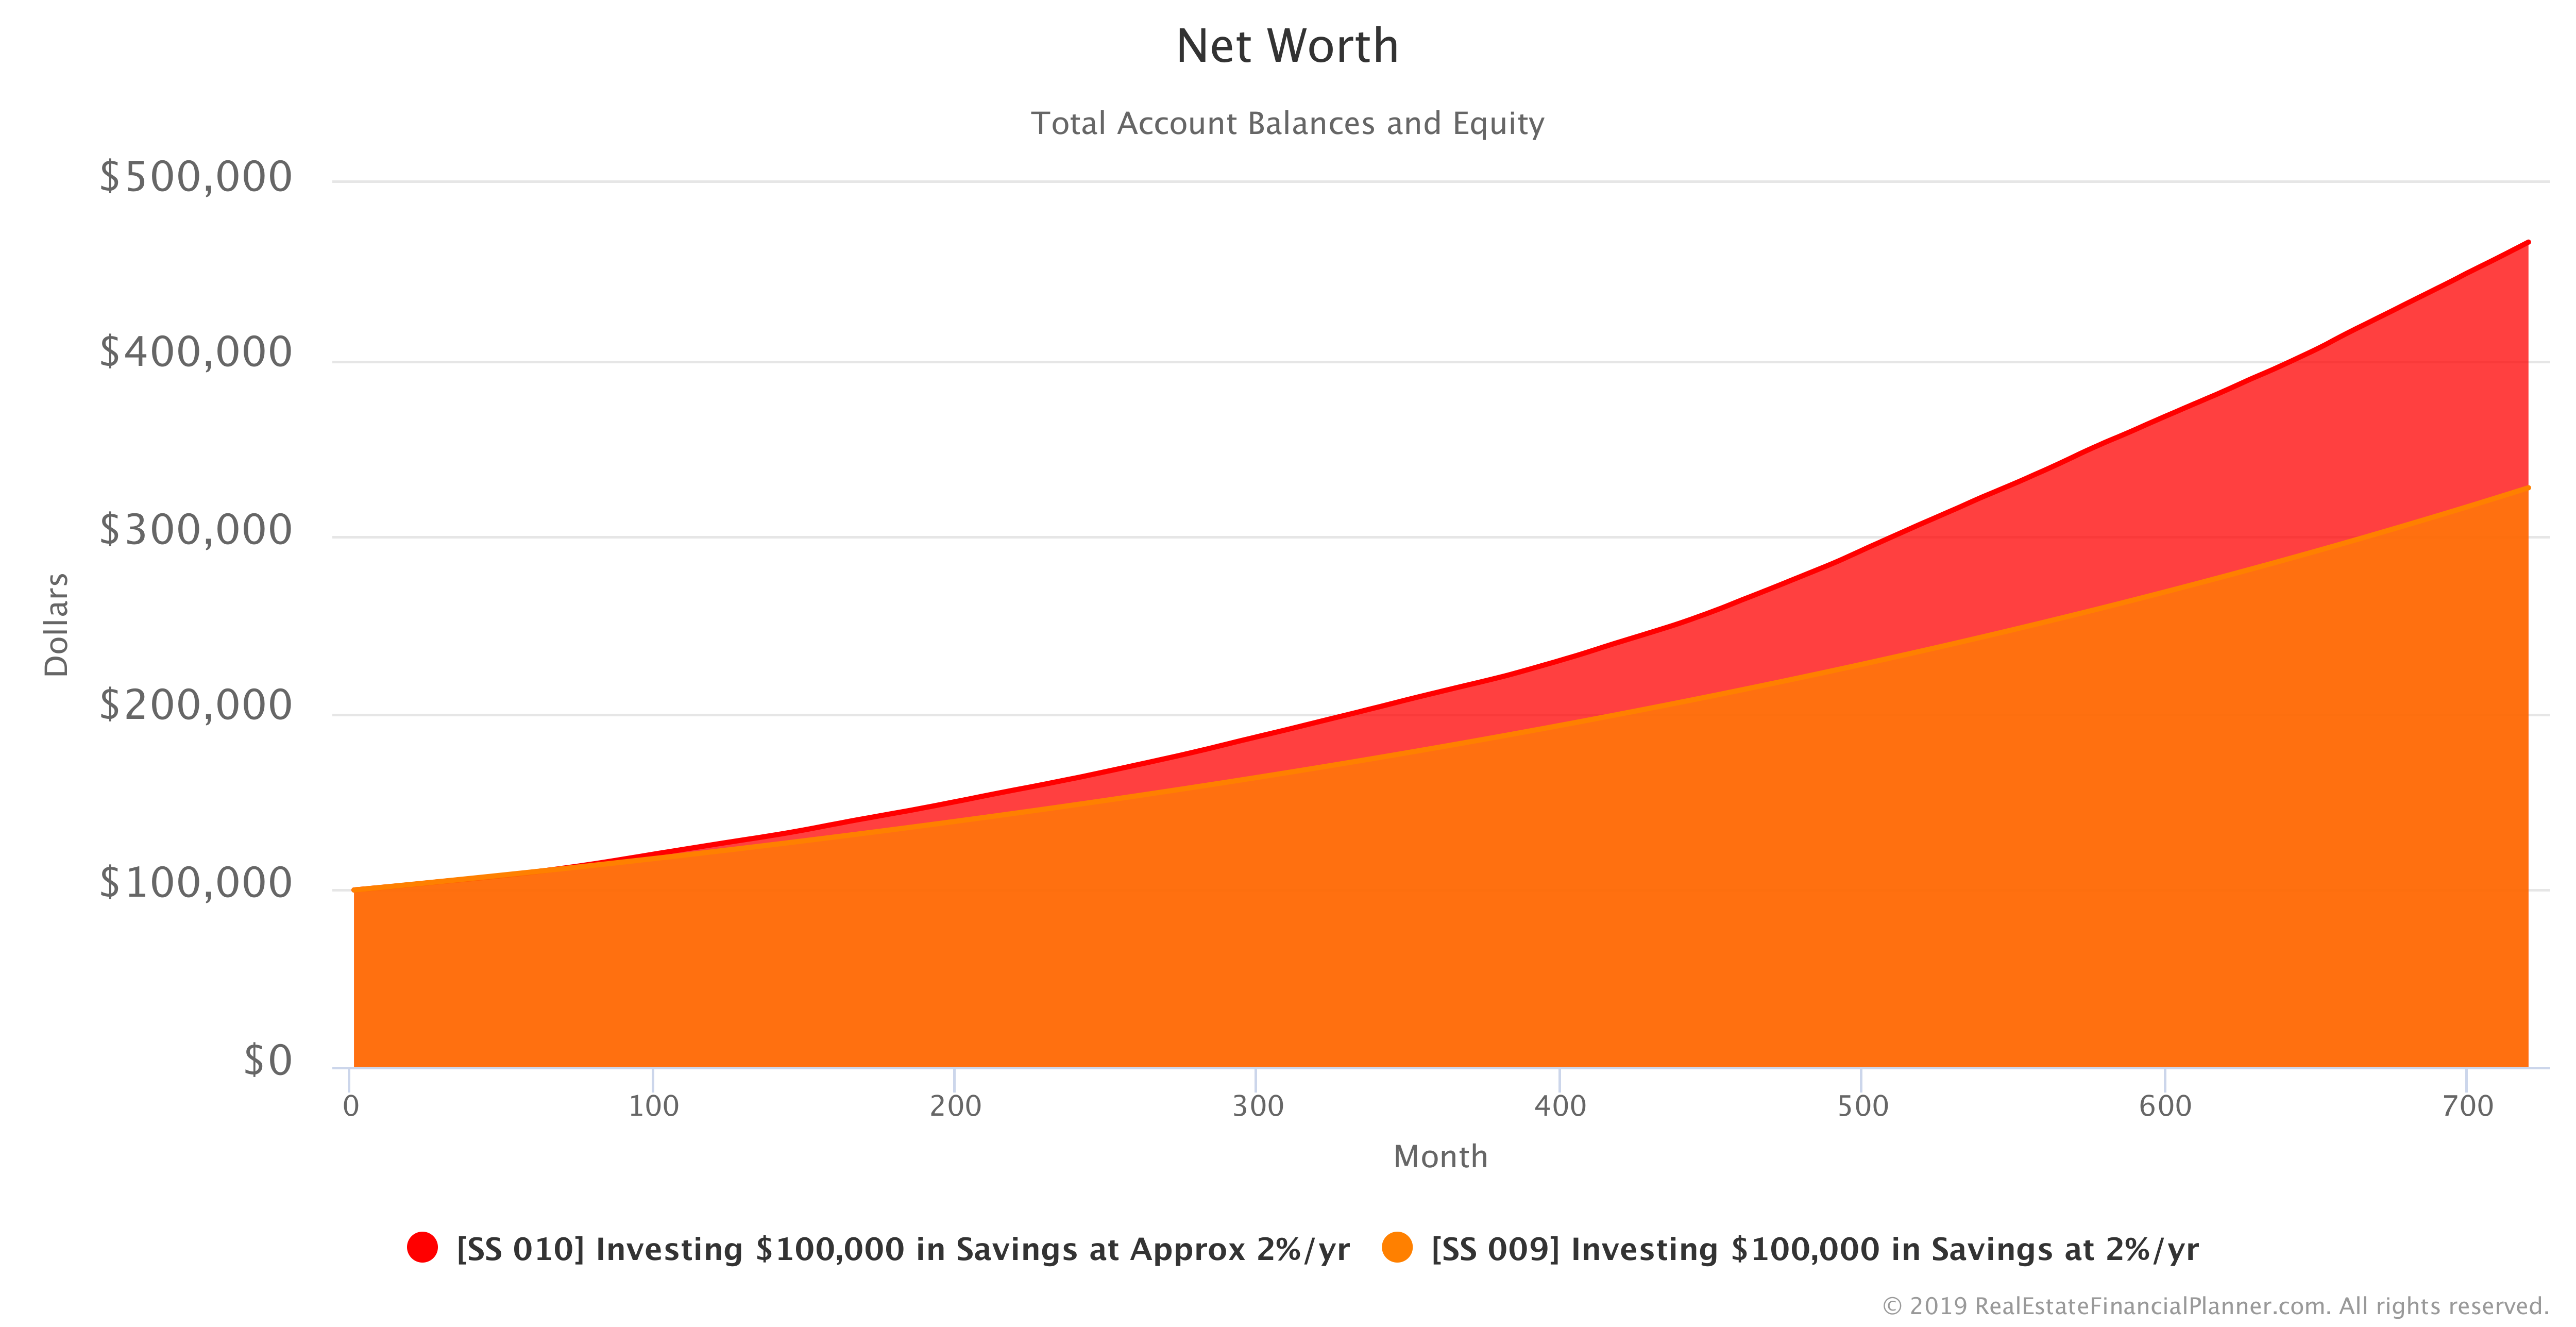
I wish it could go without saying, but I’ll say it again… if you run the variable interest rate Scenario again, the Net Worth will be different… it could be better or worse than the fixed 2% per year Scenario.
Let’s move on so we can… eventually… get to much more complex examples of investing $100K that involve stocks, bonds and… ultimately… my favorite: real estate.
Investing $100K in CDs
Often if you commit to investing your money with a bank for a longer period of time and purchase a certificate of deposit (CD), the bank will pay you a slightly higher interest rate. Another search of the web shows me that interest rates on CDs are just a tiny bit higher than the interest rates in savings accounts right now. This rate, just like savings rates, can vary over time. Let’s use 2.25% per year as the interest rate you might be able to get on a CD and—foolishly—assume that you will lock in a 2.25% per year rate of return for the entire 60 year duration of the Scenario.
I won’t go into the variable rate stuff like I did with the savings account for CDs to keep the story flowing, but here’s the Scenario with a fixed 2.25% return on your $100K invested in CDs for 60 years.
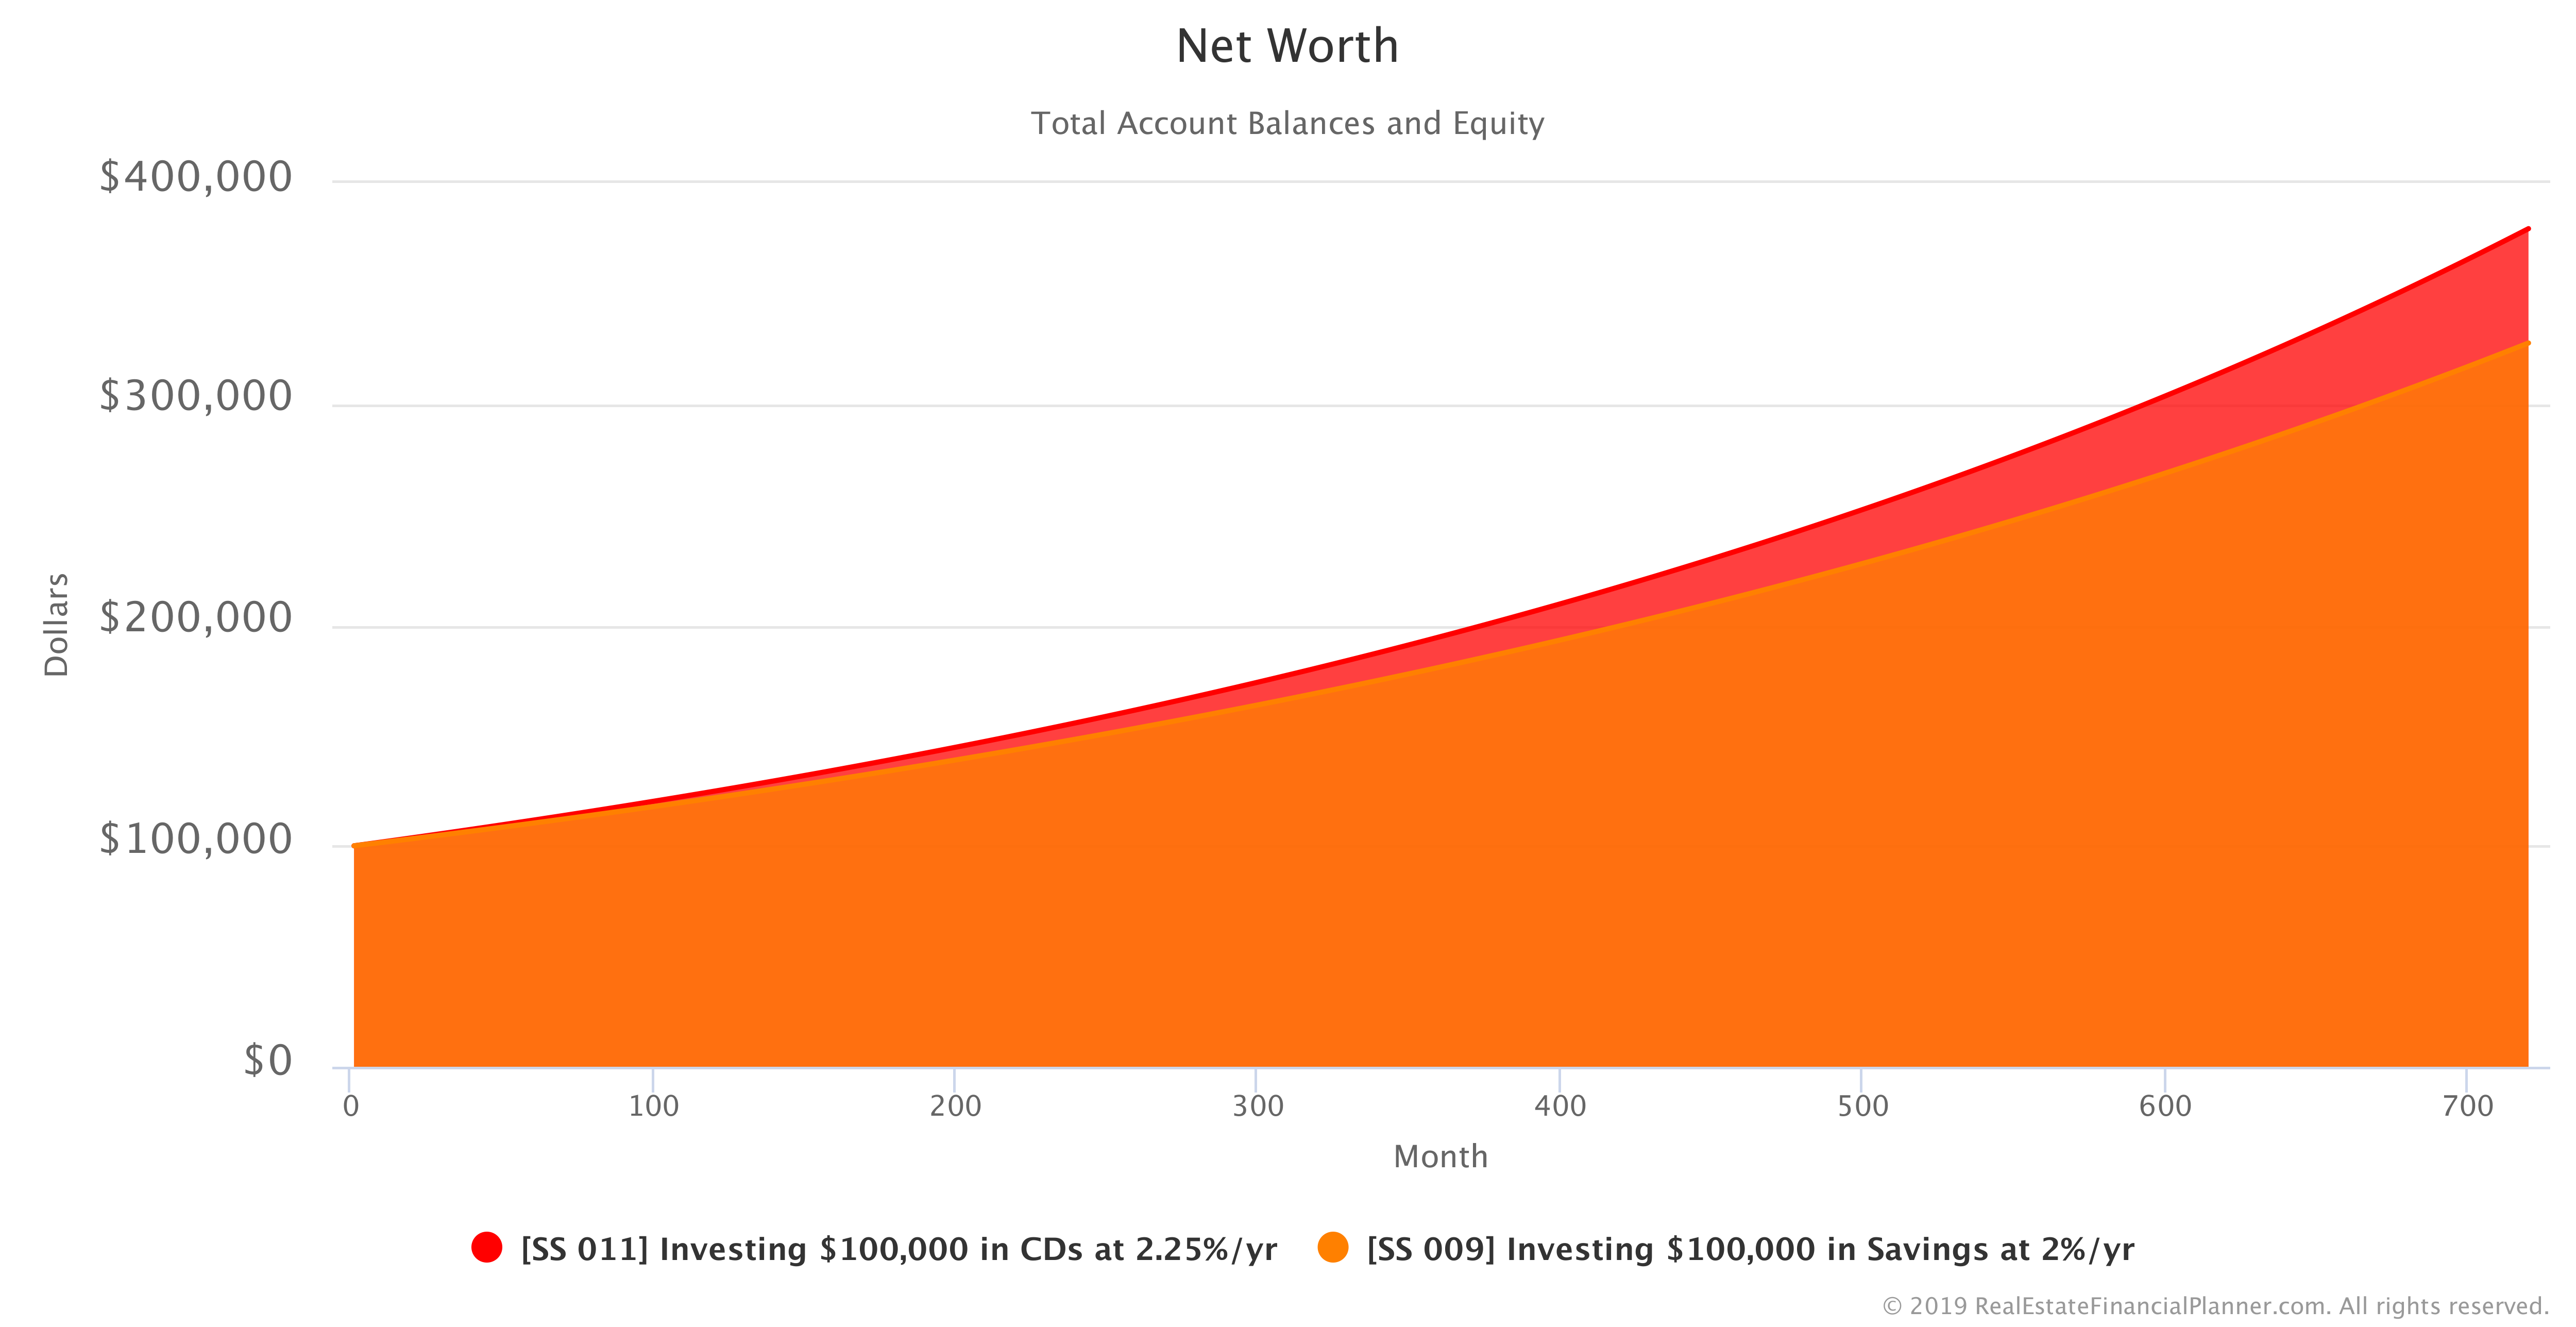
This is what your CD Account Balance looks like investing $100K in CDs.

If we compare investing $100K in savings at 2% per year and investing in CDs at 2.25% per year, this is how your Net Worth differs.
If you’d like, copy this Scenario of investing in CDs to your own Planner™ and change any of the assumptions or add complexity to it.
Login to copy this Scenario. New? Register For Free
Scenario into my Real Estate Financial Planner™ Software
SS 011 Investing $100,000 in CDs at 2.25%/yr with 2 Accounts, 0 Properties, and 0 Rules.
Or, read the detailed, computer-generated, narrated Blueprint™
Inflation
Now that you’ve seen investing $100K in a saving account and in CDs, I am going to introduce the idea of inflation.
Inflation erodes away at your buying power. $100,000 today is not the same as having $100,000 50 years from now. In most cases, when we see positive inflation, $100K 50 years in the future is worth less. In other words, we can buy less. Or, we have less buying power.
If we assume that inflation is 3% per year—unless we are earning more than 3% per year on our investments—we are losing purchasing power to inflation.
Good news: the Real Estate Financial Planner™ software allows us to model inflation as well.
We’ve assumed that inflation is a fixed 3% per year, but if you don’t like my assumption, just copy the Scenario to your Planner™ and change the Inflation Rate for the Scenario.
Because the return we were getting on savings (2% per year) and the return we were getting investing in CDs (2.25% per year) are both less than the Inflation Rate, each year our money is worth less in today’s dollars.
Here’s a Chart showing our Net Worth adjusted for inflation.
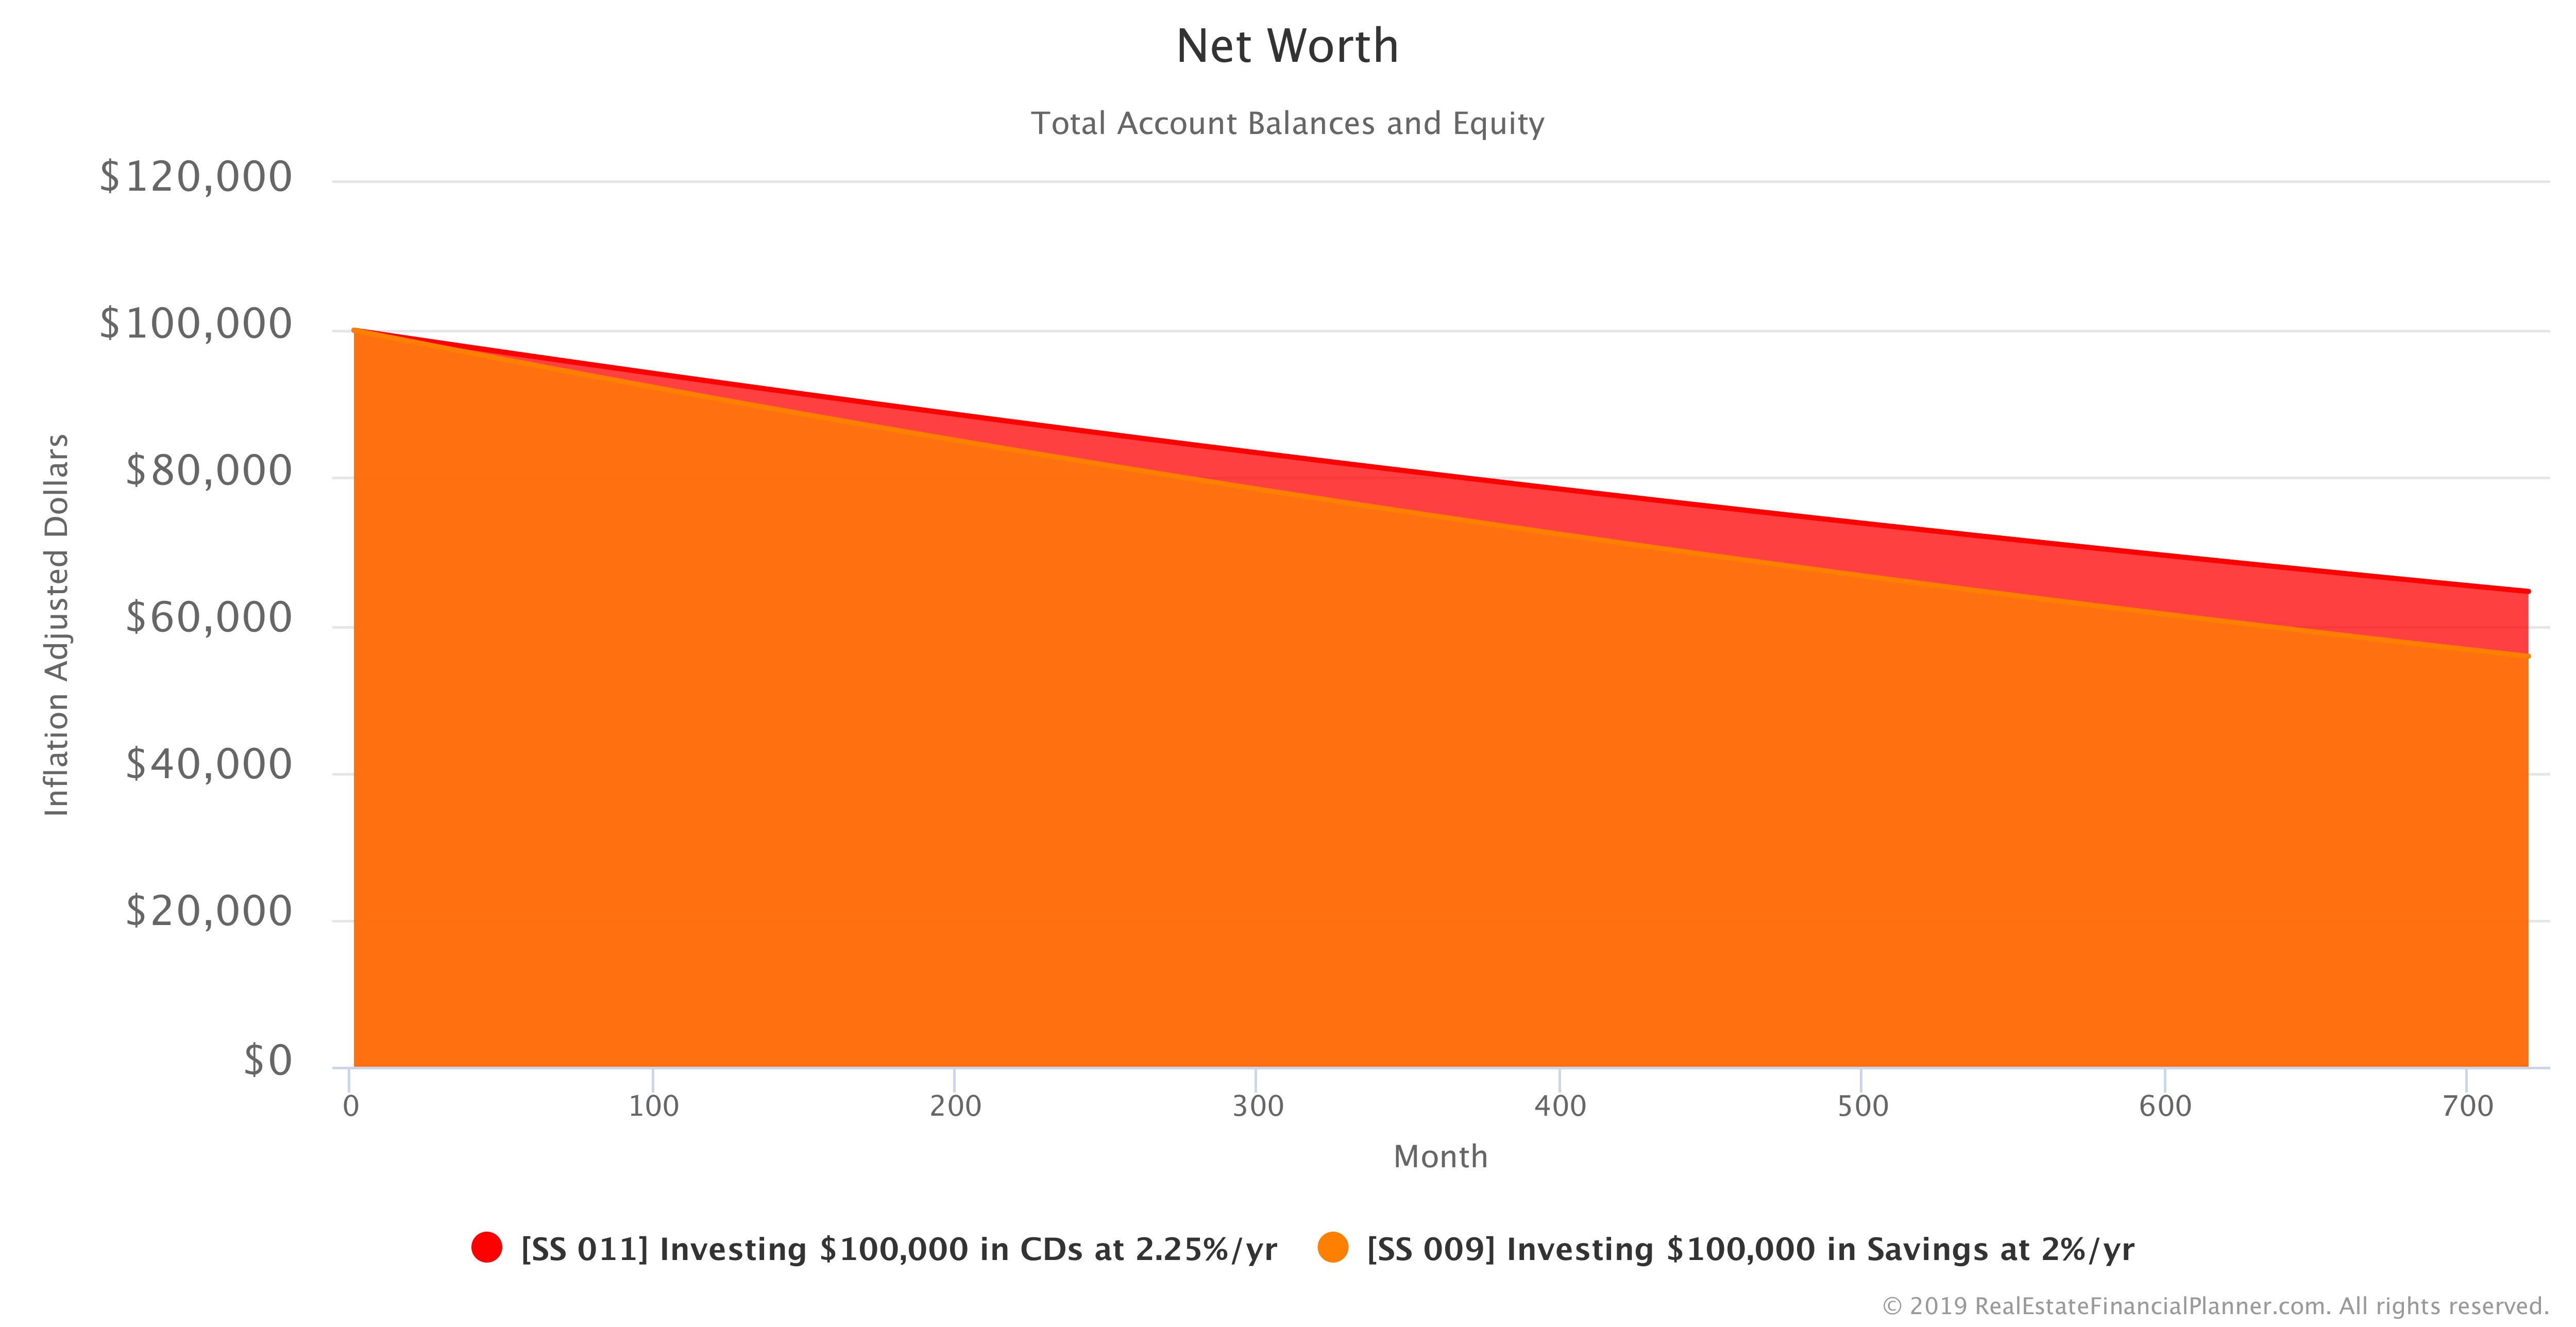
60 years in the future, our initial $100K investment is really worth approximately $55K to $65K in today’s dollars even though we were earning 2% or 2.25% (savings and CDs respectively).
That’s the impact of inflation over time.
Ideally, we’d like to find an investment that exceeds the Inflation Rate so that our money grows—net of inflation—over time.
Investing $100K in Bonds
We’ve discussed savings and CDs with their lower rates of return. Let’s see if we can overcome inflation by investing in bonds.
Bonds, with my vast over-simplified definition, are you lending money to companies or government entities. The company or government agency pays you interest on the bond and that’s your rate of return.
While the details of how I did it are likely beyond the scope of this article, I pulled up Simba’s backtesting spreadsheet to compile the returns for bonds (Vanguard Total Bond Market Index Fund, VBMFX) and, later in this article, stocks (Vanguard’s Total Stock Market Index Fund, VTSMX).
Based on my research, we will use 4.59% per year return for bonds. We will assume you’re buying a group of bonds that represents the total bond market.
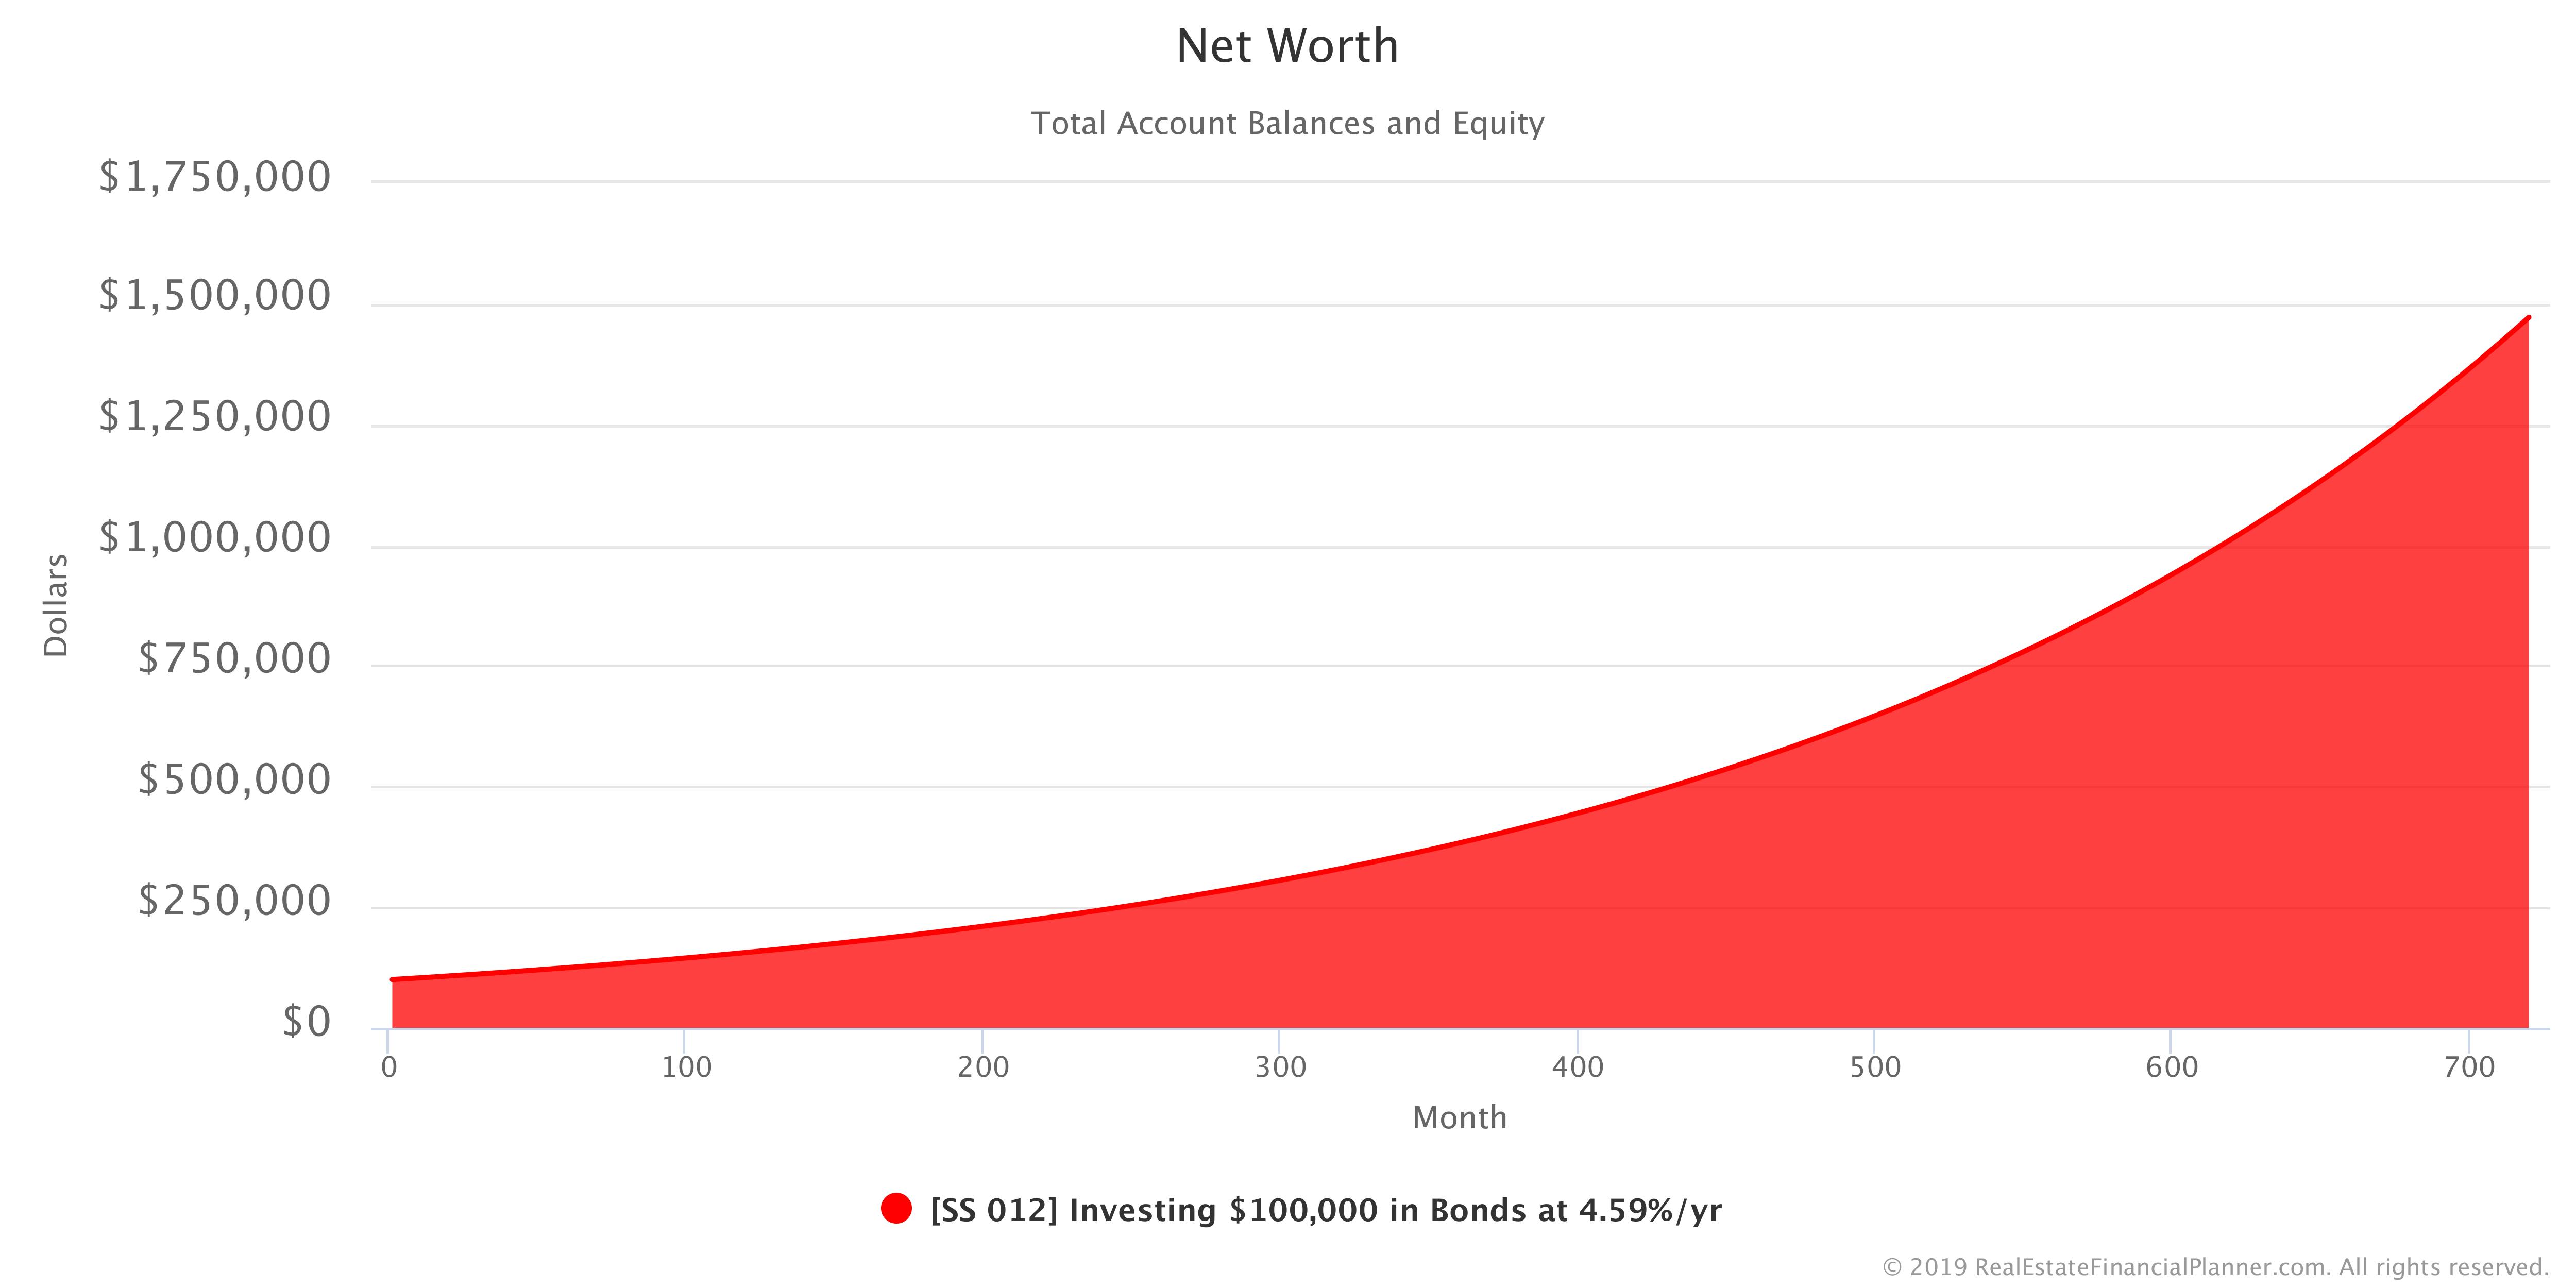
If you were to invest $100,000 by purchasing a large, diverse assortment of bonds your Net Worth might look like the following Chart.
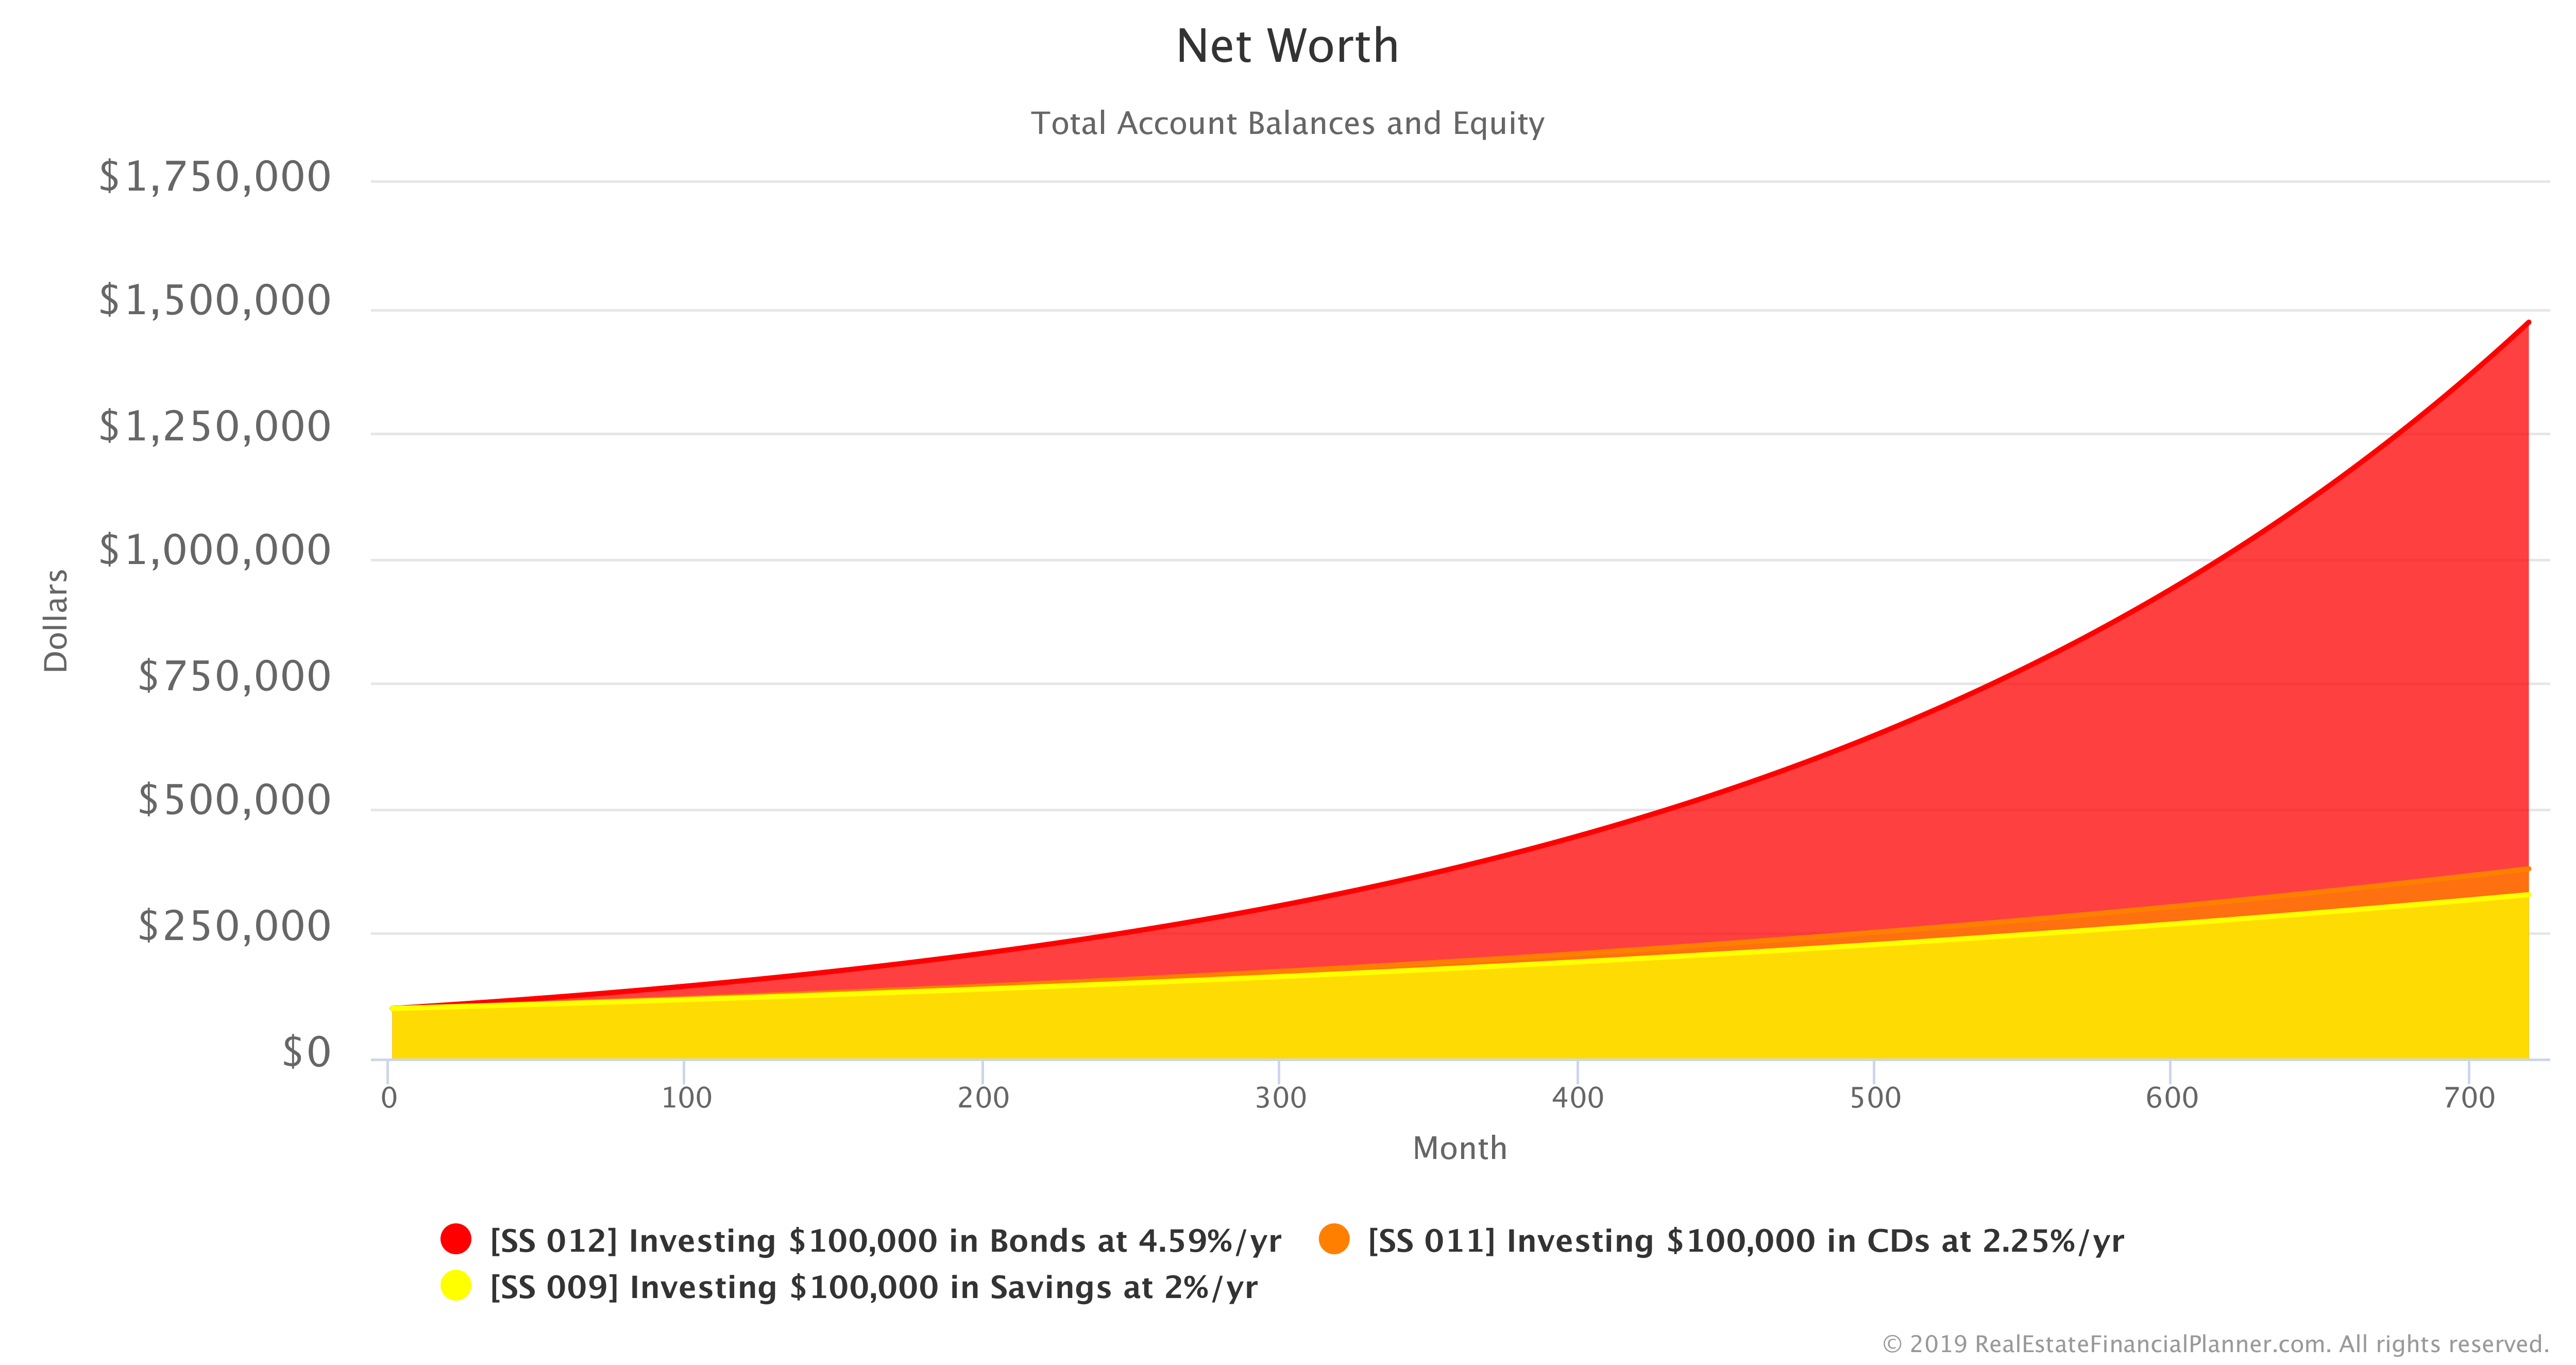
How does that compare to investing the same $100K in a savings account or in CDs? Let’s look at a Chart that compares our Net Worth from each of the three.
Do you recall our discussion about inflation? What happens if we take this same Chart from above, but we adjust for inflation?
The Chart below shows the value—in today’s inflation-adjusted dollars—for the Scenarios.
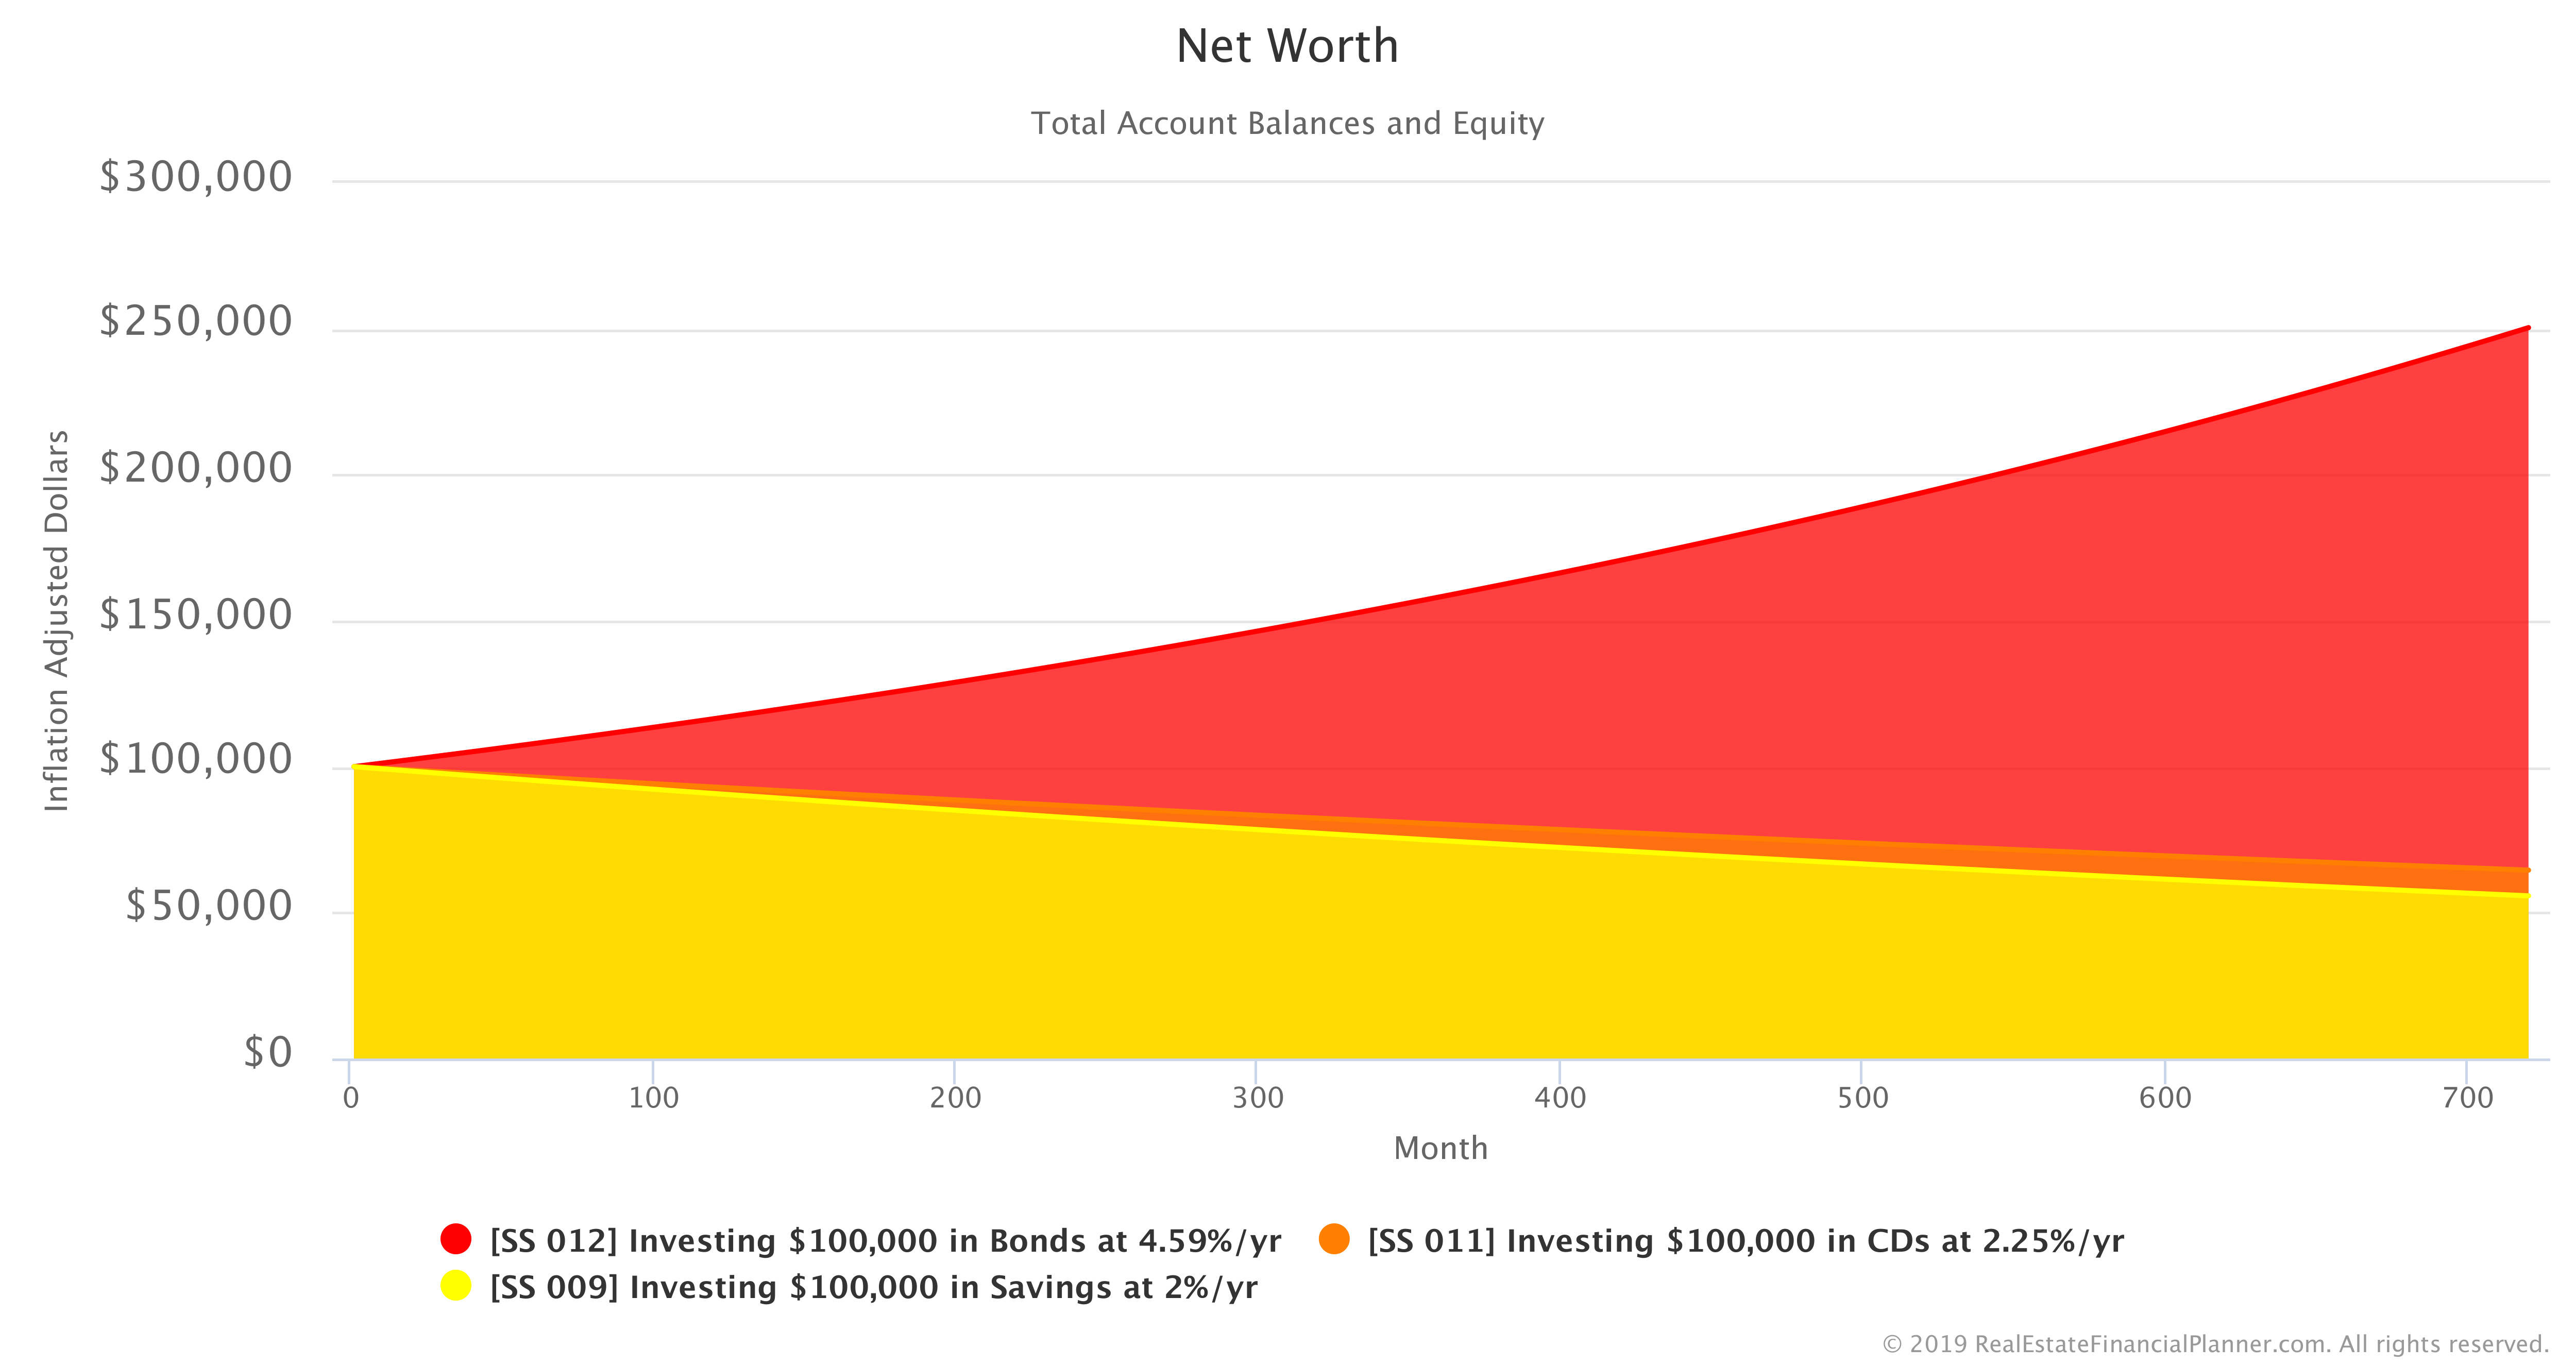
As you can see in the Chart above, the investments in savings and CDs did not keep up with inflation and so they are worth less than the $100K you had at the start. Since your $100K investment in bonds was invested at a rate higher than the 3% Inflation Rate, it is worth more than the $100K we started with… even when we adjust for inflation.
In other words, when we invested in bonds, we have more buying power in the future than we did at the start. That was not the case when we invested $100K in a savings account or in CDs using the 2% and 2.25% rates of return discussed earlier.
Monte Carlo Simulation with Bonds
Is it reasonable to think that we’re going to get a guaranteed 4.59% fixed rate of return investing in bonds for the next 60 years? Emphatically, no.
It is much more reasonable to think that we will have some good months and some bad months. There will be years when the value of our investment is up for the year and years when it is down.
The following Chart shows a single example with us setting the Yearly Rate of Return for our $100K investment in bonds to have similar characteristics to the backtesting data I referenced above. It is random, but it is based on modeling the characteristics of the actual bond markets performance over decades of actual historical data.
Here’s the Net Worth Chart.

If you want to copy this Scenario to your own Real Estate Financial Planner™ account to change the assumptions or dig into what it looks like running it repeatedly (remember… each run will be different with the random Yearly Rates of Return), then use the button below to copy it to your Planner™.
Login to copy this Scenario. New? Register For Free
Scenario into my Real Estate Financial Planner™ Software
SS 015 Investing $100,000 in Bonds at Approx 4.59%/yr
To create the Net Worth Chart shown above, the following shows what the random Yearly Rate of Return was for your bond investment.
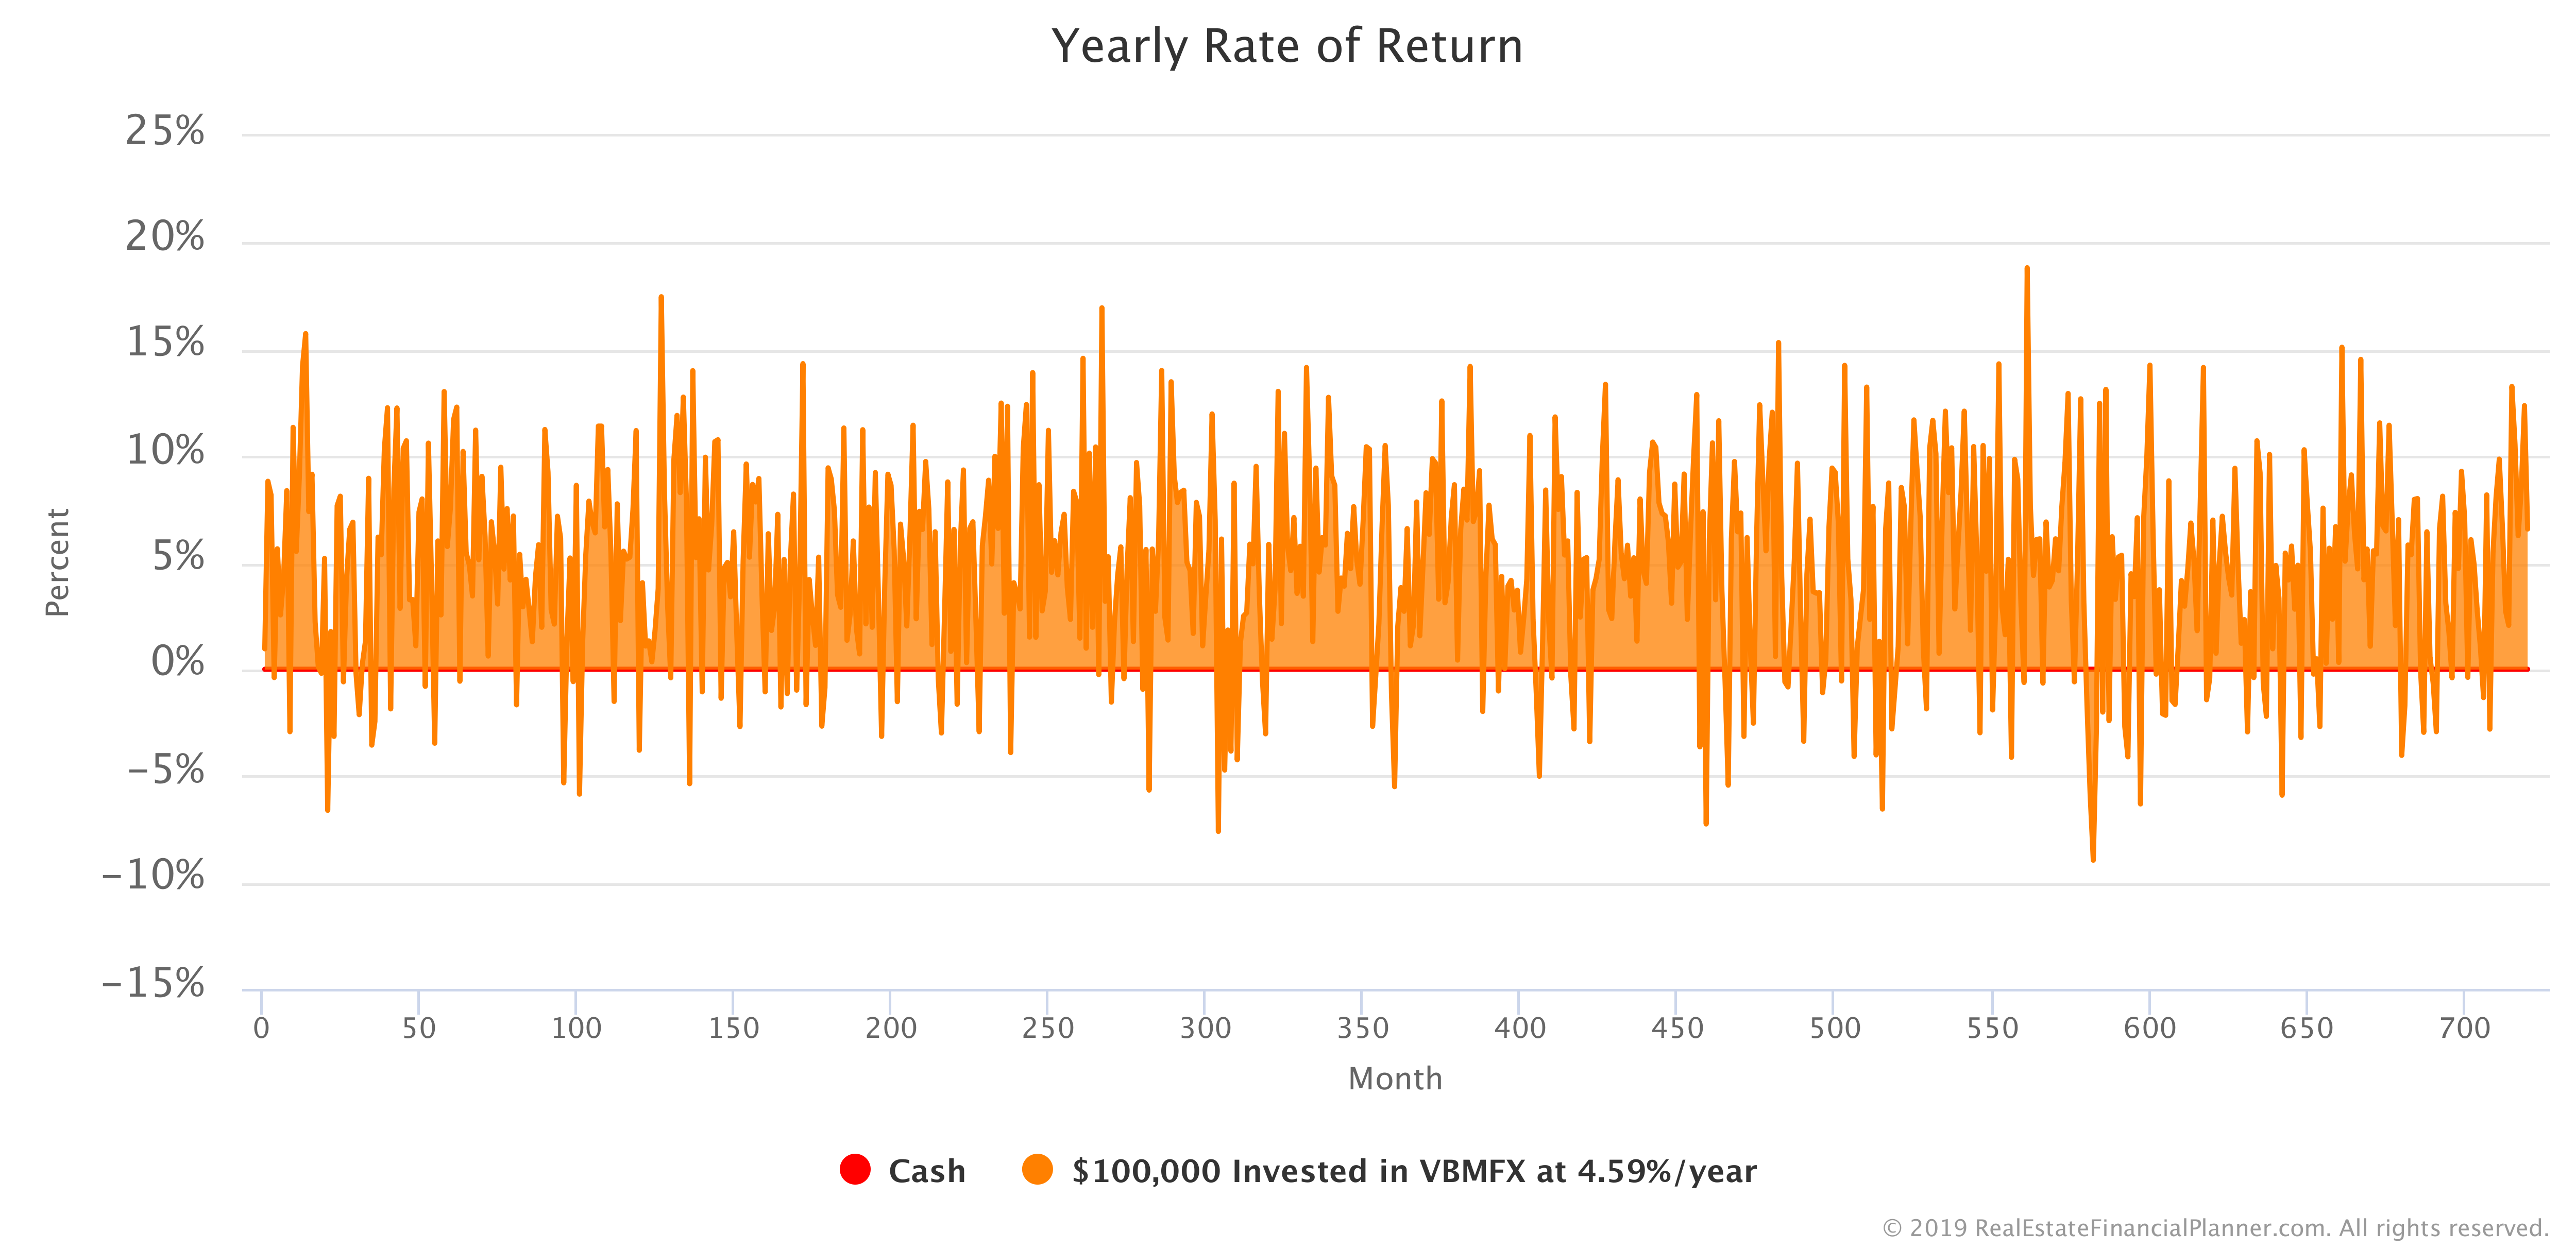
I could write entire books about modeling a variety of investment Scenarios using variables like this. In fact, I probably will in the future since I find it fascinating… especially when talking about using this idea when modeling real estate investments.
Back to investing $100K… for now.
Investing $100K in Stocks
Next, let’s look at investing the same $100K but this time you decide to invest it in stocks.
Similarly to how we invested in bonds, I will model you investing in a stock market index fund and use historical return data to estimate what returns you might see. Of course, no one can predict the future and returns might be much better or much, much worse than the 8.97% per year that I am assuming based on historical data for VTSMX (an index of the entire stock market).
If you invested $100K in stocks and were able to earn a fixed return of 8.97% per year, every year for the next 60 years, your Net Worth would look like the Chart below.
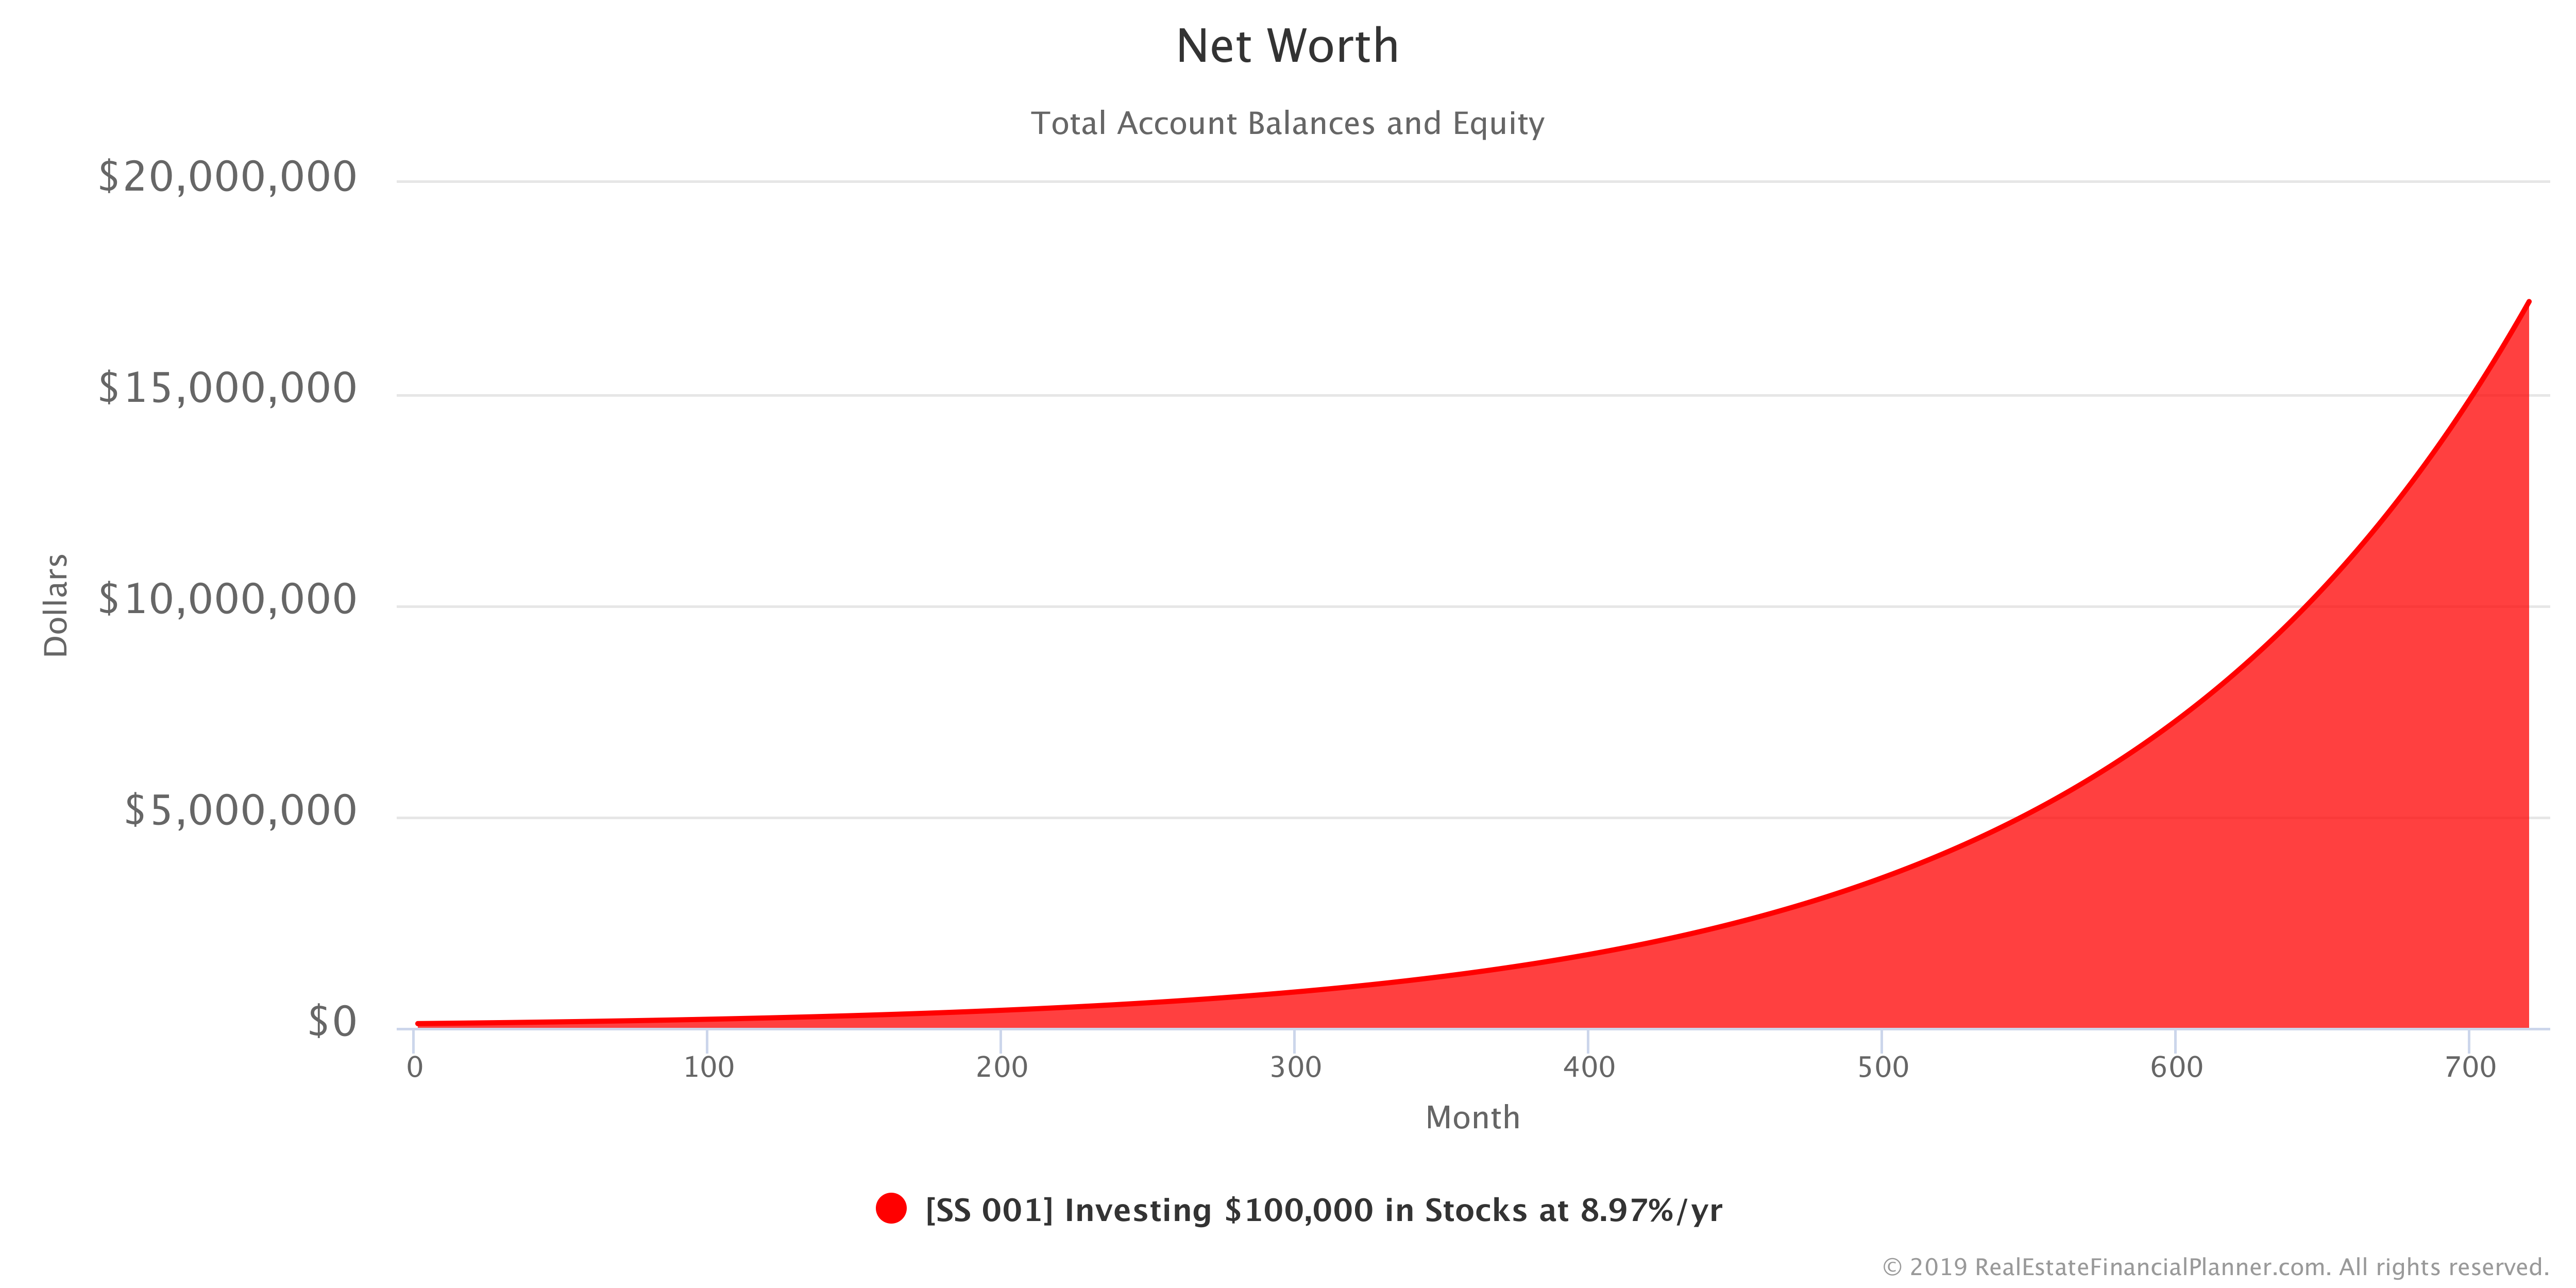
Not too shabby… if you can get that fixed rate of return for 60 years… but how does it compare to investing our $100K in our other investments that we were considering?
The Chart below compares investing the $100K in stocks to investing the same amount in a savings account at 2% per year, CDs at 2.25% per year and bonds at 4.59% per year.

If we were able to get these fixed rates of return, stocks looks like the clear winner.
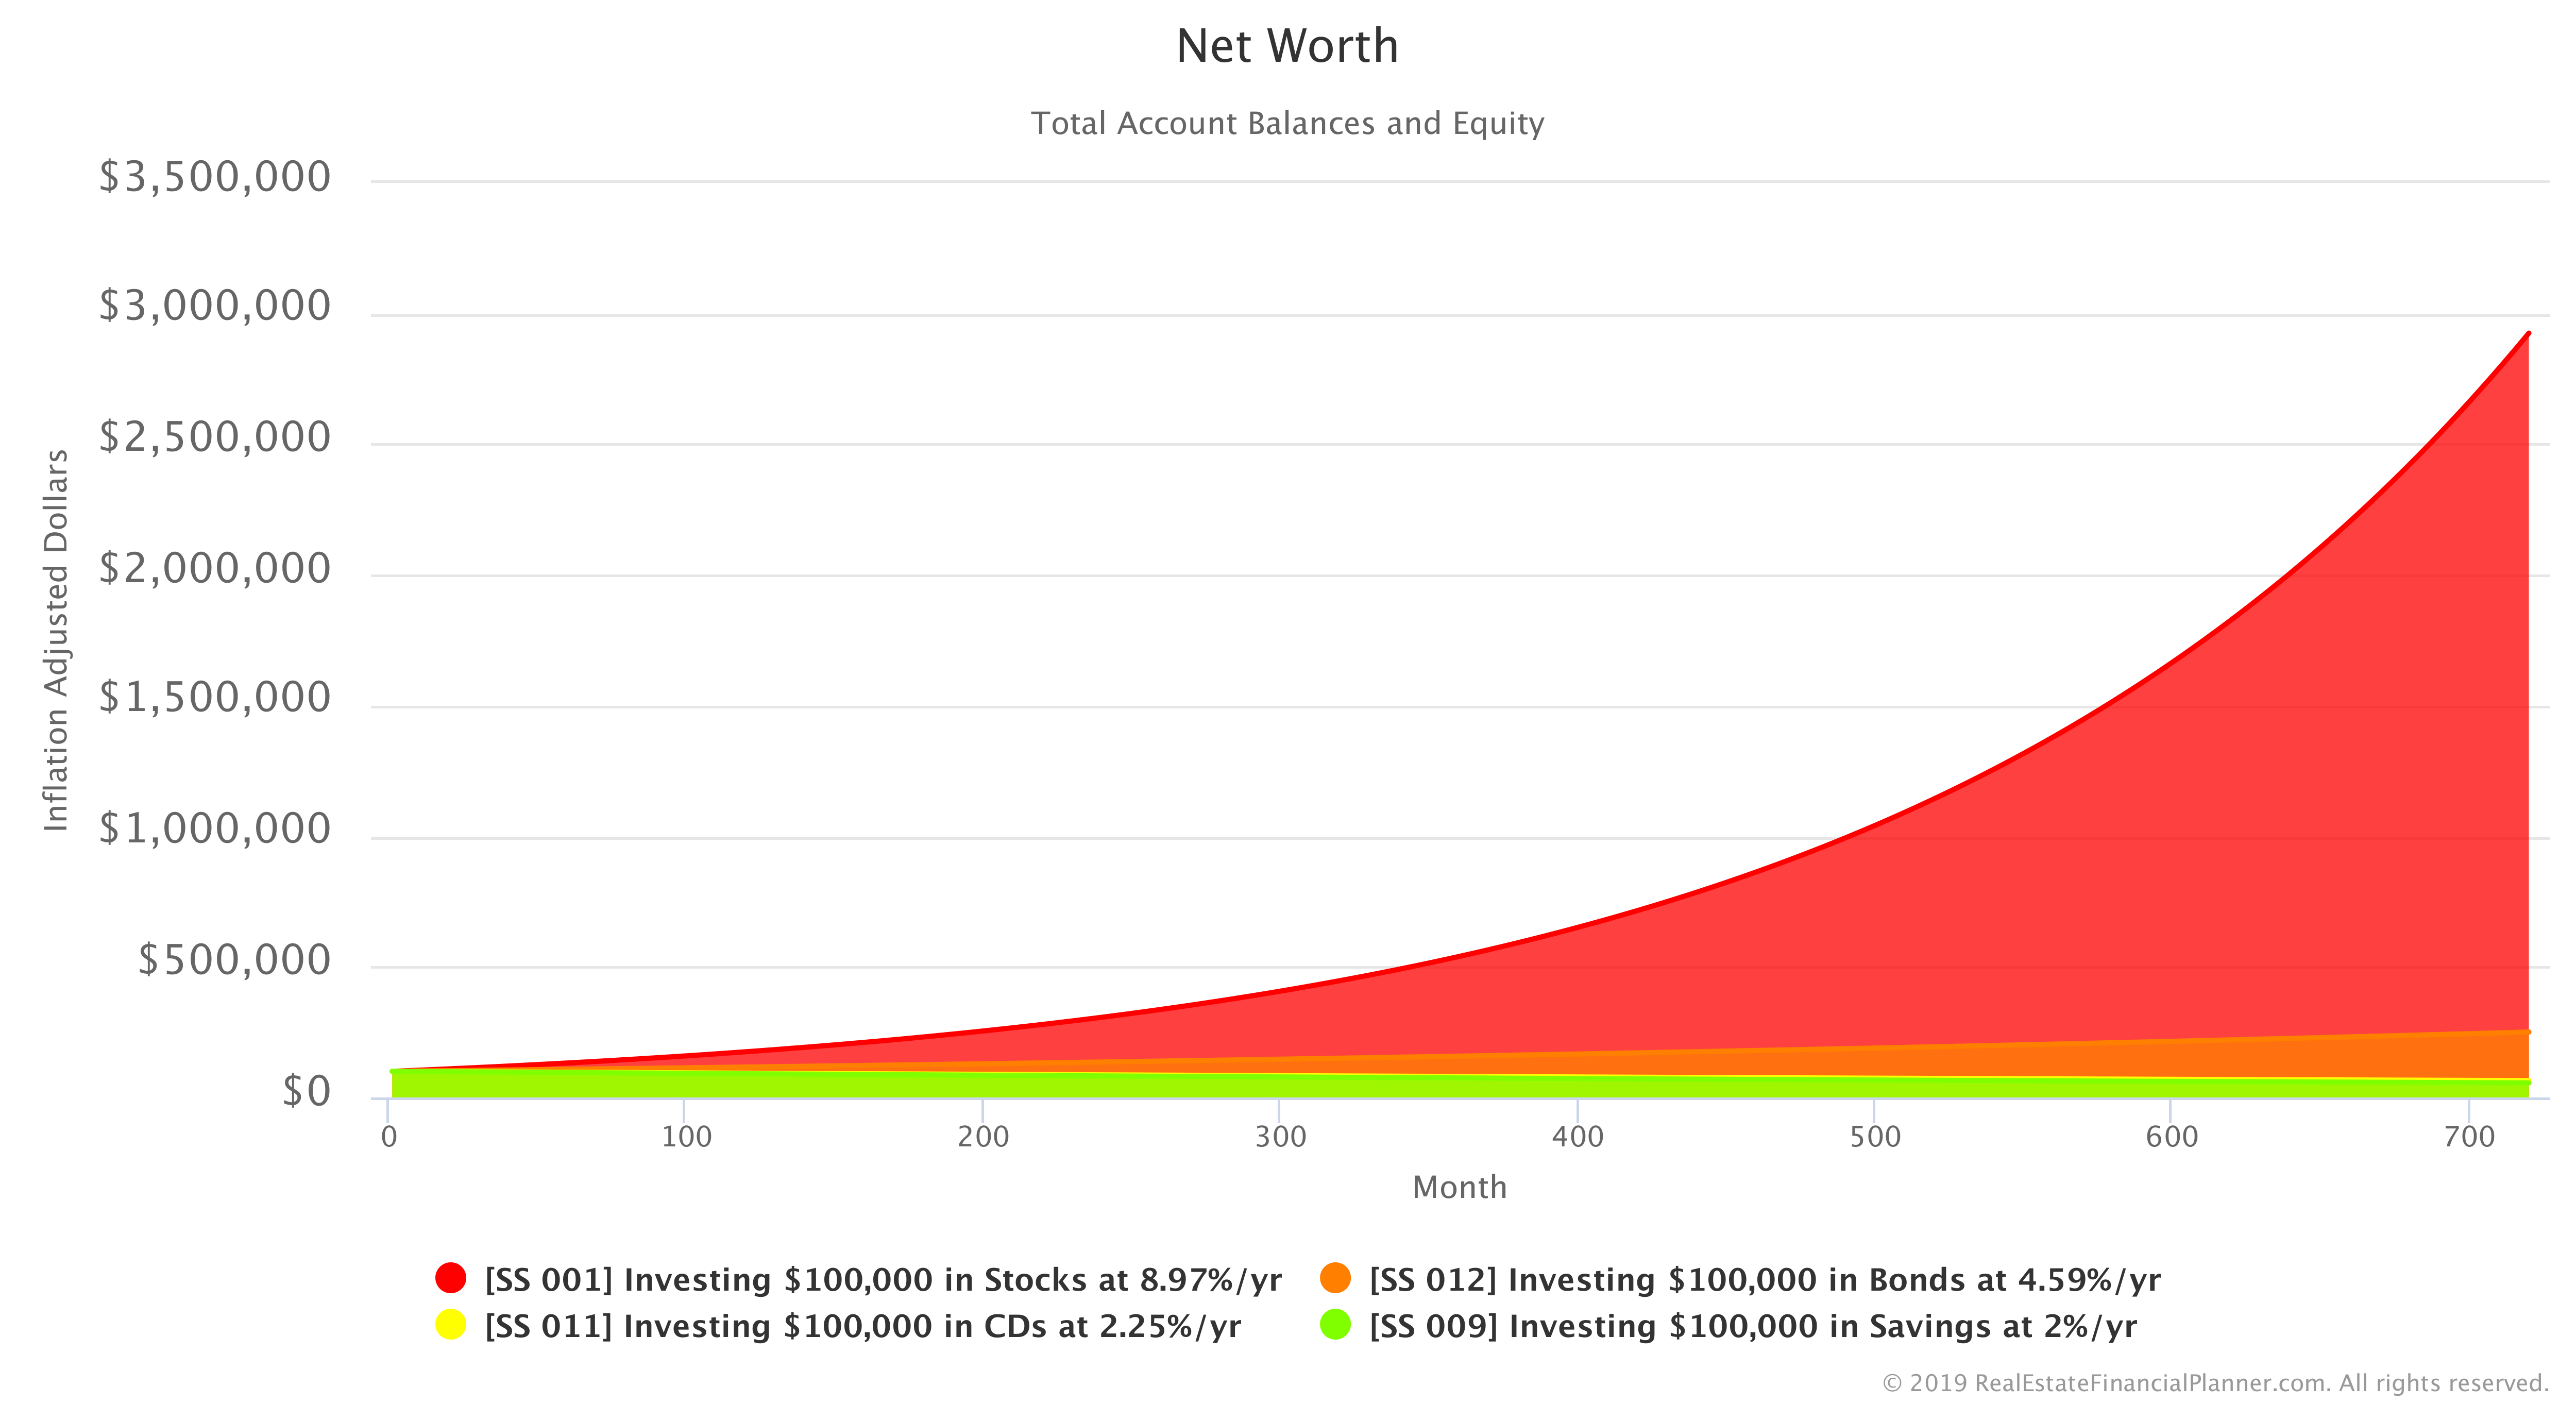
What if we adjust all of them for inflation? The Chart below allows us to see how each of them performs in inflation-adjusted dollars.
If you want to do some of your own modeling, you can copy the Scenario to your own Real Estate Financial Planner™ account and use it as a starting point for editing or adding additional complexity by using the button below.
Login to copy this Scenario. New? Register For Free
Scenario into my Real Estate Financial Planner™ Software
SS 001 Investing $100,000 in Stocks at 8.97%/yr with 2 Accounts, 0 Properties, and 0 Rules.
Or, read the detailed, computer-generated, narrated Blueprint™
Monte Carlo Simulation with Stocks
I hinted that stocks looked great if we could get a consistent 8.97% per year.
But, what happens if it is random like what we did with the savings account Yearly Rate of Return and the bonds Yearly Rate of Return?
When we modeled a random Yearly Rate of Return for savings account, we did a rather conservative model where we changed the return based on what it was the previous month. Sometimes it went up a little and sometimes it went down a little.
When we modeled the Yearly Rate of Return for bonds, we did a more aggressive model where we set the rate of return for the month to be a random value based on the actual historical returns of bonds.
For stocks, we will use a similar model to what we used for bonds.
However, the returns for stocks are more varied… more volatile… than the Yearly Rates of Return we’ve seen with bonds. There were some years were the stock market was down 42% and other years where the market was up 53%. Bonds did not have that large of a range of ups and downs. So, we’d expect to see a wider range of values for the Yearly Rate of Return when making those random.
And, we do. Here’s a Chart showing the annualized monthly return of the stock market.
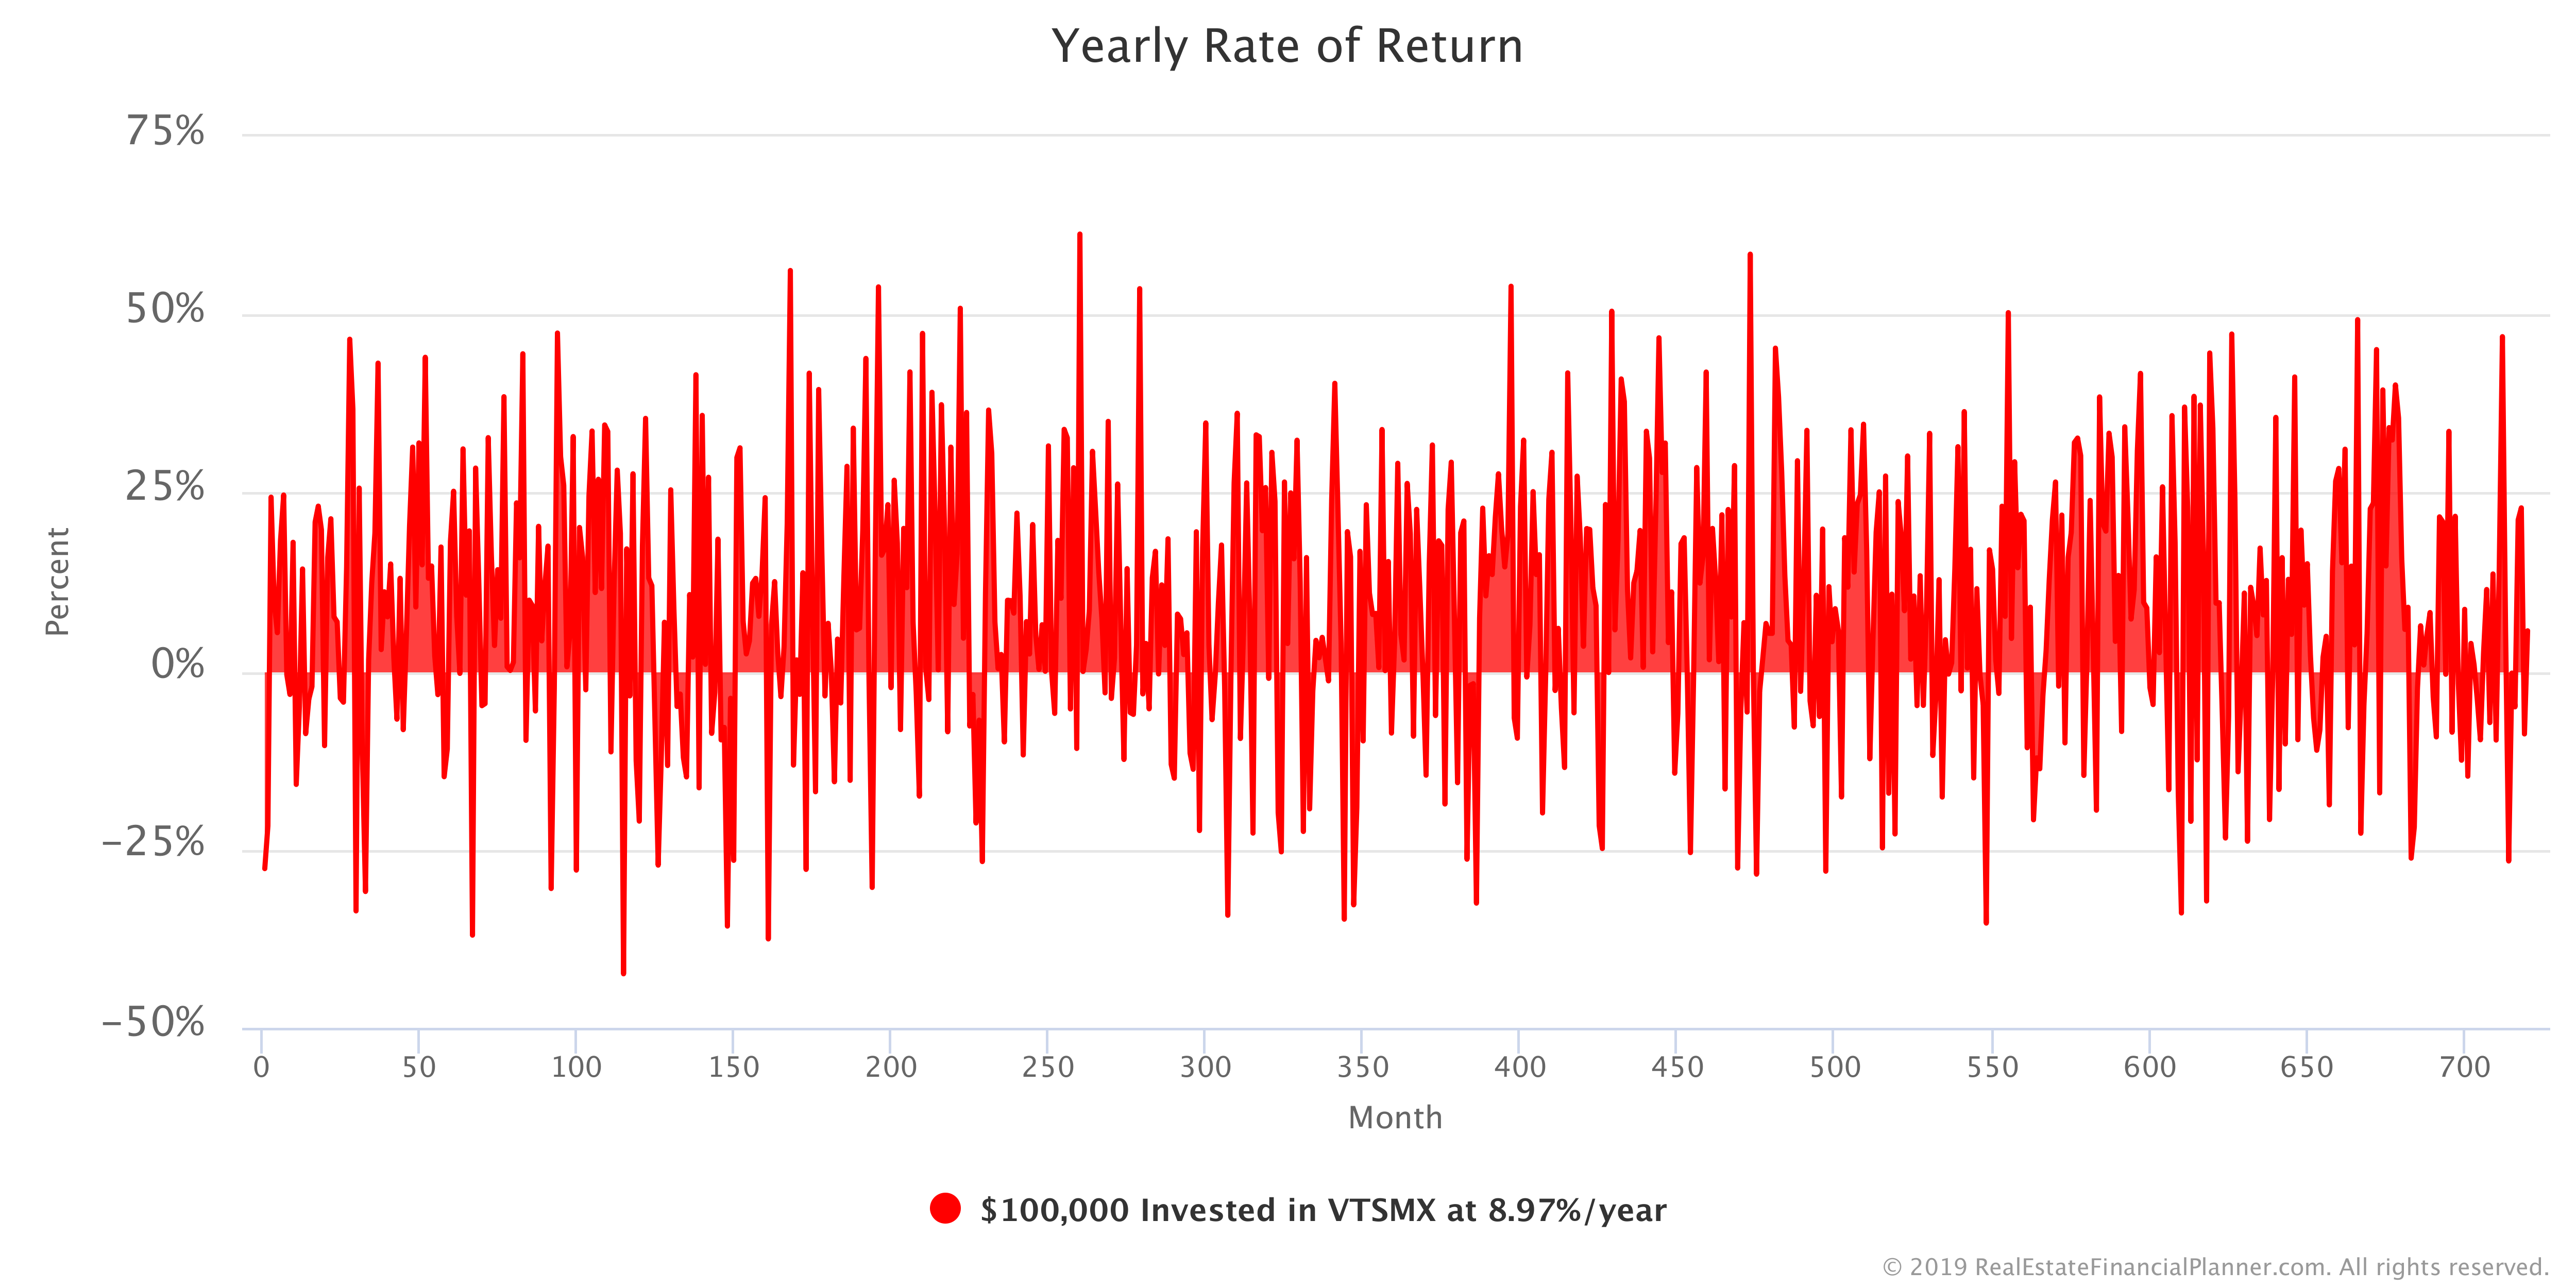
As you can see in the Chart above, there are months where the return we’re seeing in the stock market (annualized) is negative… that means the value of our investment is going down. Other months, the return is positive and large in magnitude… that means the value of our investment that month grew and by a large amount.
If you want to copy this Scenario to your own Real Estate Financial Planner™ account you can do that using the button below. Once in your own Planner™, you can modify any of my assumptions. Or, you can add additional complexity to the model.
Login to copy this Scenario. New? Register For Free
Scenario into my Real Estate Financial Planner™ Software
SS 016 Investing $100,000 in Stocks at Approx 8.97%/yr
So far, we’ve covered investing $100K in savings, CDs, bonds and stocks. Next, let’s take our first look at investing in real estate.
Investing $100K Buying A Home To Live In
What if we took part of the $100K and bought a home to live in and then invested the rest in stocks? That’s what we will look at here.
If we withdrew about $20K and used that as a 5% down payment to buy a home to live in, it will ultimately reduce the amount of money we pay for housing over the long-term.
If we reinvested “housing savings” back into the stock market and left the other $80K+ in the stock market, how much Net Worth do we end up with? That’s shown in the Chart below.
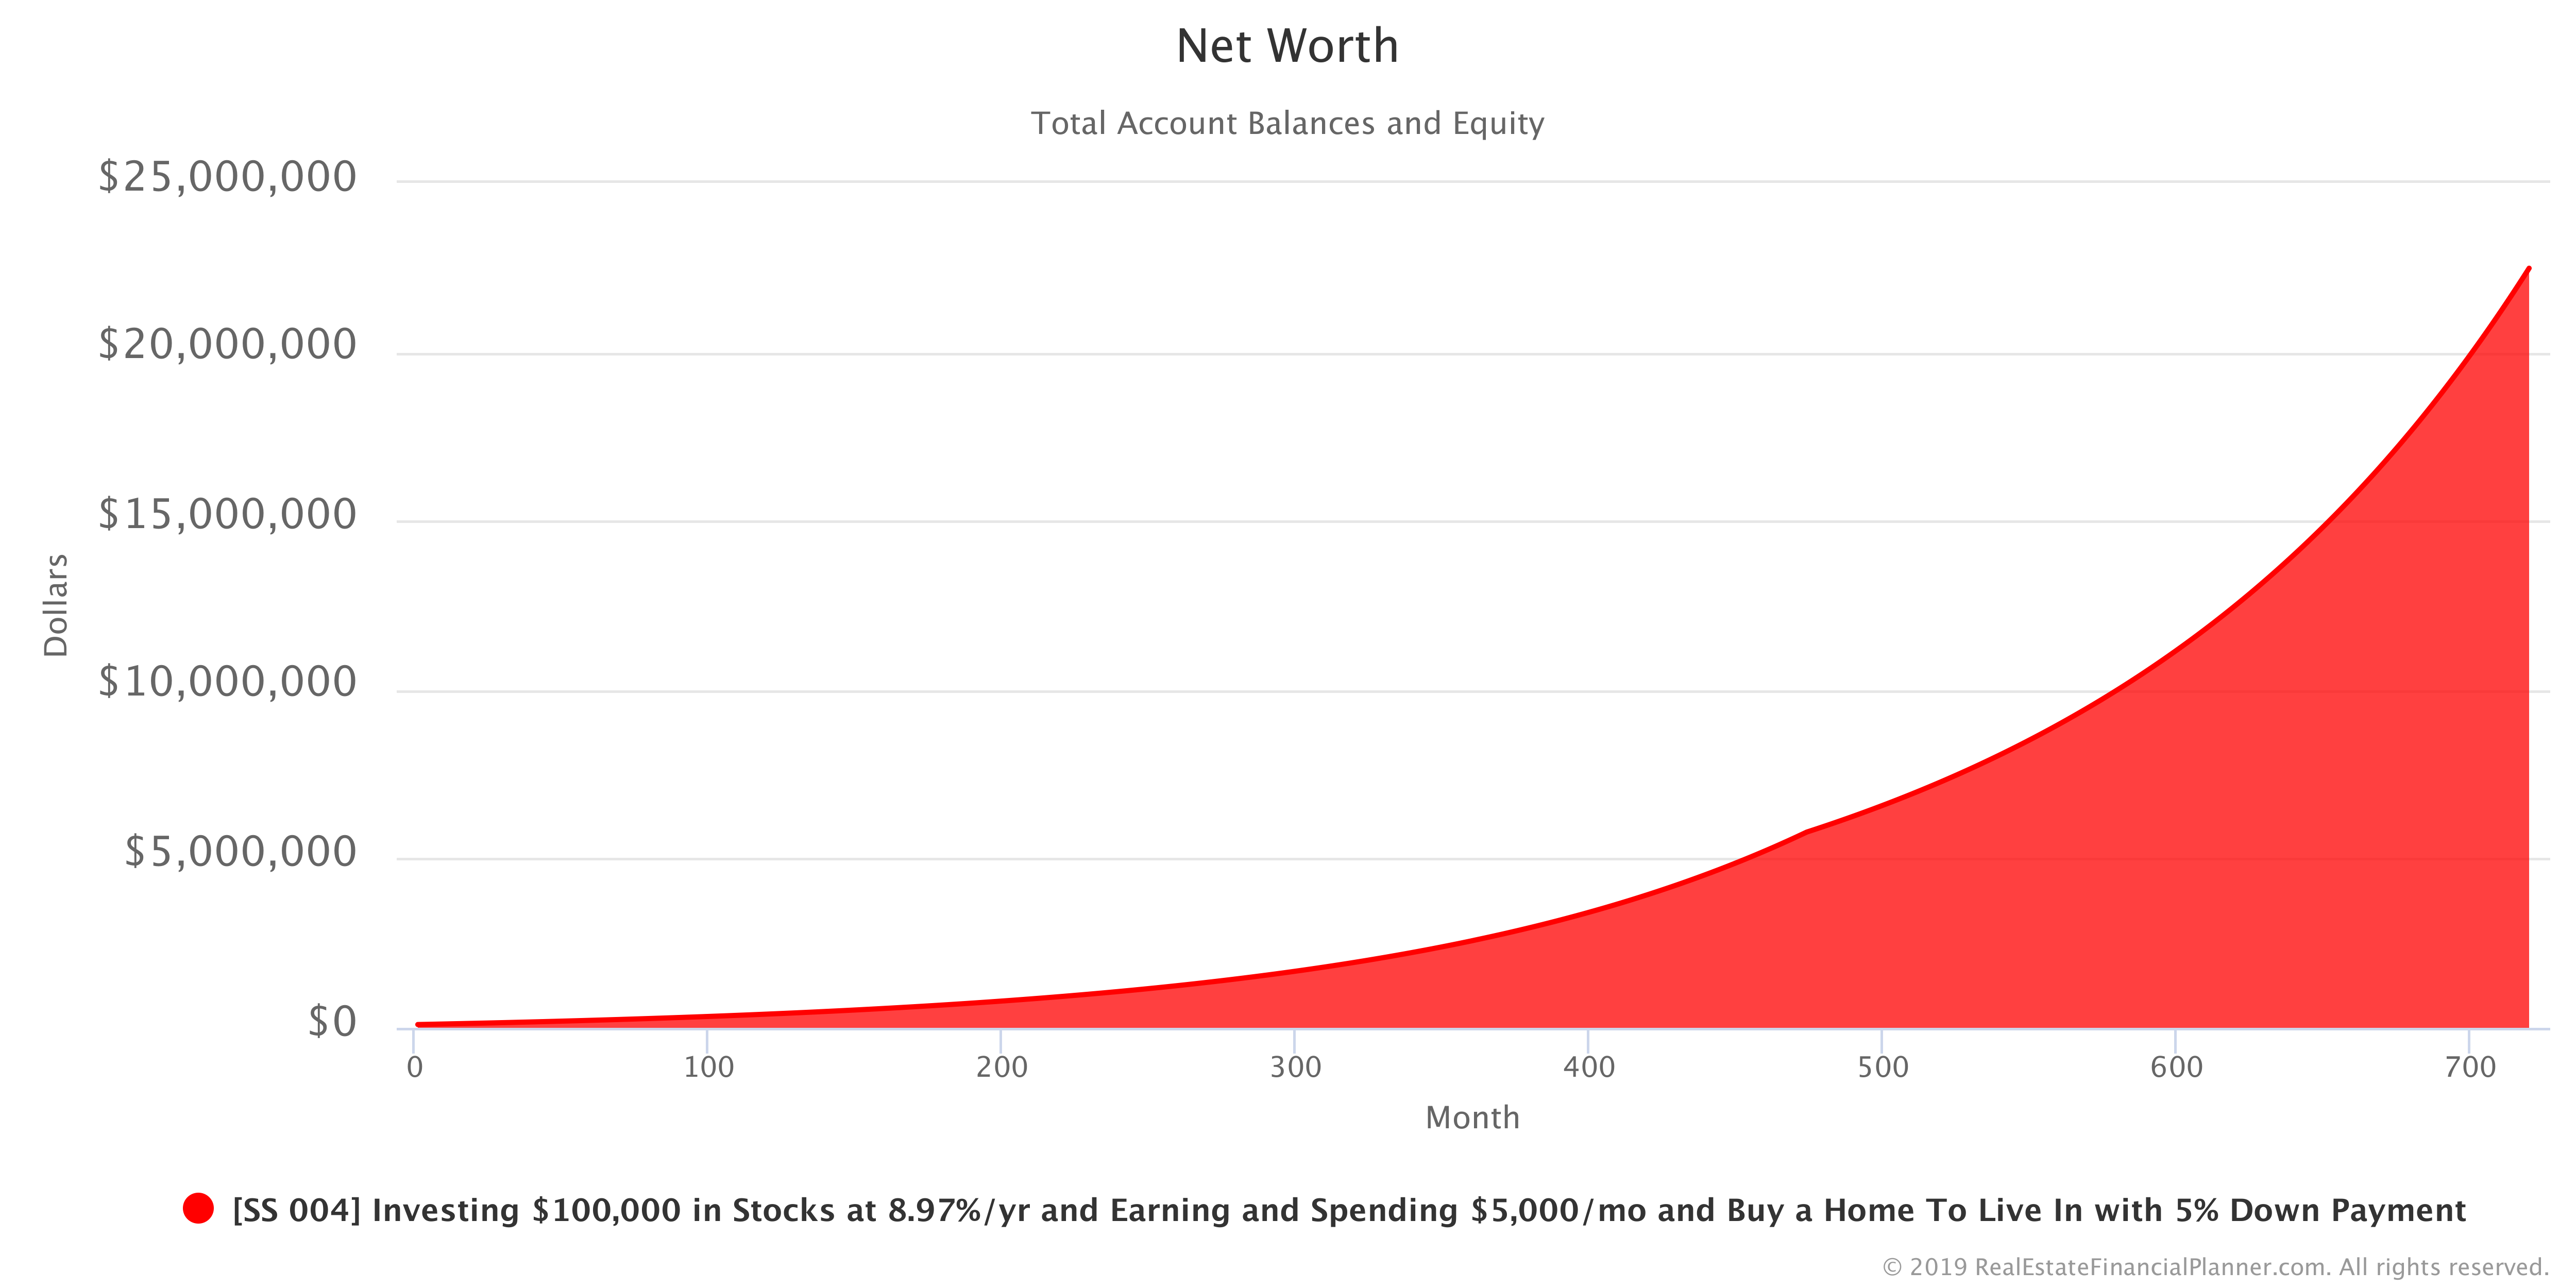
Remember, that Net Worth now is more than just the stock market account balance. Now, Net Worth is made up of both the stock market account balance and the equity you have in your property.
How does this compare to our other options for investing $100K? How does it compare to investing in savings, CDs, bonds and just stocks? Here’s a Chart showing Net Worth comparing all of the strategies we’ve considered to this point.
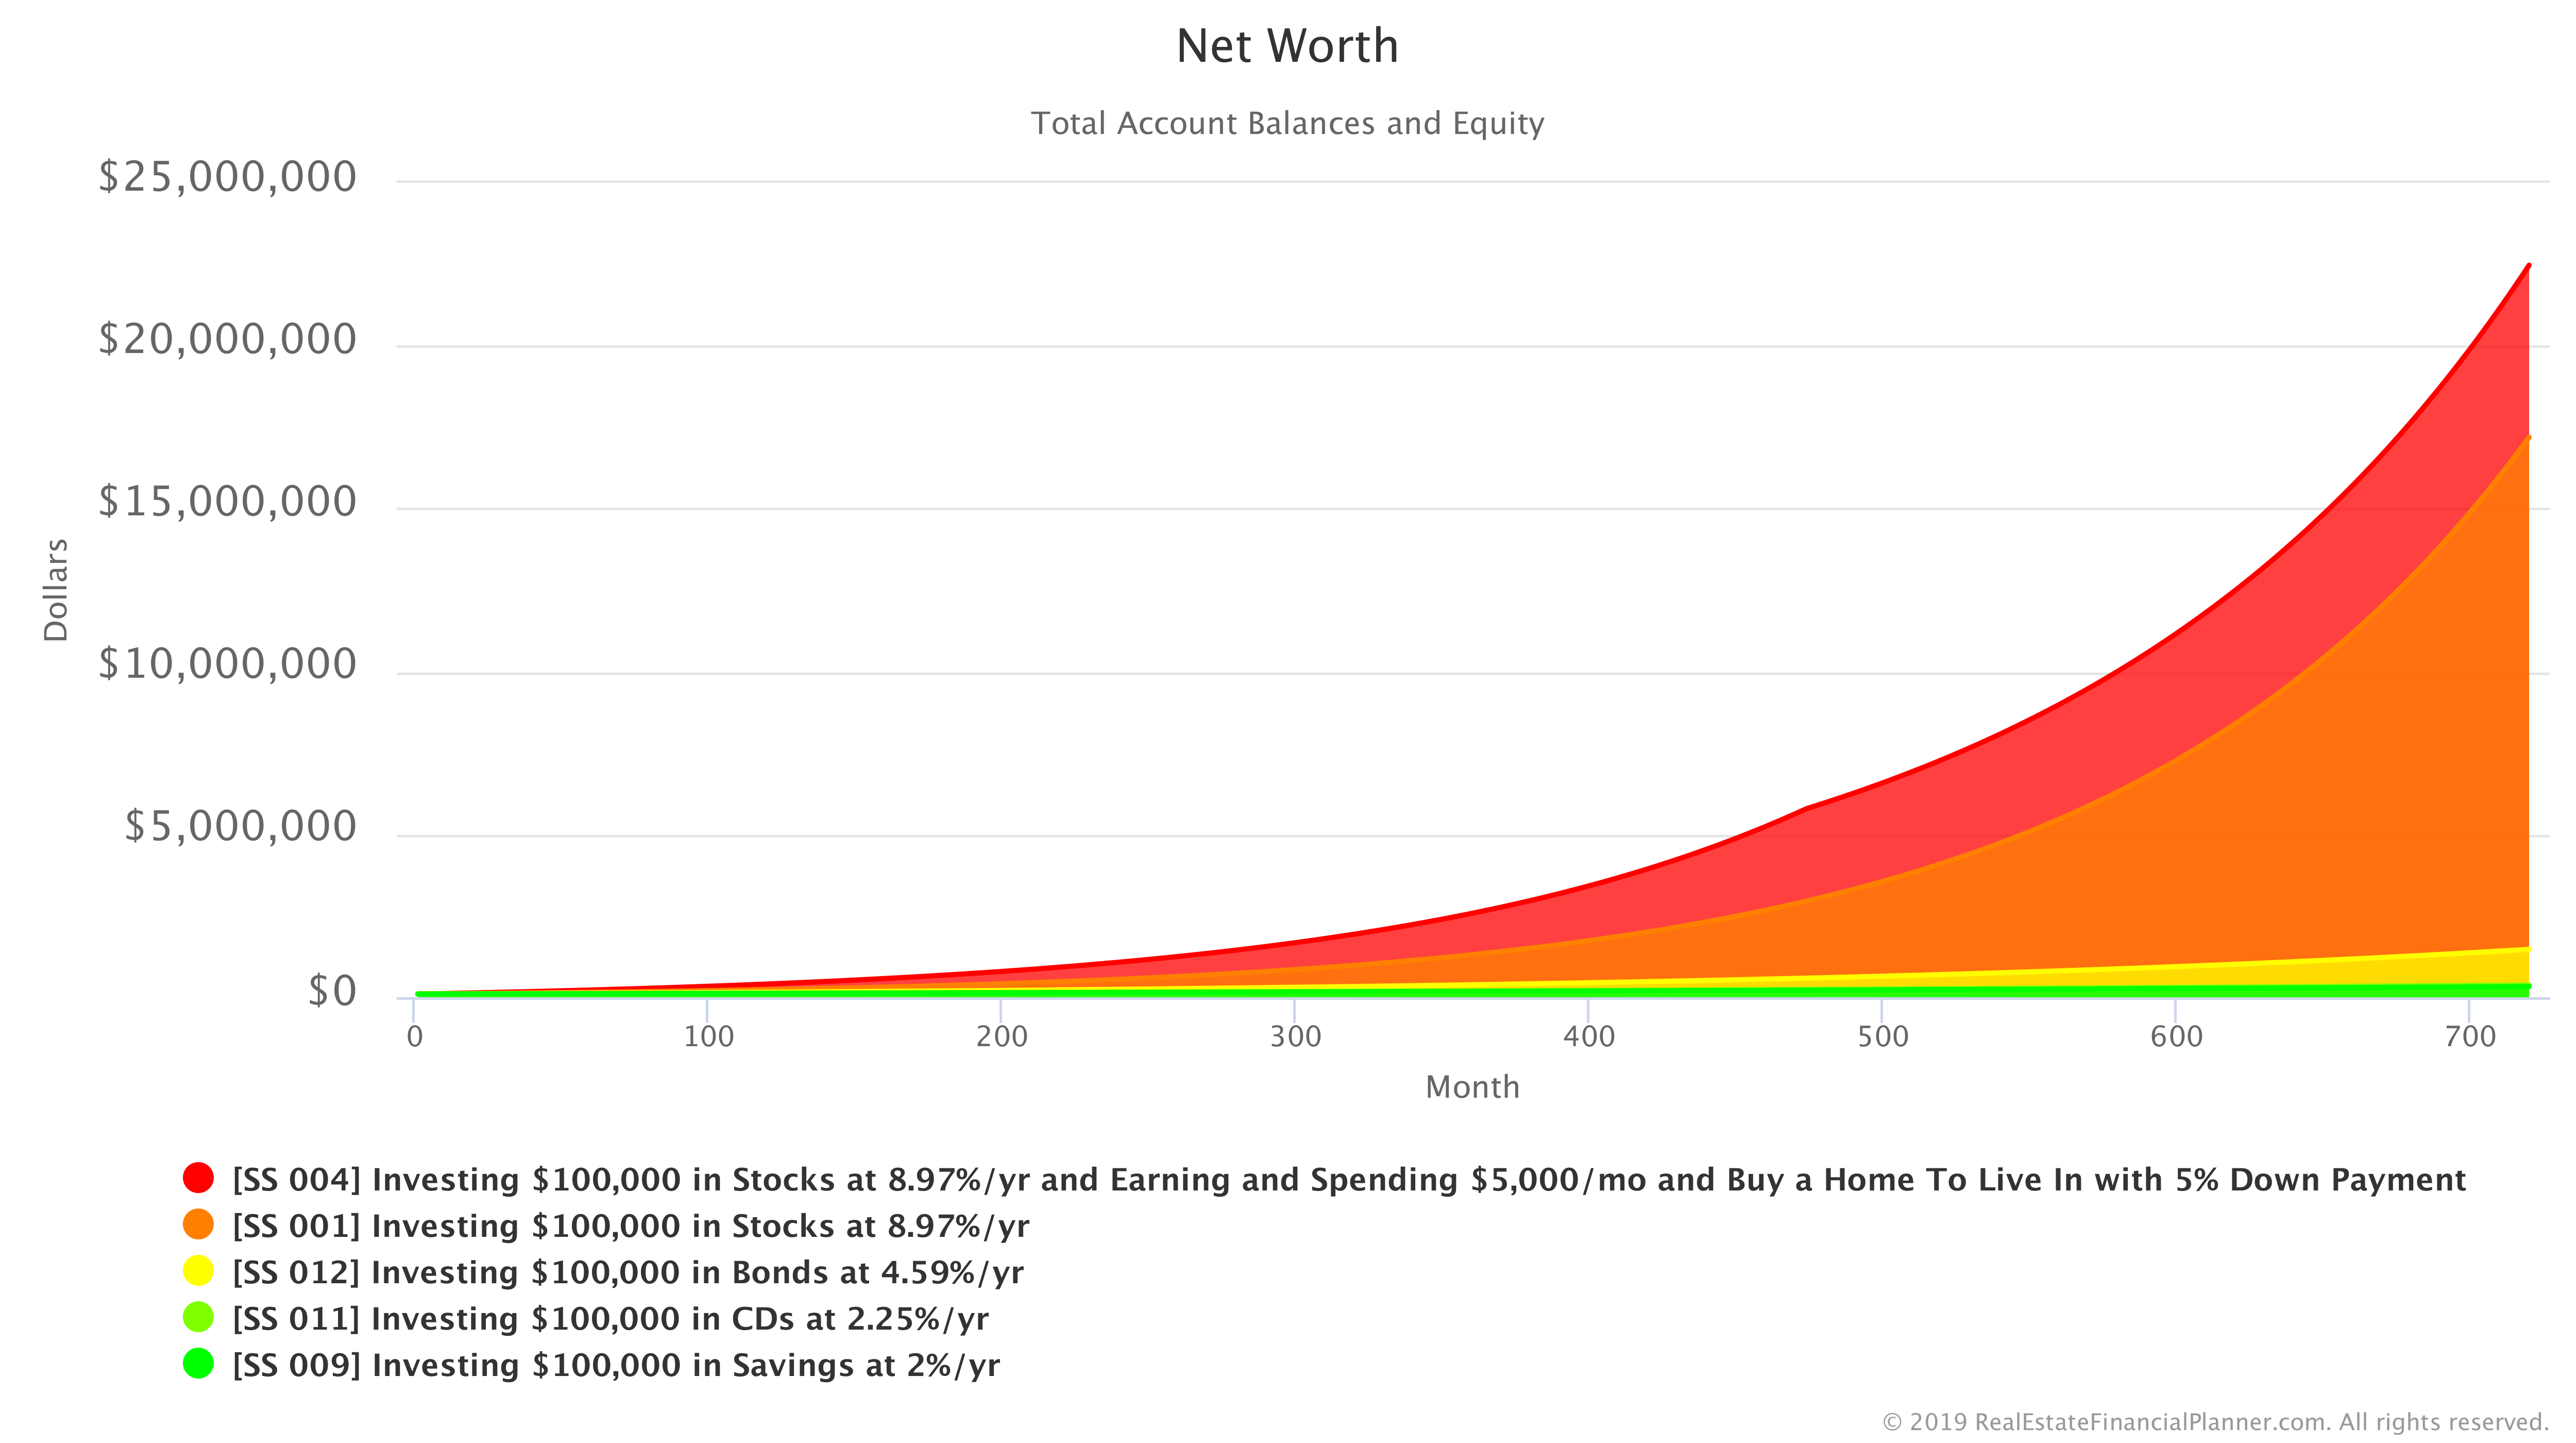
For ease of reading, I am also going to show you the summary in year 60 (month 720) so you can see the Net Worth values a little easier.
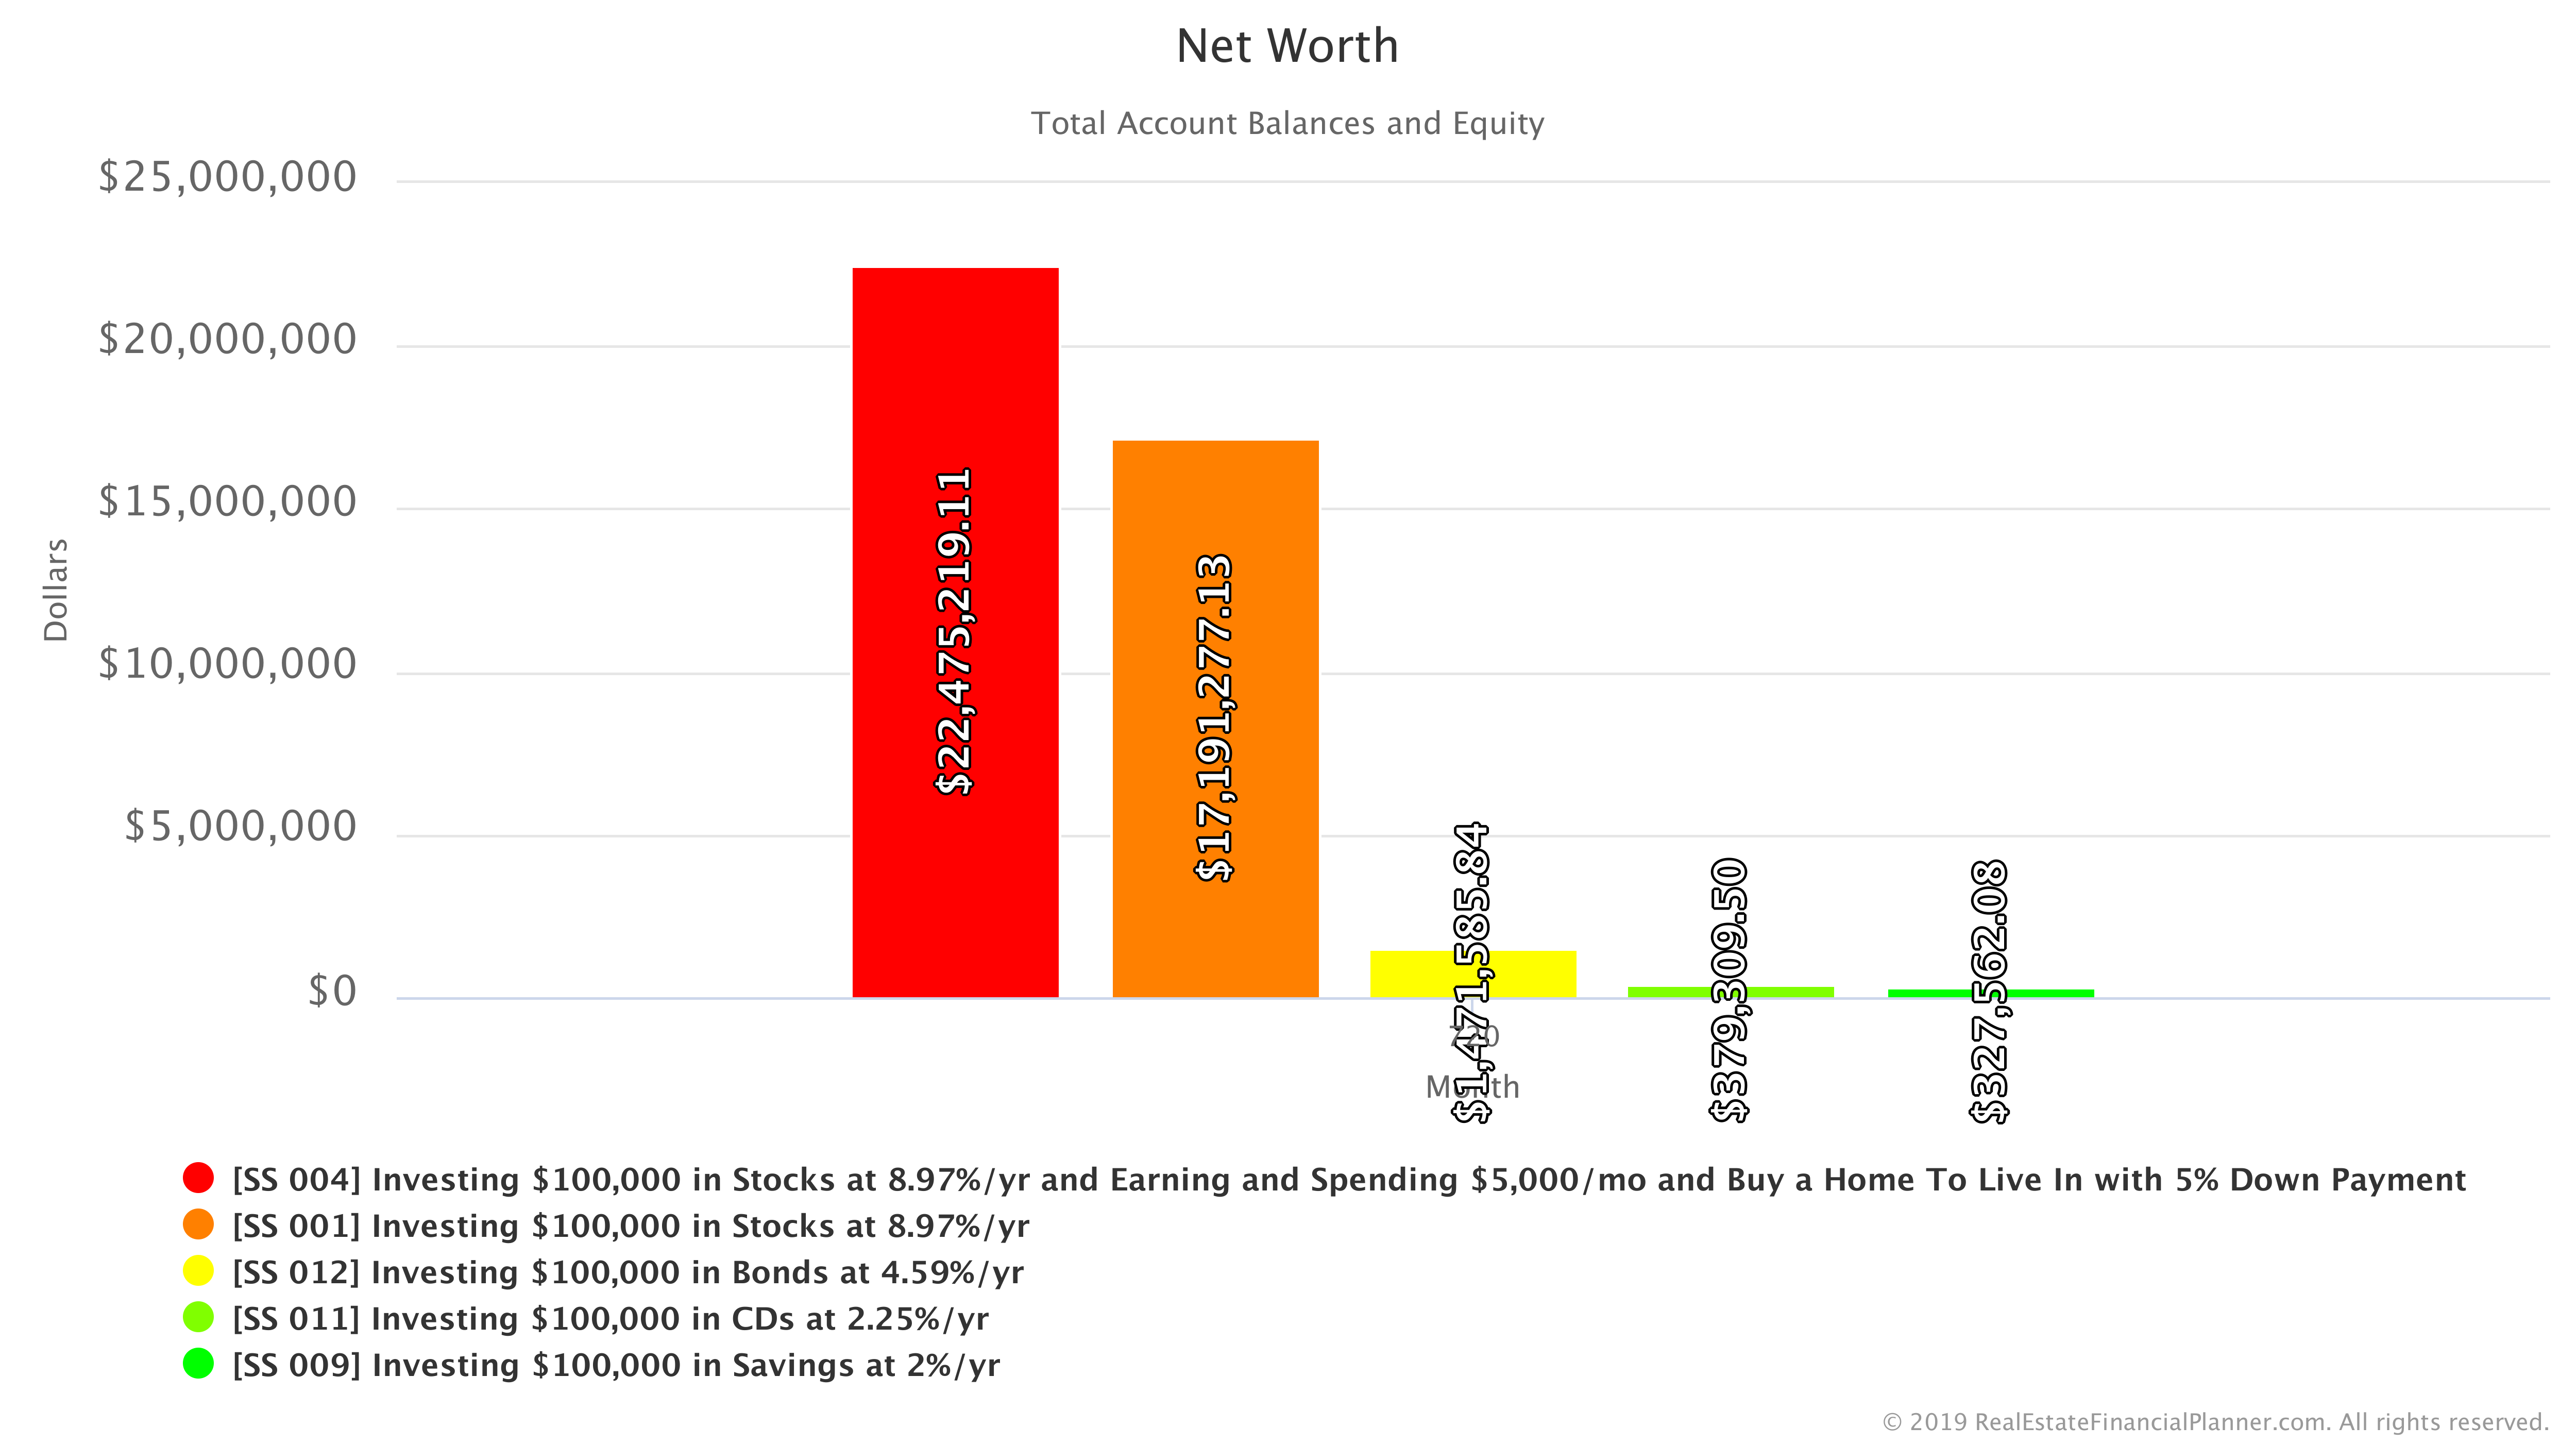
There are quite a few “levers” for you to adjust when modeling this Scenario. The assumptions you use for the house you buy to live in matter… a lot. But, our software allows you to change any or all of the assumptions we made.
- Do you live in a city with less expensive housing?
- Or, more expensive housing?
- Can’t get the interest rate we used because rates have gone up since we wrote this post?
- Are your property taxes much higher or lower than what we used?
- Did you want to see how more or less down payment impacts your Net Worth?
Want answers to any of these changes (or many more)? No problem… you can copy the Scenario to your own Planner™ and change these and many other assumptions using the button below.
Login to copy this Scenario. New? Register For Free
Scenario into my Real Estate Financial Planner™ Software
SS 004 Investing $100,000 in Stocks at 8.97%/yr and Earning and Spending $5,000/mo and Buy a Home To Live In with 5% Down Payment with 2 Accounts, 1 Property, and 2 Rules.
Or, read the detailed, computer-generated, narrated Blueprint™
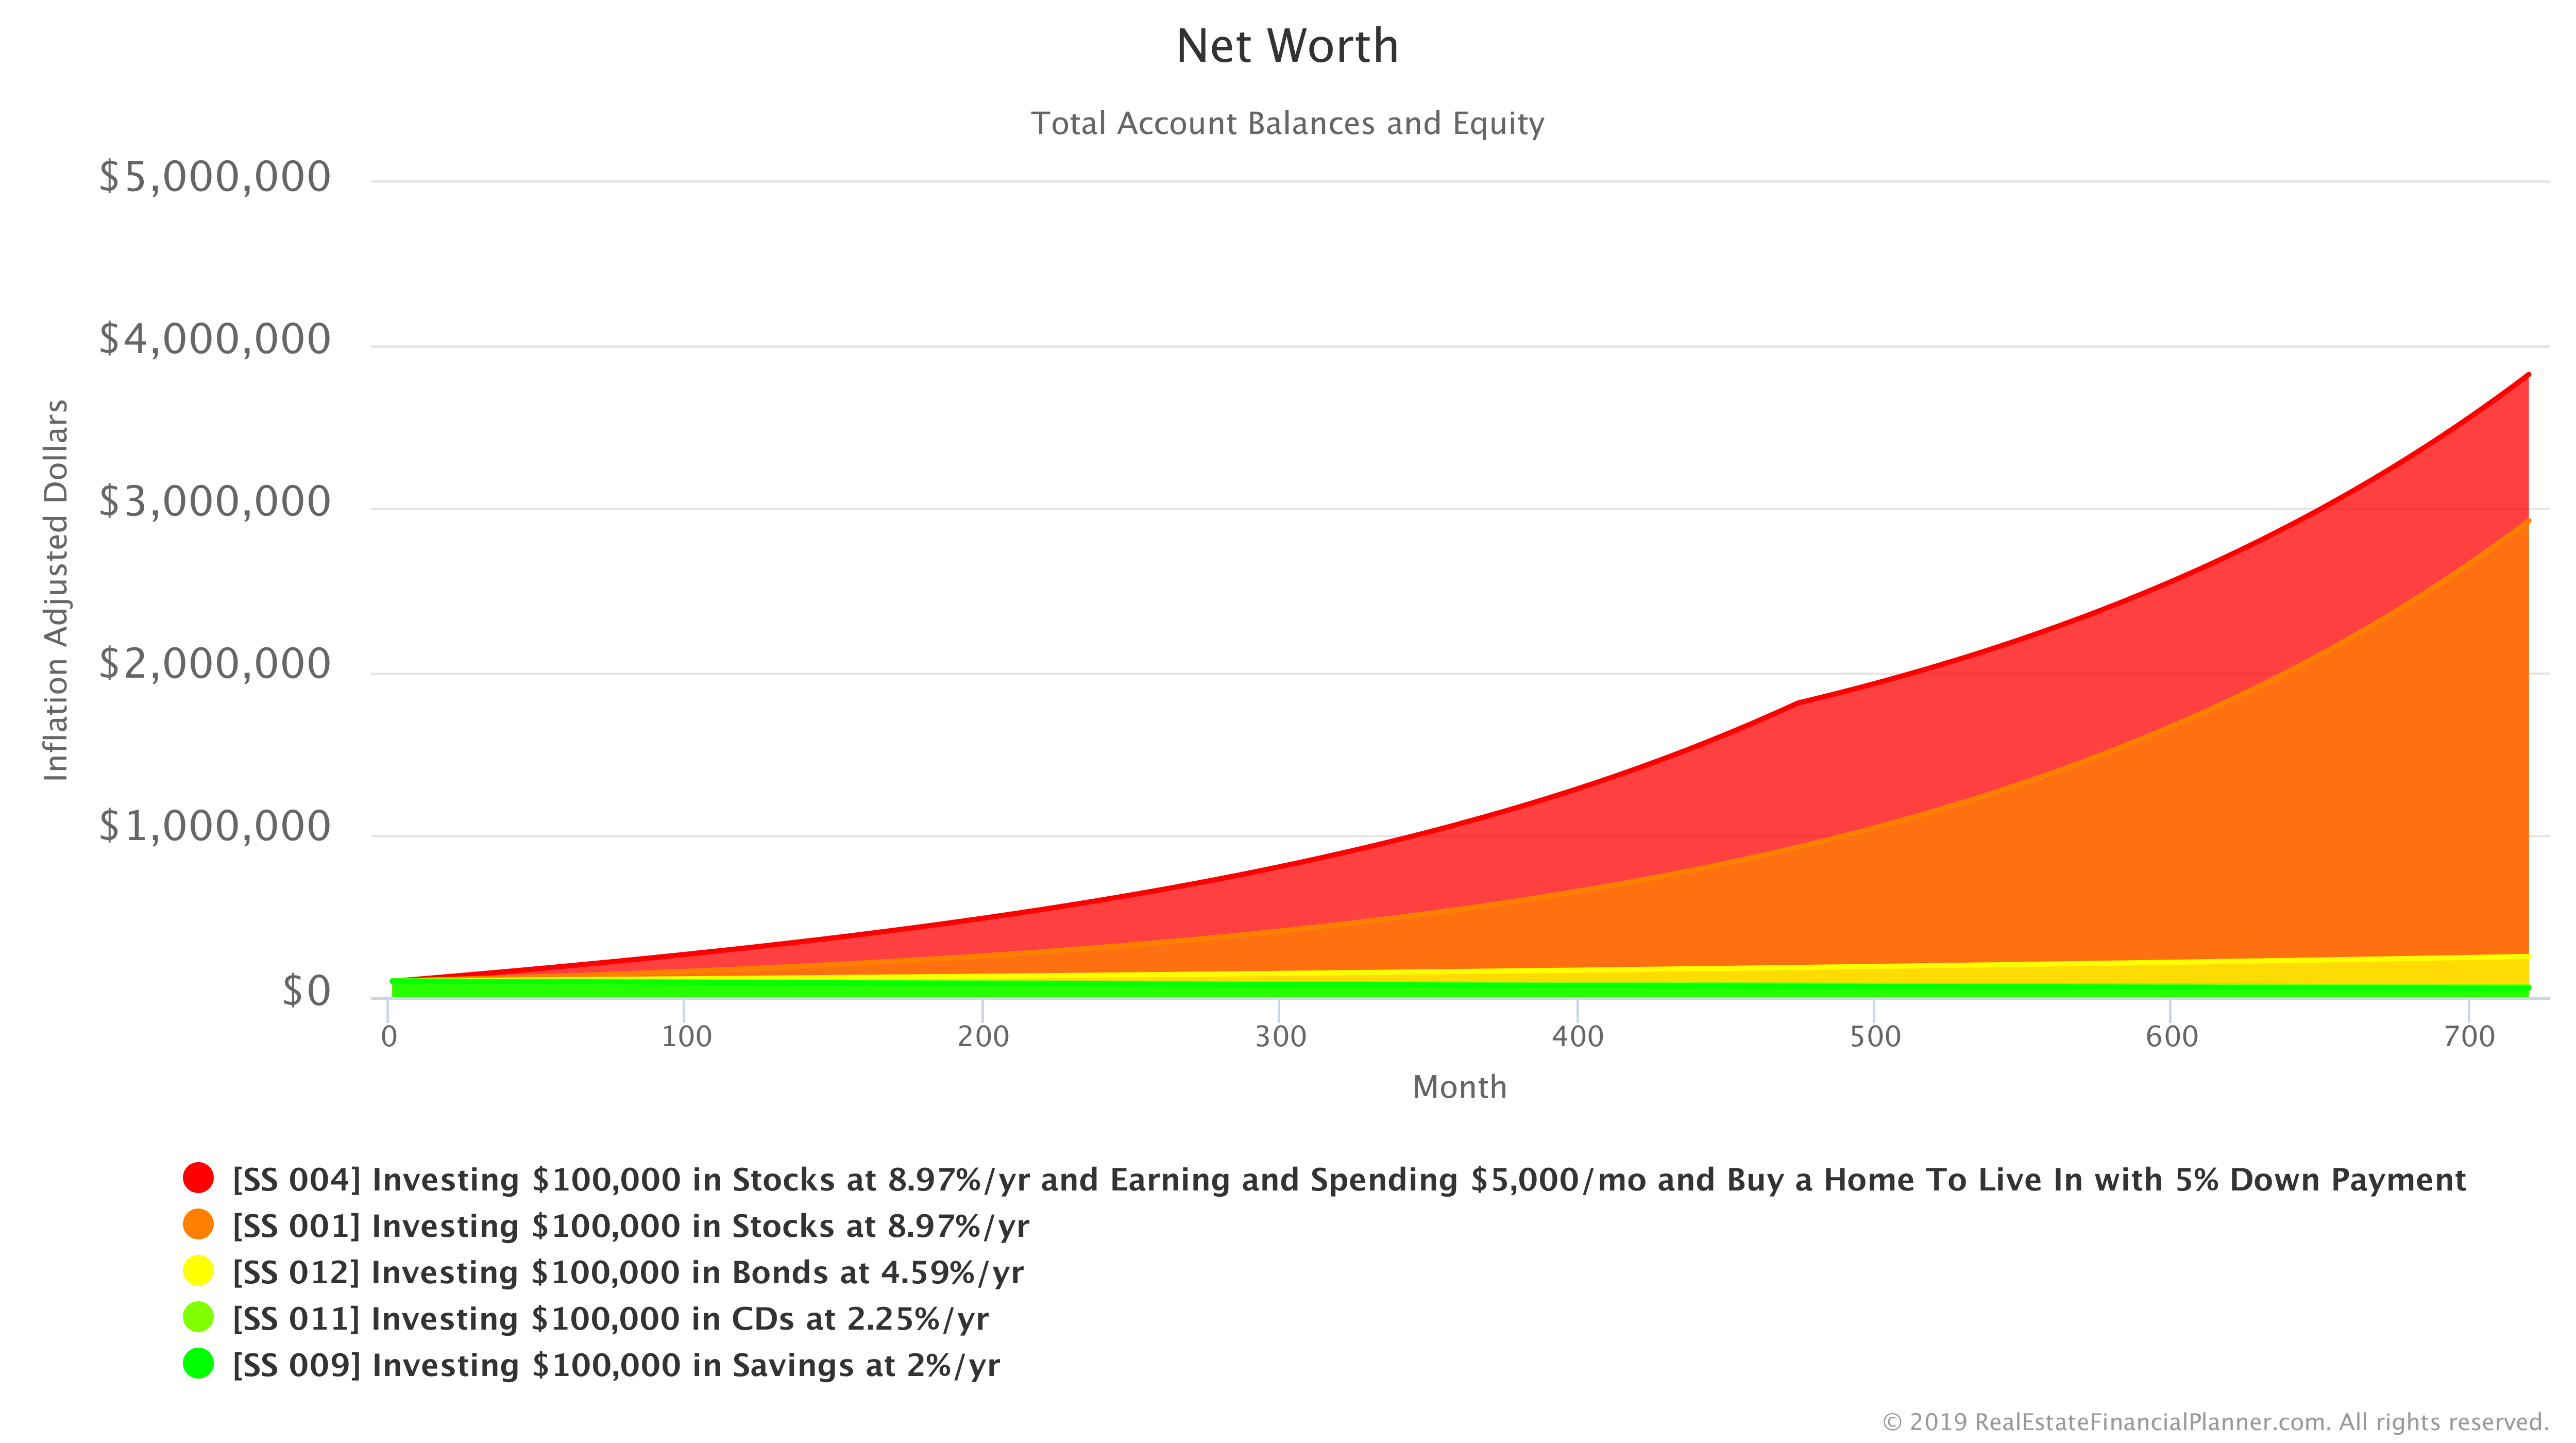
Remember, our frenemy “inflation”? How much does inflation hurt/help us when we buy a house (it does both you know with real estate)? You can see that in the Chart below comparing Net Worth for all the Scenarios so far.
Of course, we can do the same random variability that we’ve been doing with Yearly Rate of Return for the investment accounts with real estate too. We could set the Appreciation Rate to be variable. Or, perhaps the Rent Appreciation Rate. Maybe even the Maintenance Rate to model how repairs can be random. We could also make Mortgage Interest Rates variable which will be much more important as we buy more than one property. That’s next.
Investing $100K Buying 20% Down Payment Rental Properties
Previously, we bought a home to live in. In this Scenario we won’t be buying a home to live in. Instead, we will rent a property to live in, but we will also buy properties to rent to others as well.
We will buy rental properties with 20% down payments whenever we have enough money to buy one. We will limit ourselves to buying 10 rental properties in total.
In our example, we are able to buy 1 property right away with the initial $100K. We keep the remaining investment capital invested in stocks earning a fixed 8.97% per year.
Once our stock market account balance has enough money for another 20% down payment plus at least $10K (adjusted up for inflation over time), we buy another rental property. The rental property prices are going up over time (from appreciation), so the ones we buy later are more expensive than the one we buy right away. But that also means that the rental properties we own are worth more and that adds to our Net Worth.
There is a ridiculous amount of detail I could go over here (and that I cover elsewhere like in the book I wrote for my son), but I don’t want to side-track you going into all the details in this article.
For now, just realize we took the $100K and bought ten 20% down payment rentals as quickly as we could raise down payments and invested any excess cash in the stock market at a fixed 8.97% return. When we do that, our Net Worth looks like the Chart below.

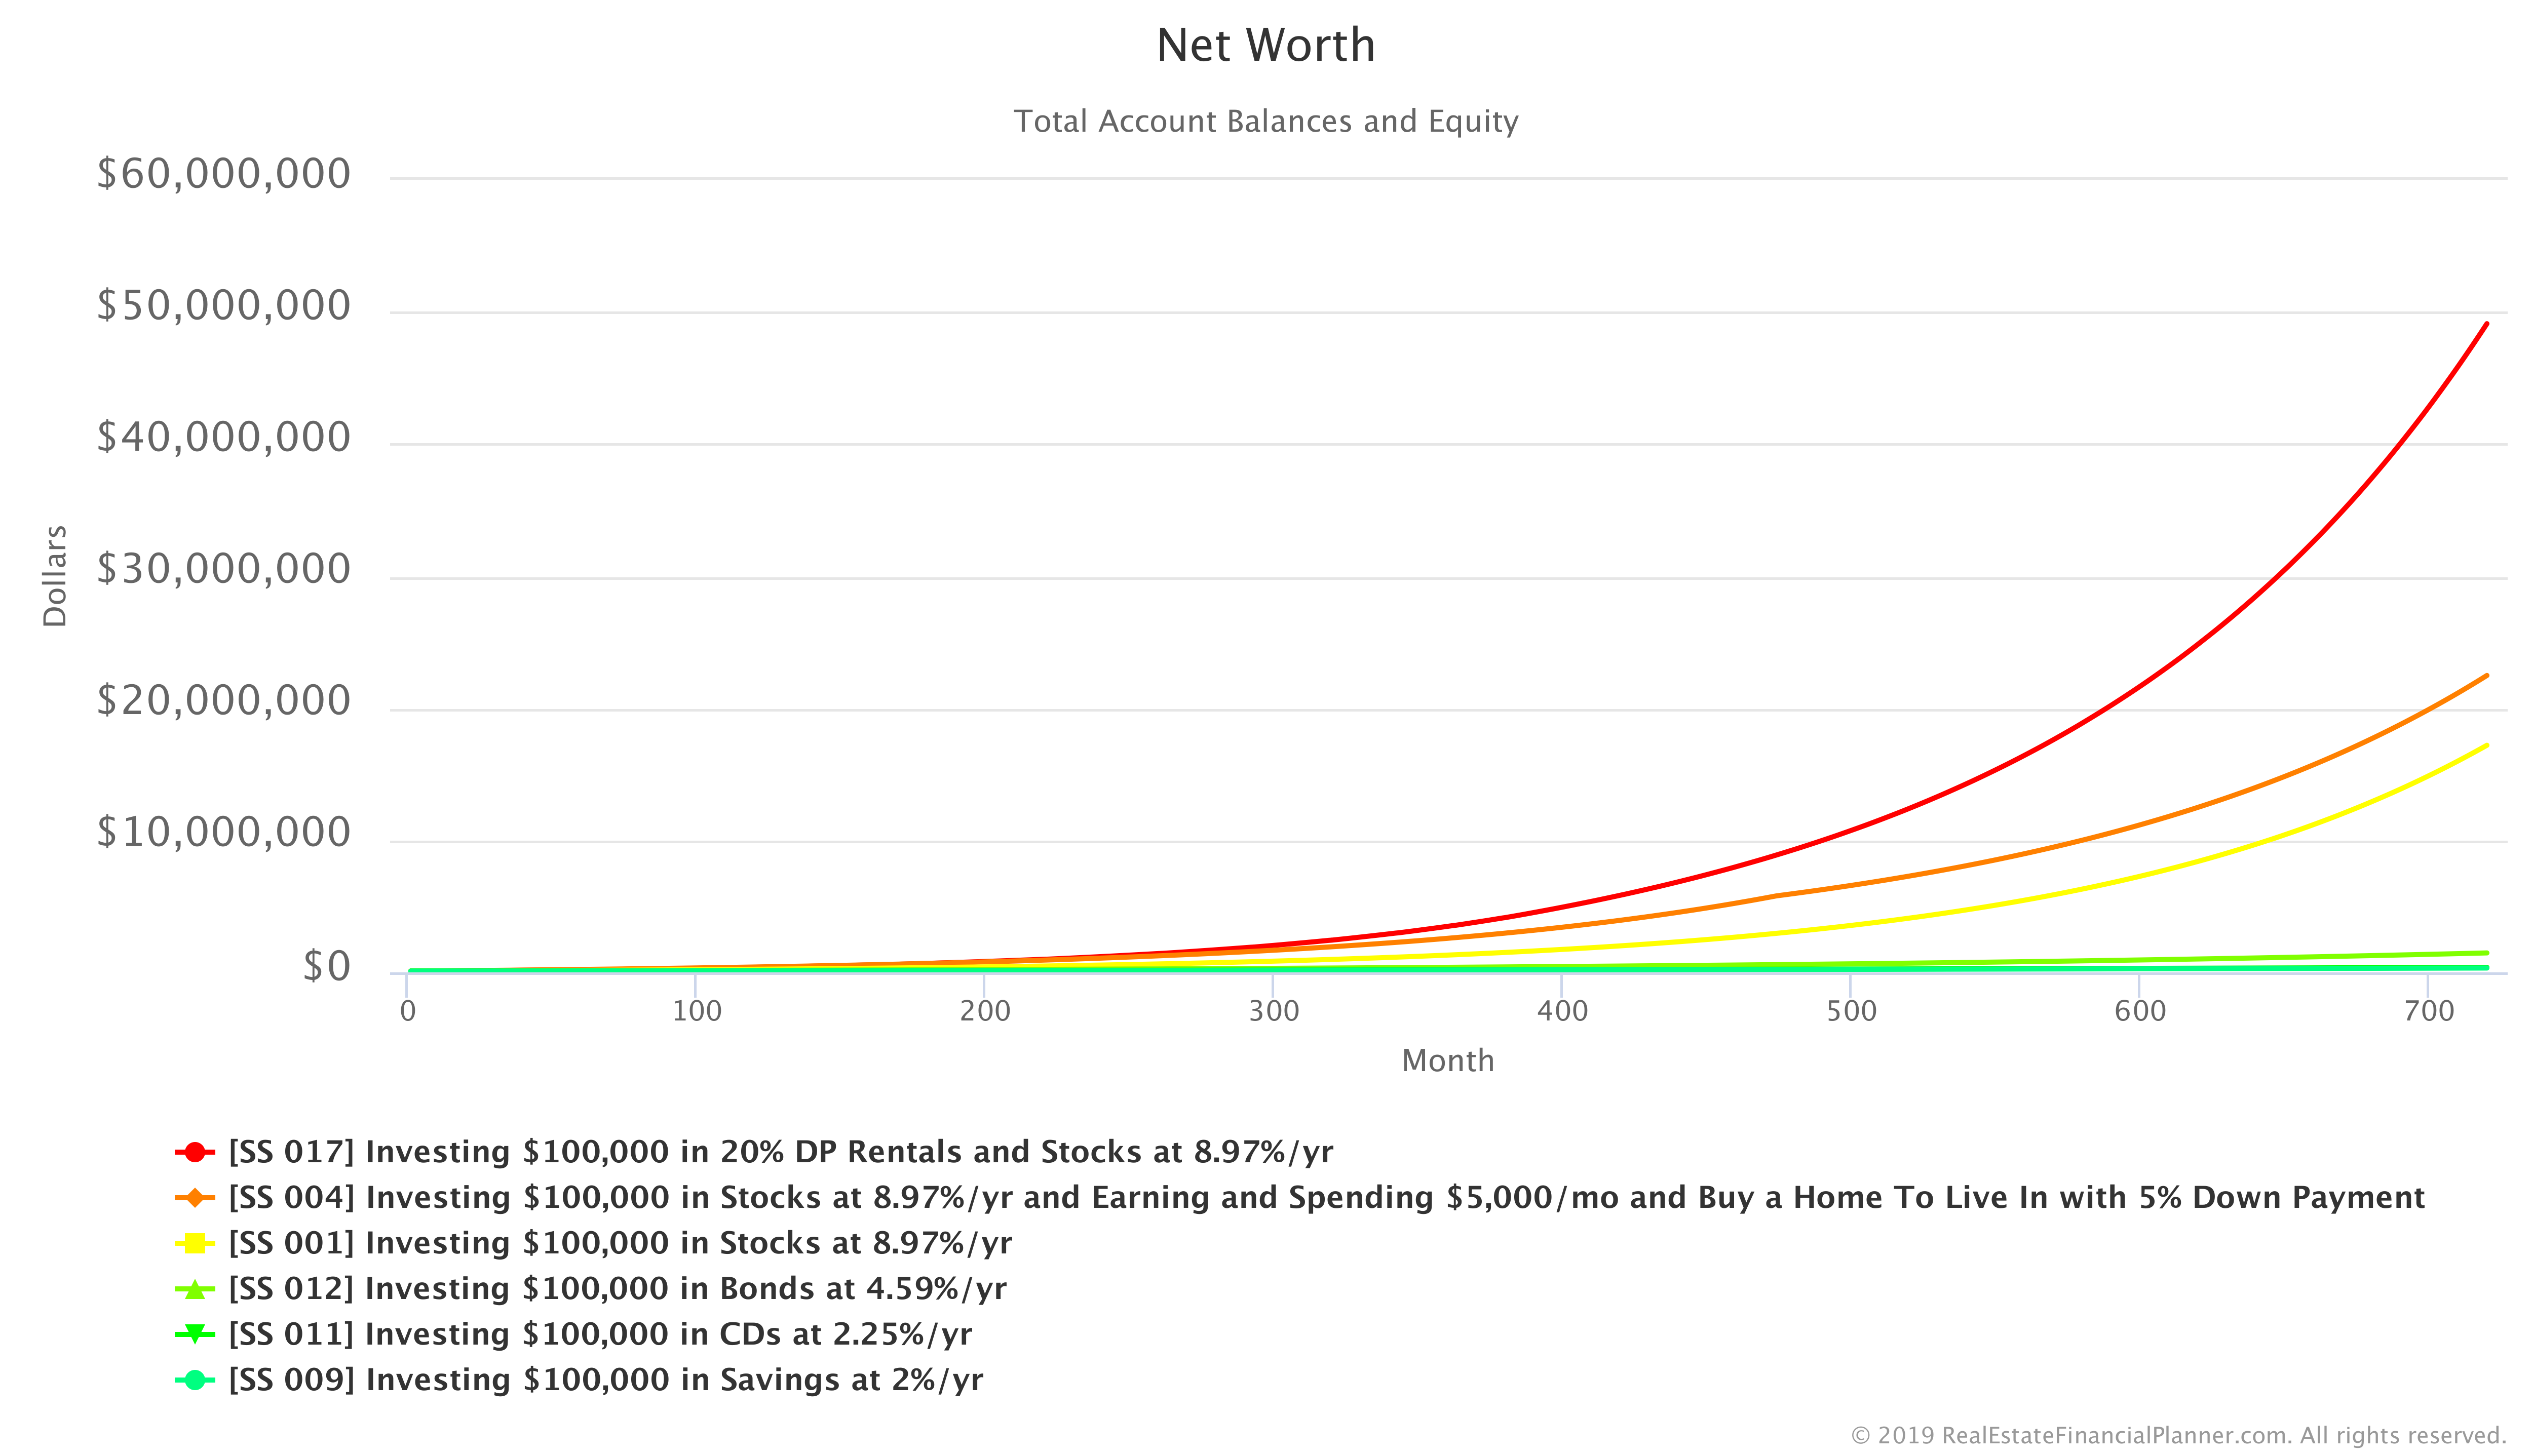
In my opinion, that’s impressive. But, how does it compare to the other investment options we’ve considered to this point? The Chart below compares all of them so far.
And, here’s just year 60 for ease of comparison.
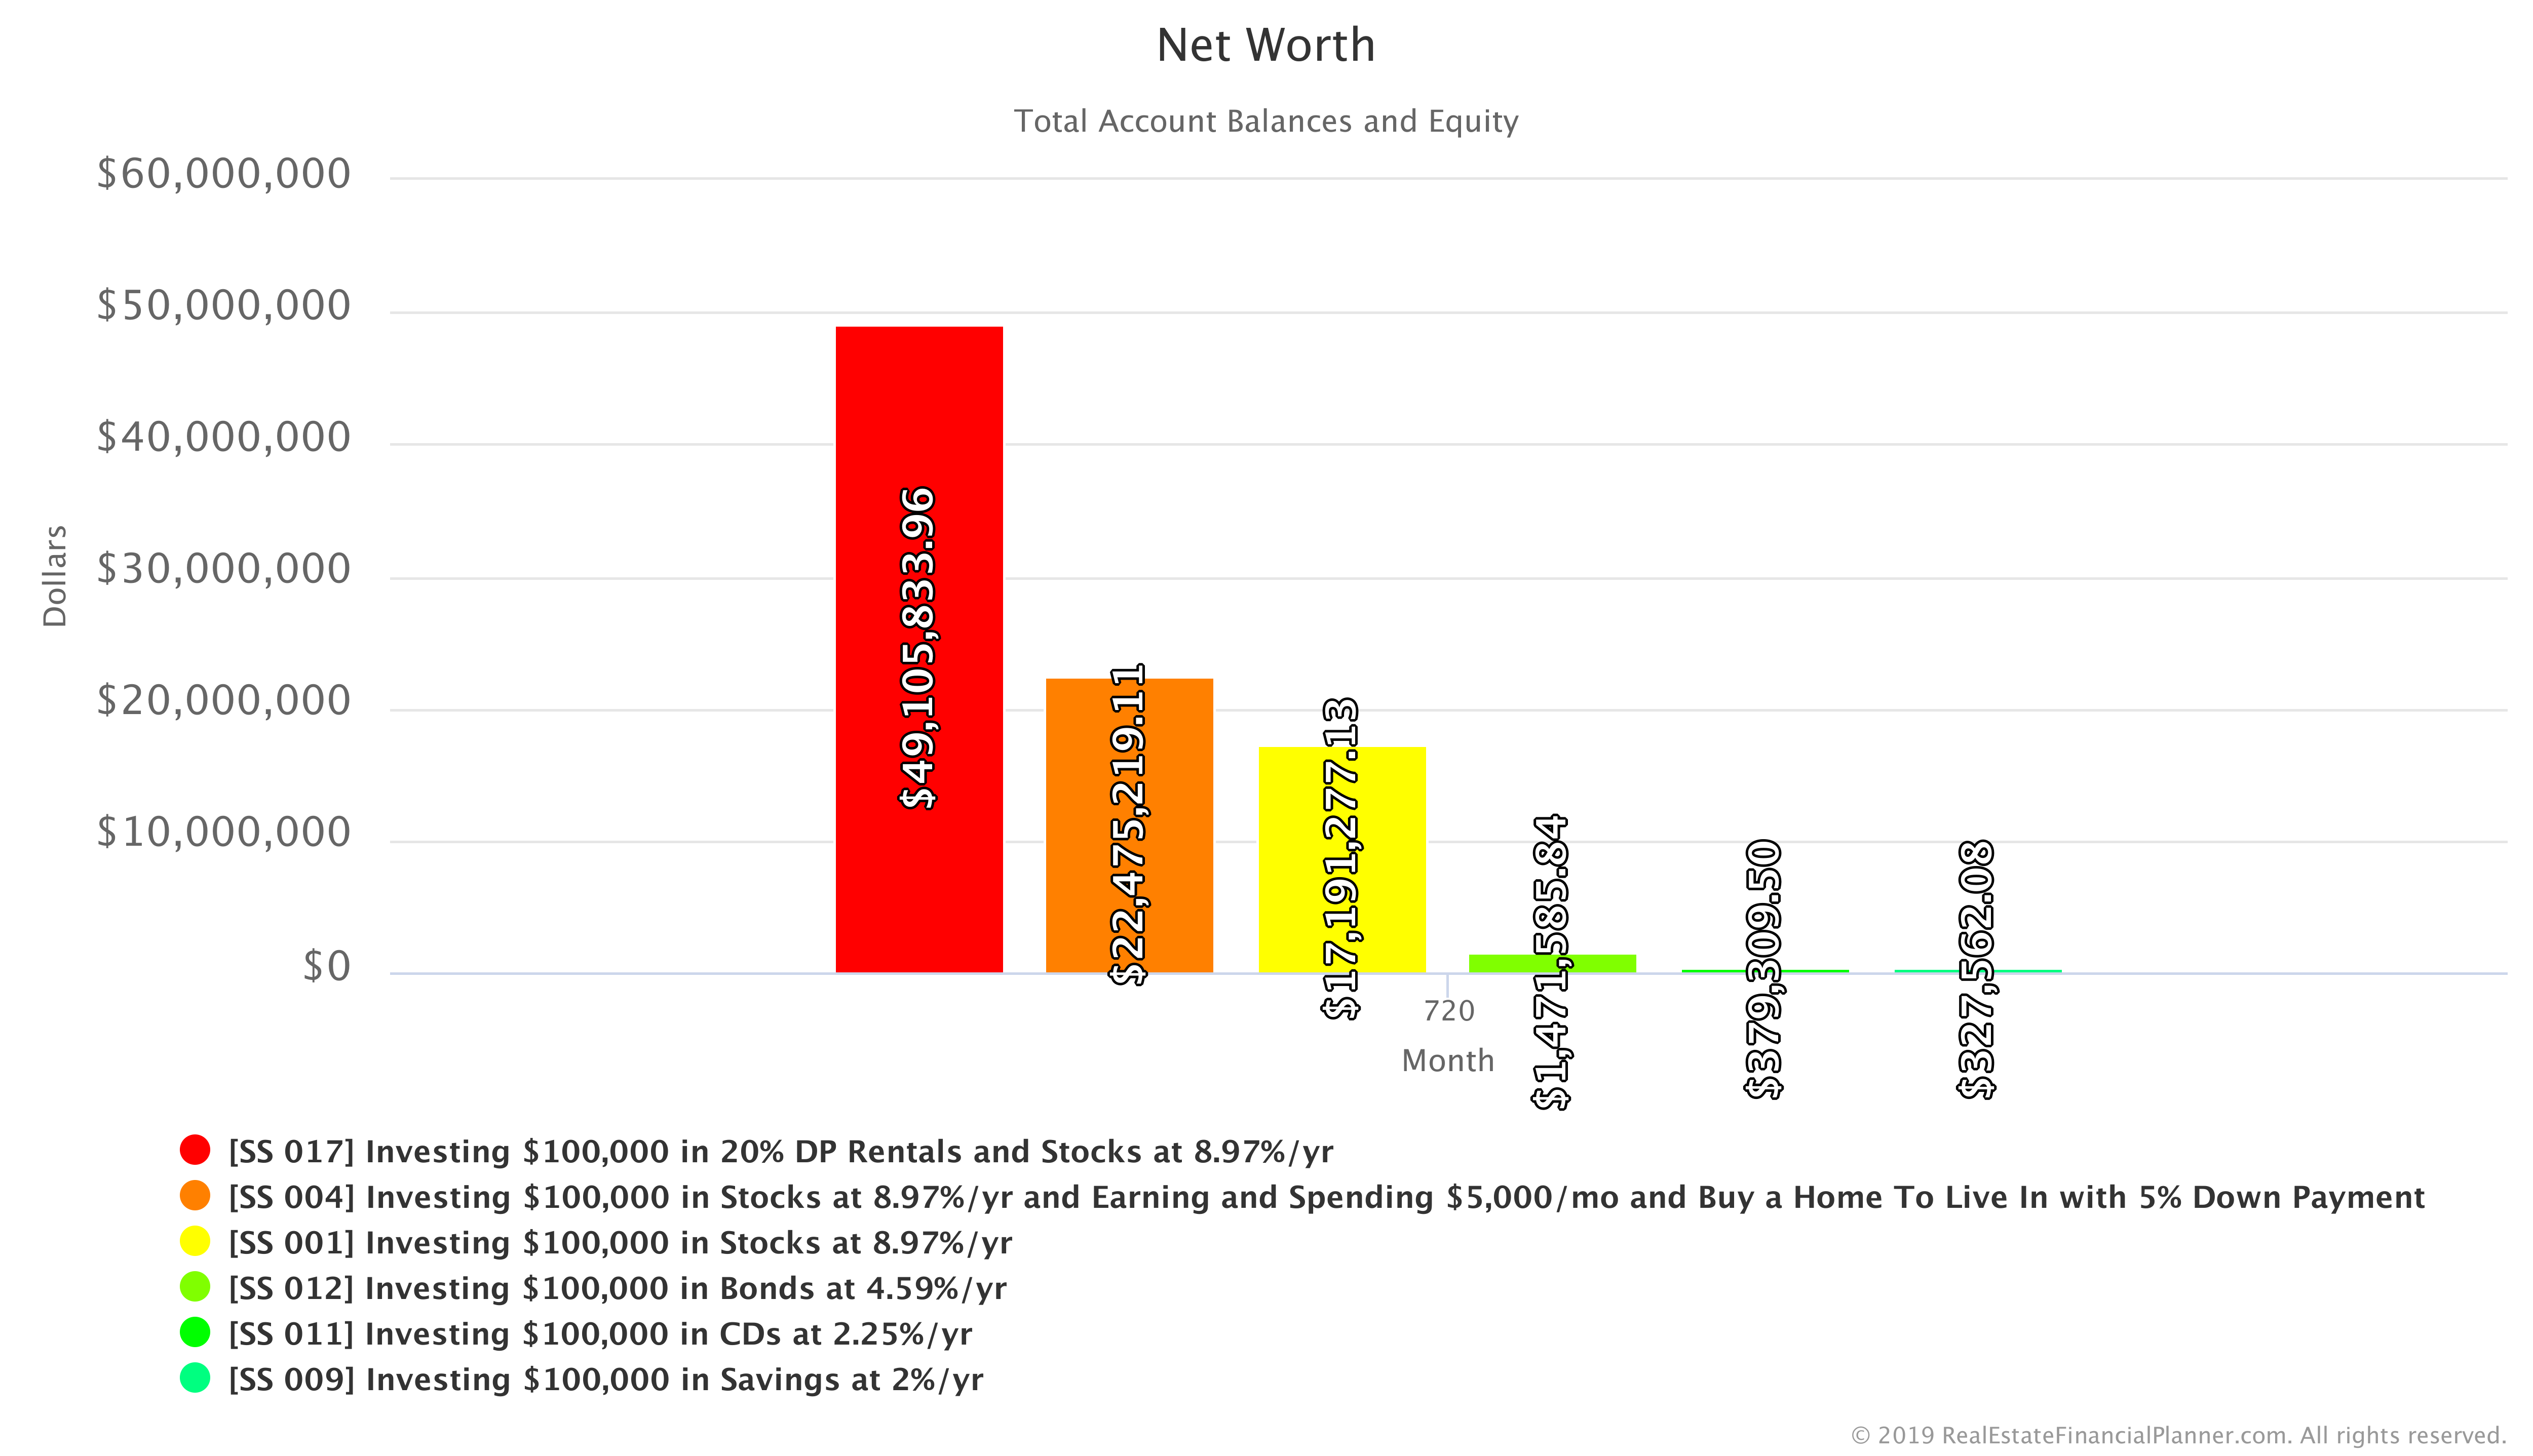
As you can see in the Chart above buying the rentals seems to be the most profitable option so far.
But, as I mentioned in the section on buying a house to live in above, the devil is in the details… the assumptions you use for your rental properties matter… a lot.
- If we lower the Appreciation Rate from the 3% per year that I used, it can significantly impact all our numbers.
- If we change the Rent Appreciation Rate that will affect lots of things as well. It impacts how much cash flow we get from the rental which impacts when we save up enough to buy our next rentals and much more.
- Buying cheaper properties matters. As would buying more expensive properties.
- Getting better or worse interest rates matters.
- How much we pay for maintenance matters.
- And, as you already know, the Yearly Rate of Return for the stock market money matters too.
That’s why I am happy to tell you that you can copy the Scenario to your own Planner™. Change the assumptions to better reflect your perception of reality in your local market and your actual plan and rerun it to see the impact of your new numbers. Maybe with your assumptions, buying ten 20% down payment rentals performs worse than stocks.
It is possible… unlikely… but possible. Heck, my wife of 25 years, Tammy, could decide to leave me for my best friend… possible maybe… unlikely… but possible. But I digress… use the button below to copy the Scenario and change any or all of the assumptions for yourself.
Login to copy this Scenario. New? Register For Free
Scenario into my Real Estate Financial Planner™ Software
SS 017 Investing $100,000 in 20% DP Rentals and Stocks at 8.97%/yr with 2 Accounts, 1 Property, and 1 Rule.
Or, read the detailed, computer-generated, narrated Blueprint™
Since we’ve been doing it for many of the other Scenarios, let’s continue and show you the inflation-adjusted numbers for Net Worth. That’s shown below.
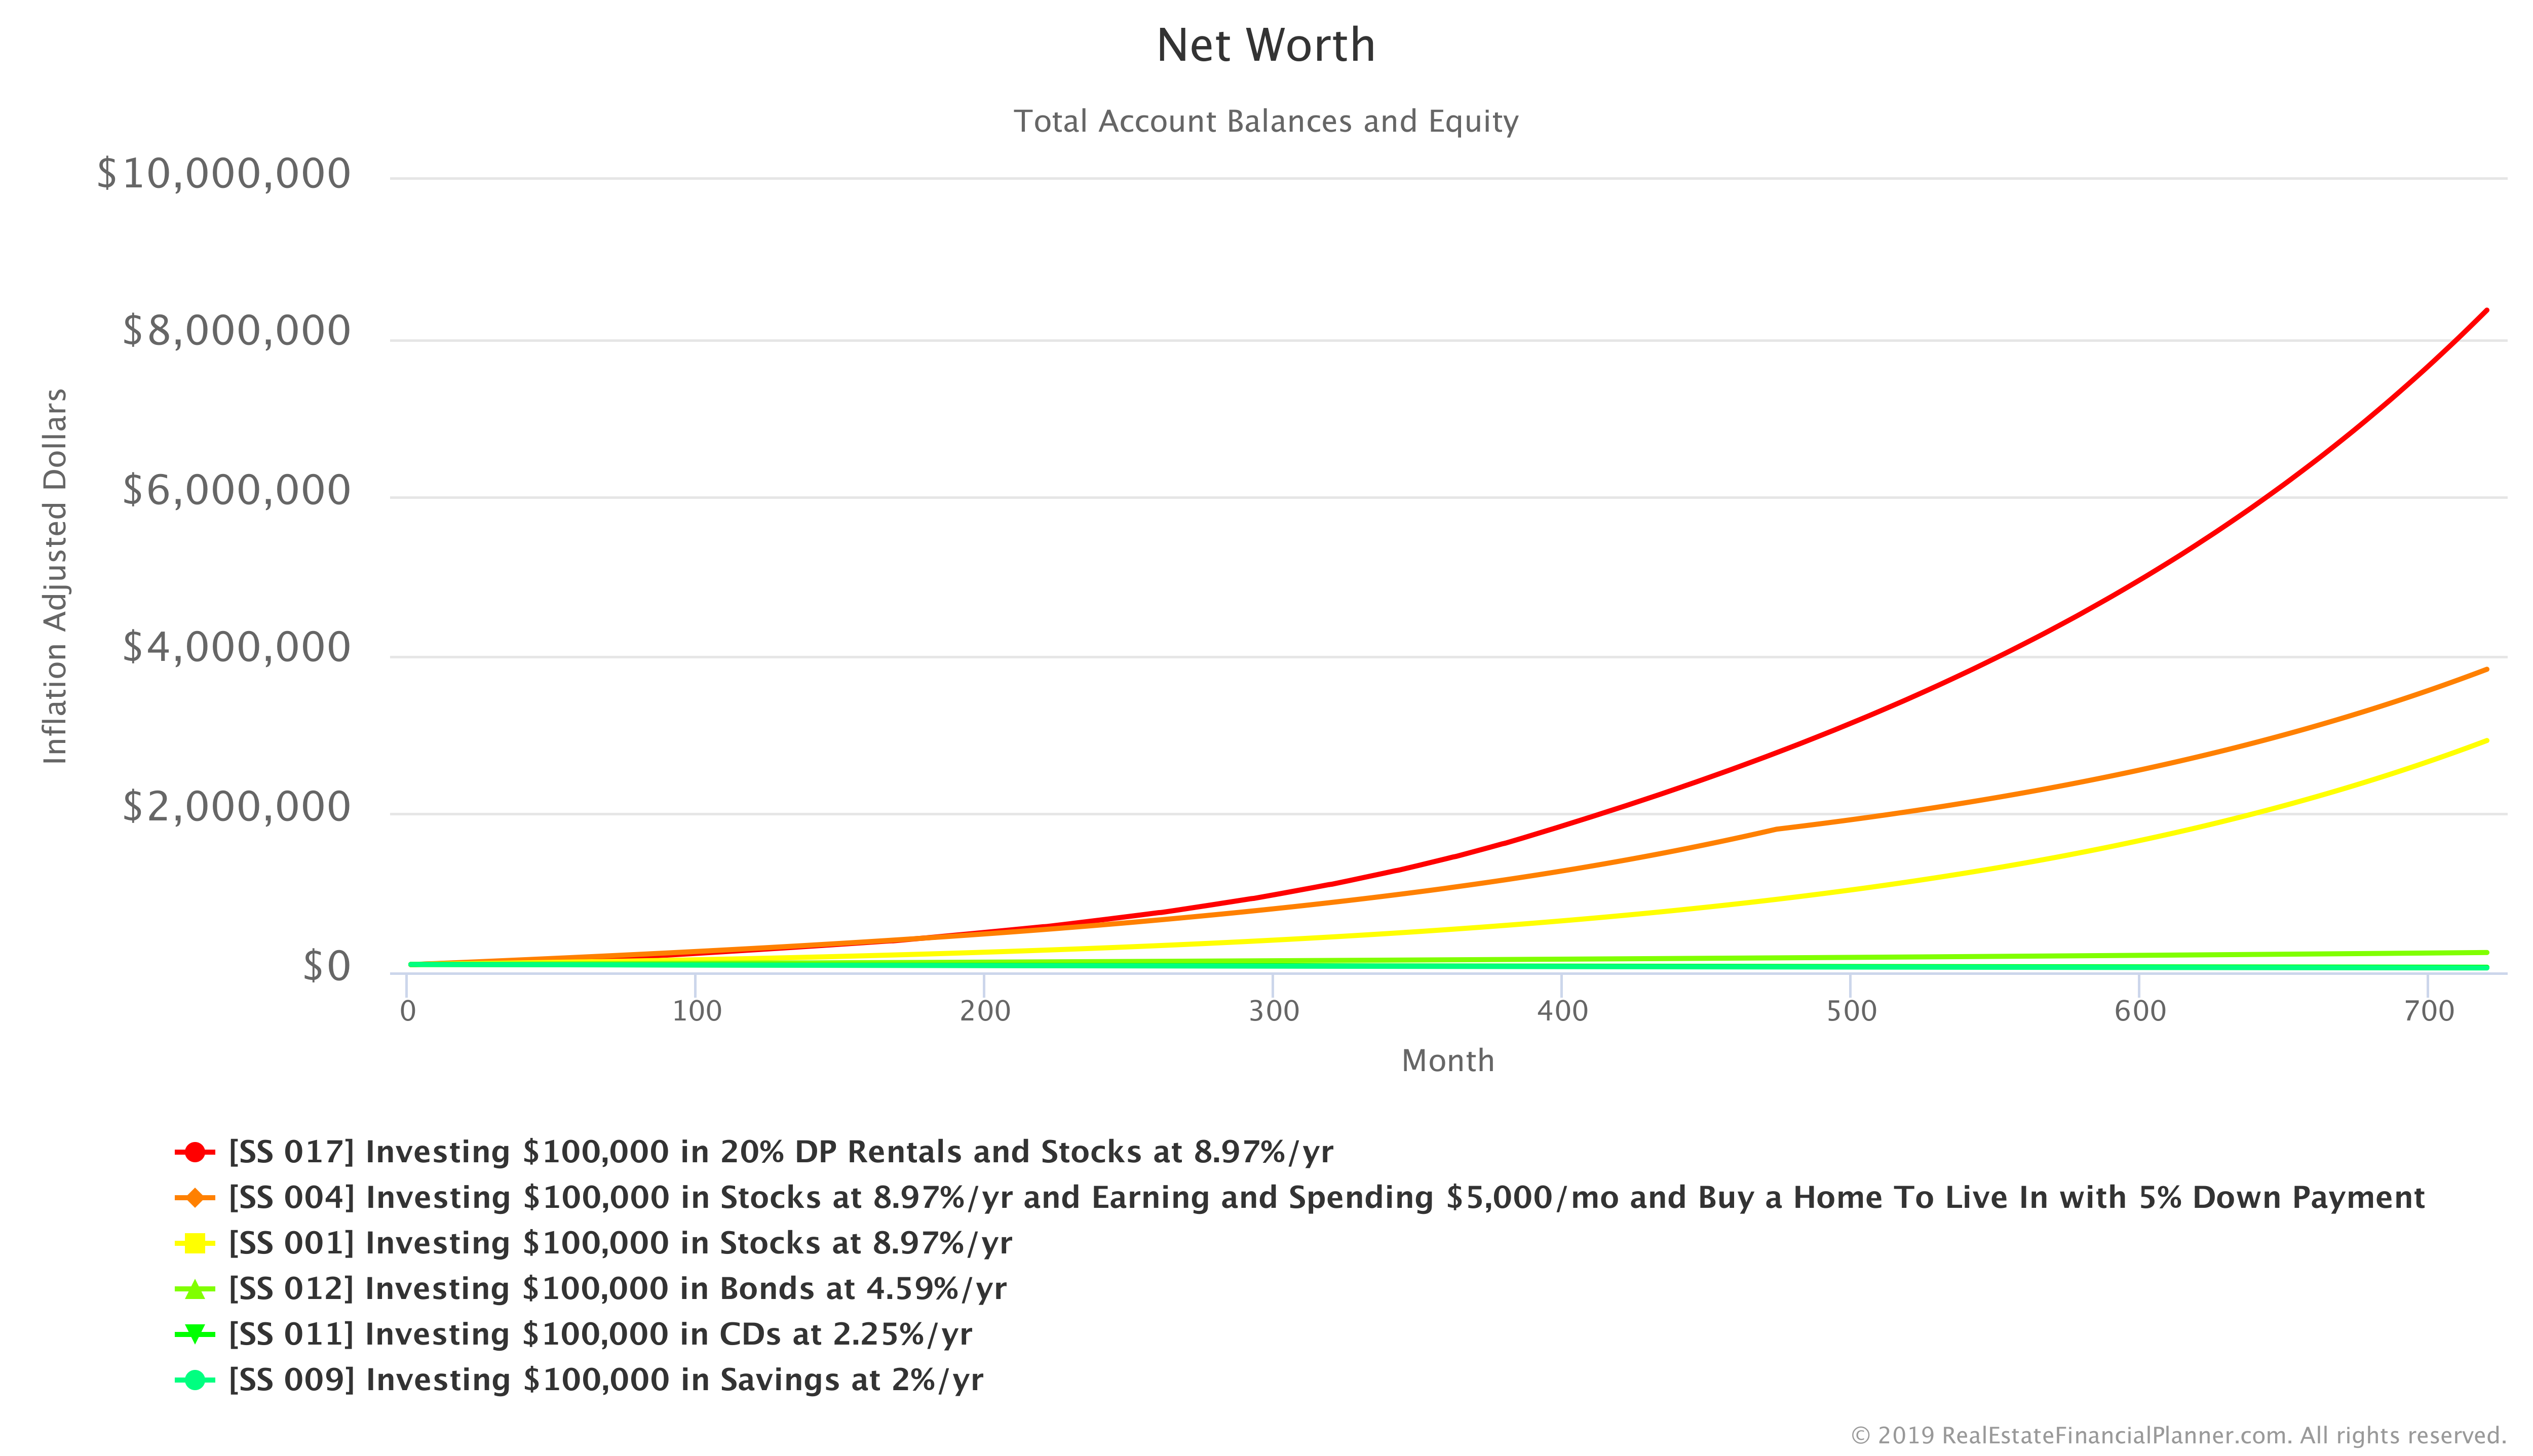
And, here’s the inflation-adjusted comparison of just year 60 so that it is easier to see the relative values in today’s dollars.

Monte Carlo Simulation with Rental Properties
I’ve gone ahead and created a Scenario that has made the following variable:
- Stock market Yearly Rate of Return
- Rental property Appreciation Rate
- Rental propertyStock market Rent Appreciation Rate
- Rental property Mortgage Interest Rate
With those variable, I ran the Scenario again.
Here’s how Net Worth changed compared to using static assumptions for the buying 20% down payment rentals.
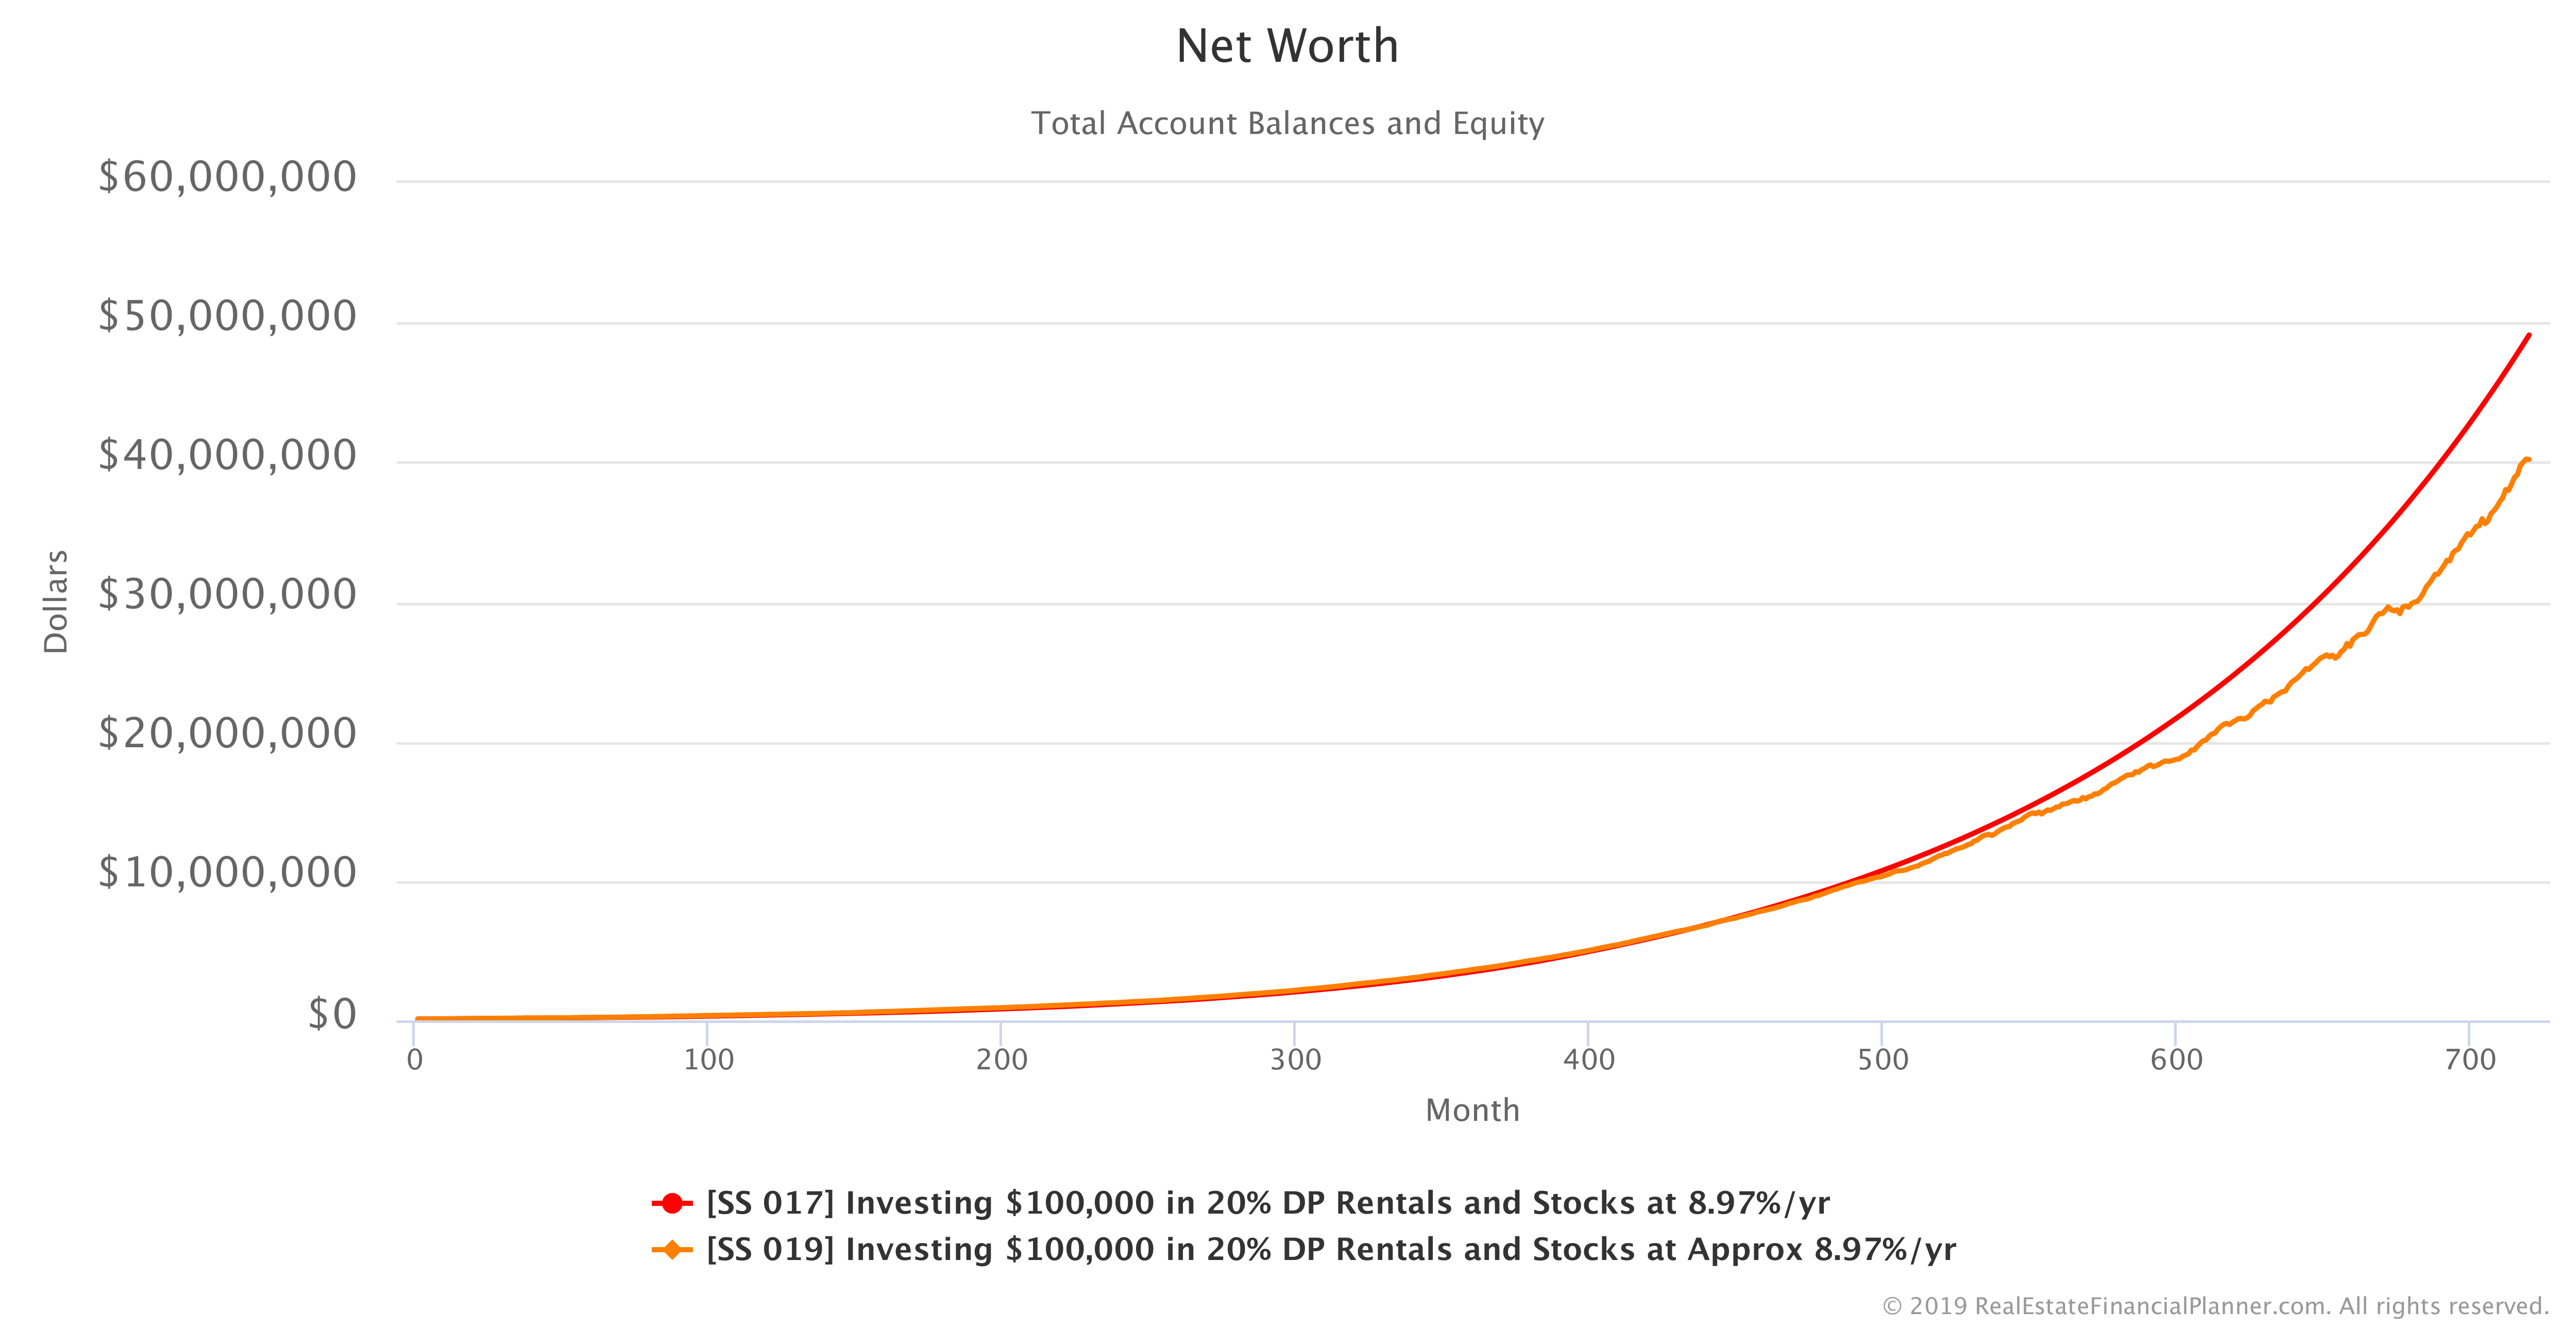
Each time we run this Scenario with variables for stocks, appreciation rates and interest rates we would get slightly different results.
If you want to play with it by changing the assumptions, copy it to your own Planner™, using the button below.
Login to copy this Scenario. New? Register For Free
Scenario into my Real Estate Financial Planner™ Software
SS 019 Investing $100,000 in 20% DP Rentals and Stocks at Approx 8.97%/yr with 2 Accounts, 2 Properties, and 5 Rules.
Or, read the detailed, computer-generated, narrated Blueprint™
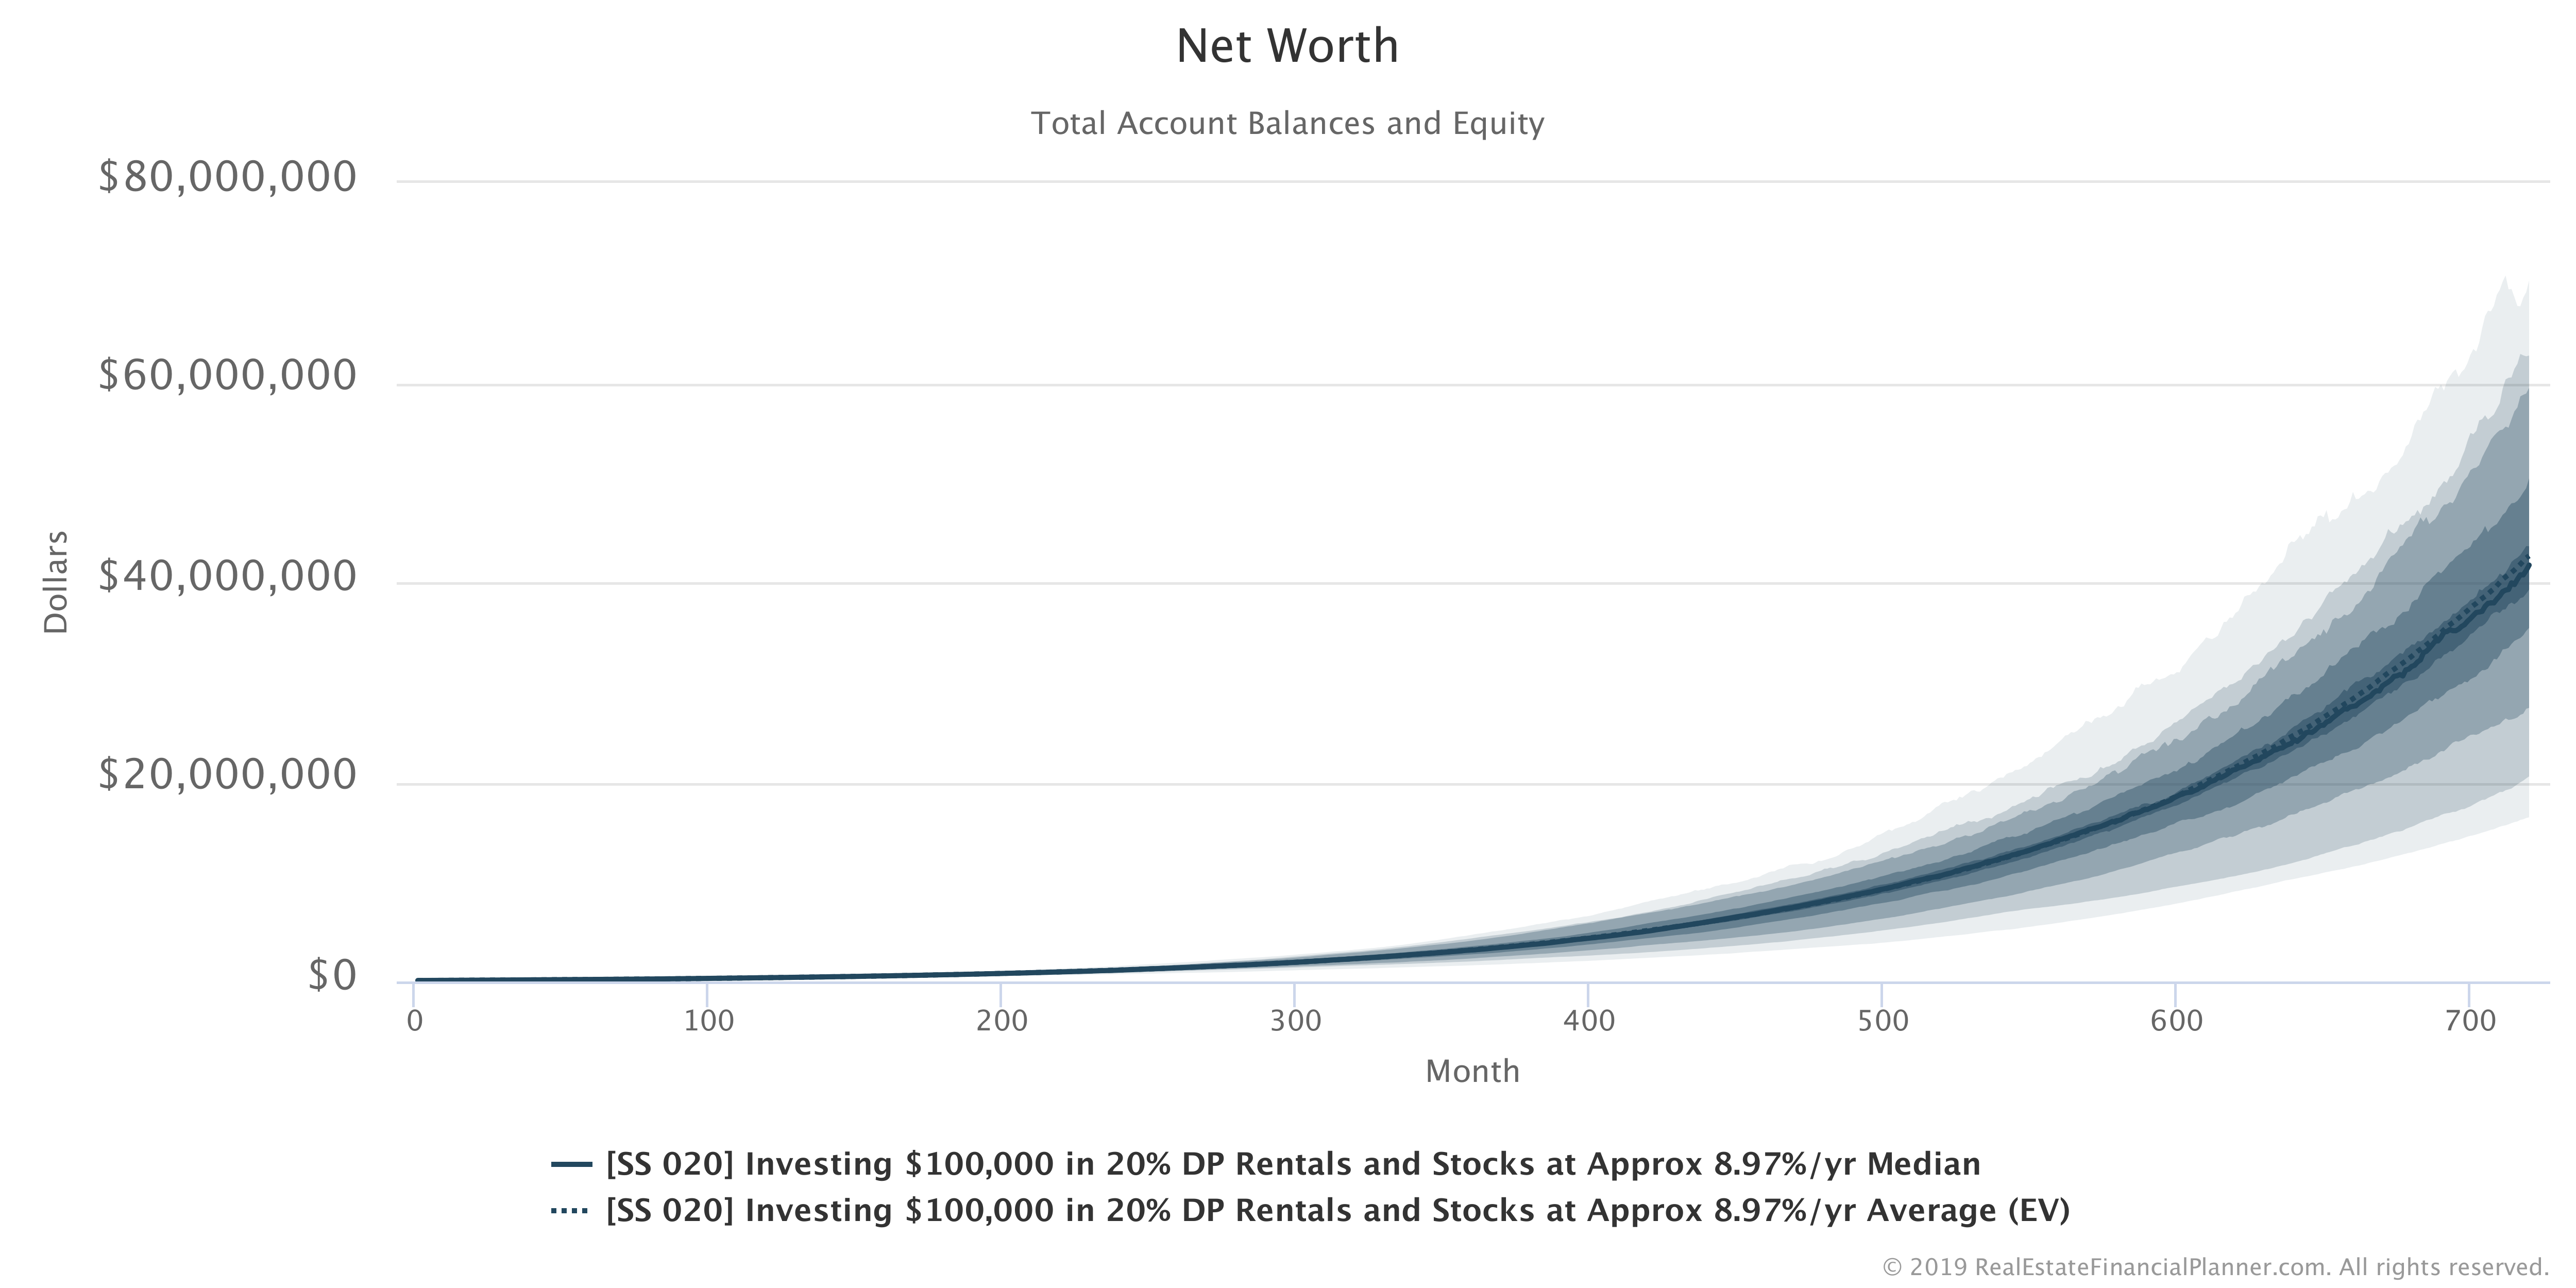
If I were to invest $100K in the real world, I’d want to know the range of returns I might expect by running the Scenario a number of times and see what the more and less desirable results look like.
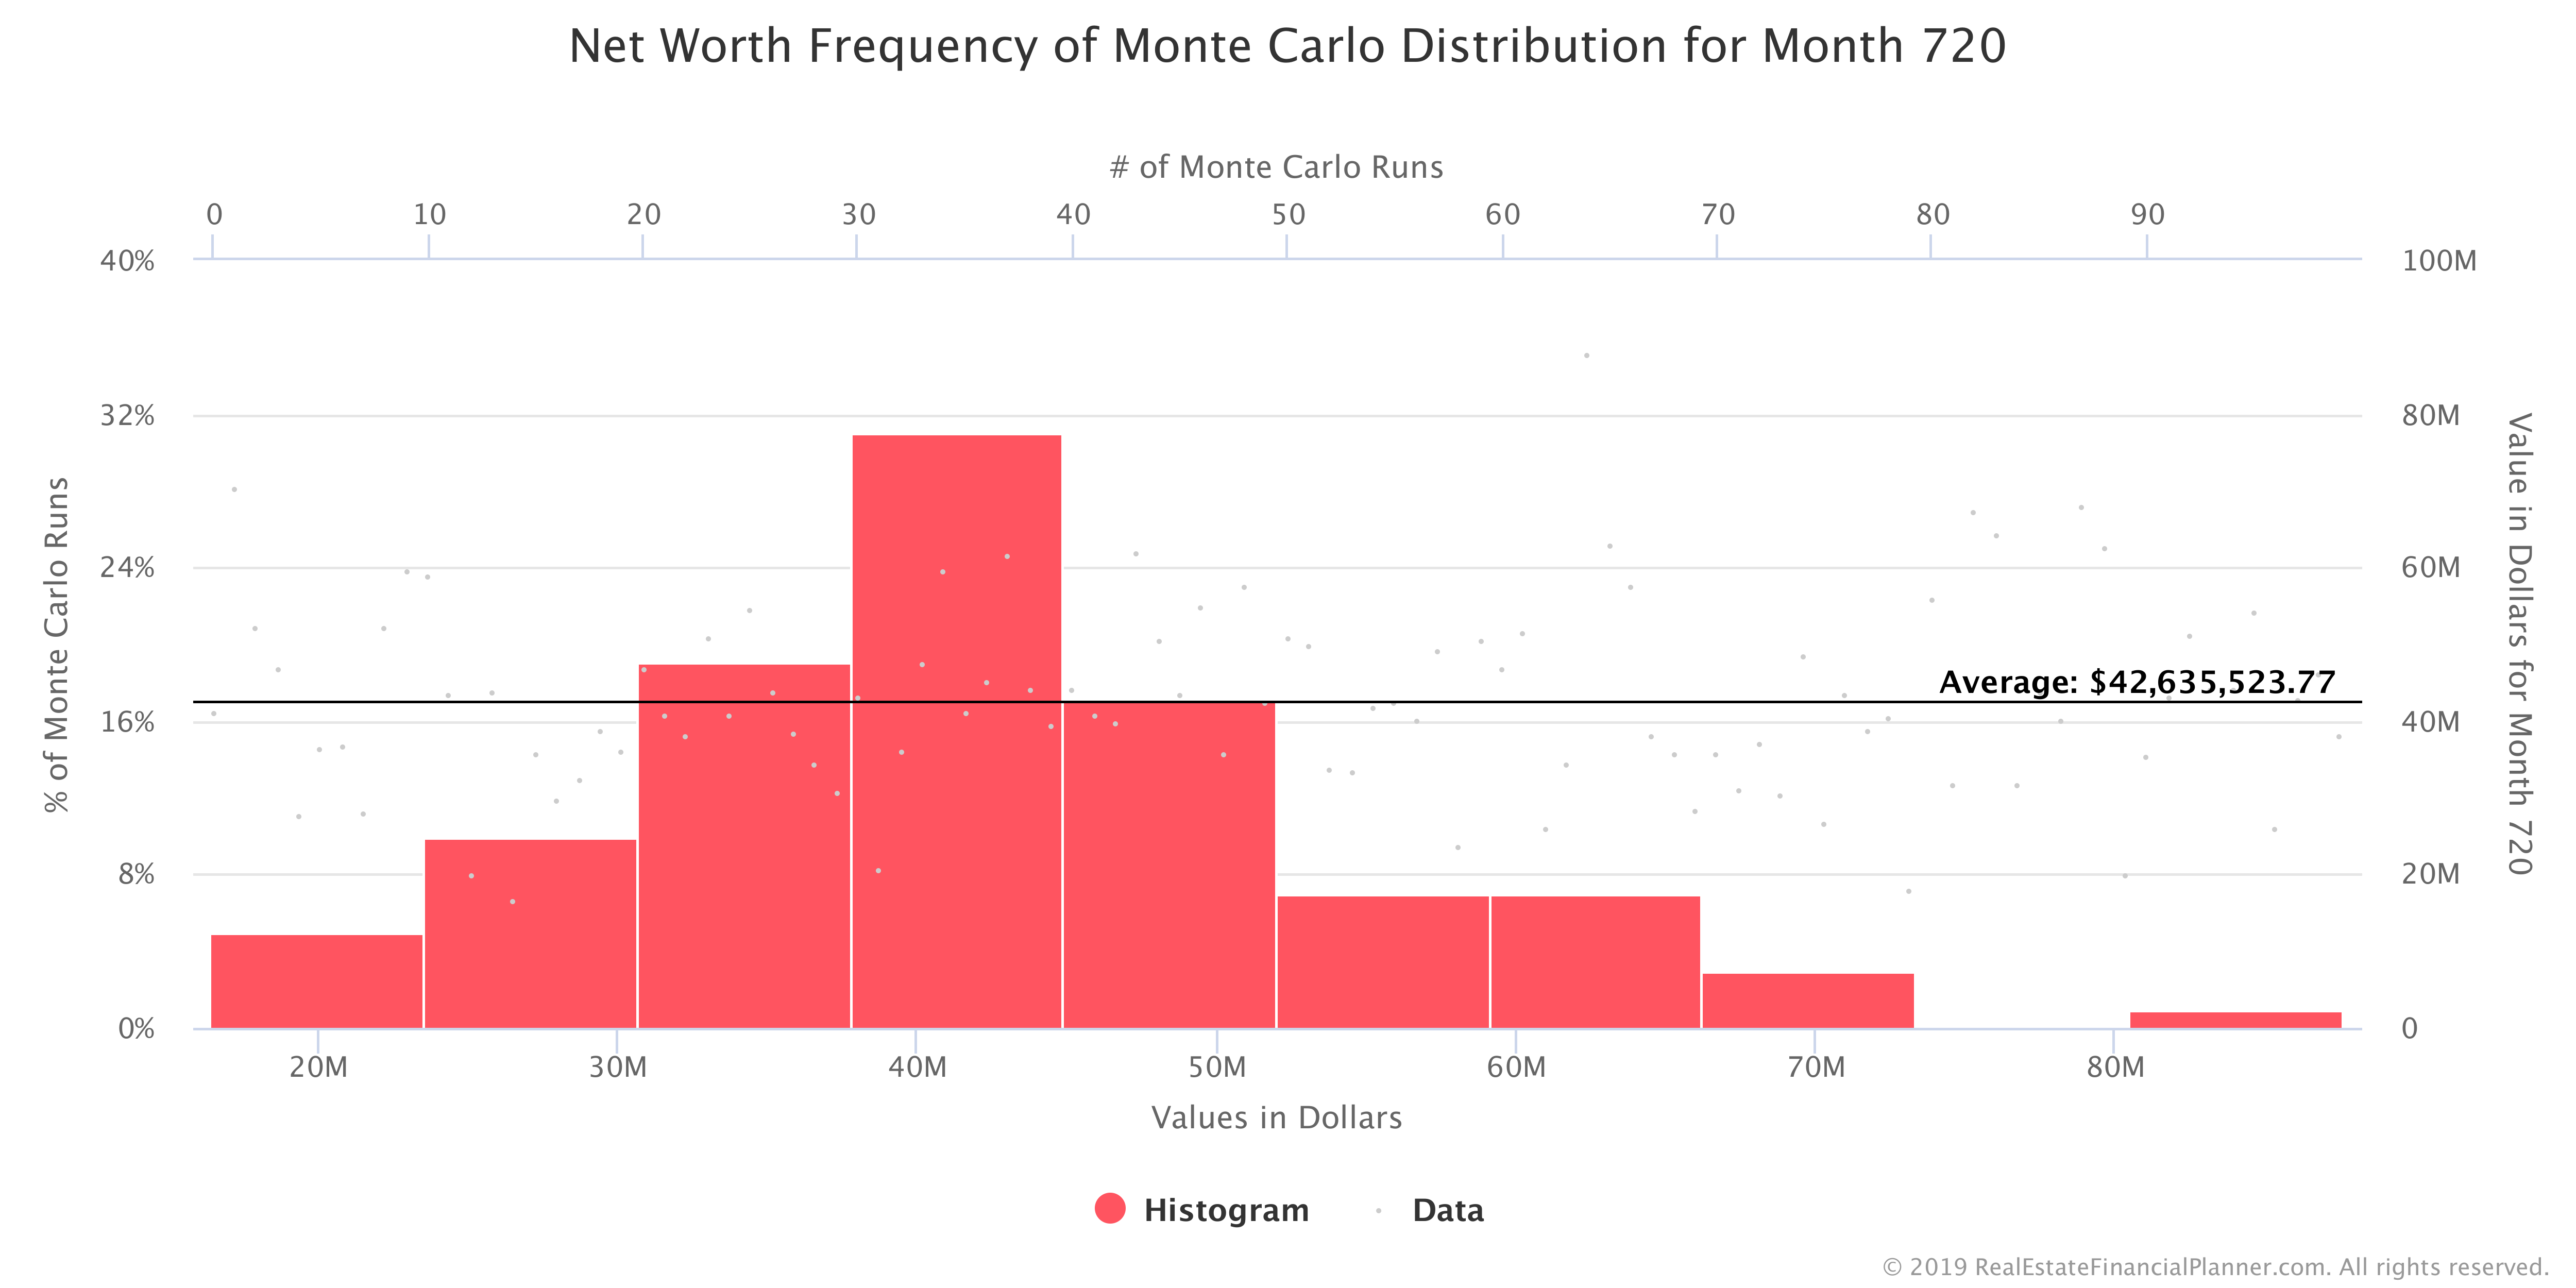
While it is waaaayyyyy beyond the scope of this article, if we ran the Scenario 100 times as part of a  Monte Carlo simulation, we could then evaluate the range of the results and compare that range of results from this strategy versus another, completely different, strategy.
Here’s a Chart showing the Net Worth range of running this Scenario 100 times using the Monte Carlo features of the Real Estate Financial Planner™ software.
And here is the distribution of values in year 60.
If you want to copy the Monte Carlo version to your Planner™, use the button below.
Login to copy this Scenario. New? Register For Free
Scenario into my Real Estate Financial Planner™ Software
SS 020 Investing $100,000 in 20% DP Rentals and Stocks at Approx 8.97%/yr
Investing $100K Buying 25% Down Payment Rental Properties
Previously, we modeled buying ten 20% down payment rental properties with the $100K. But, buying rental properties with 25% down payment will typically give us a better interest rate on our mortgage.
A better interest and borrowing a small amount of money will increase our cash flow. Is it better to put 20% down or 25% down?
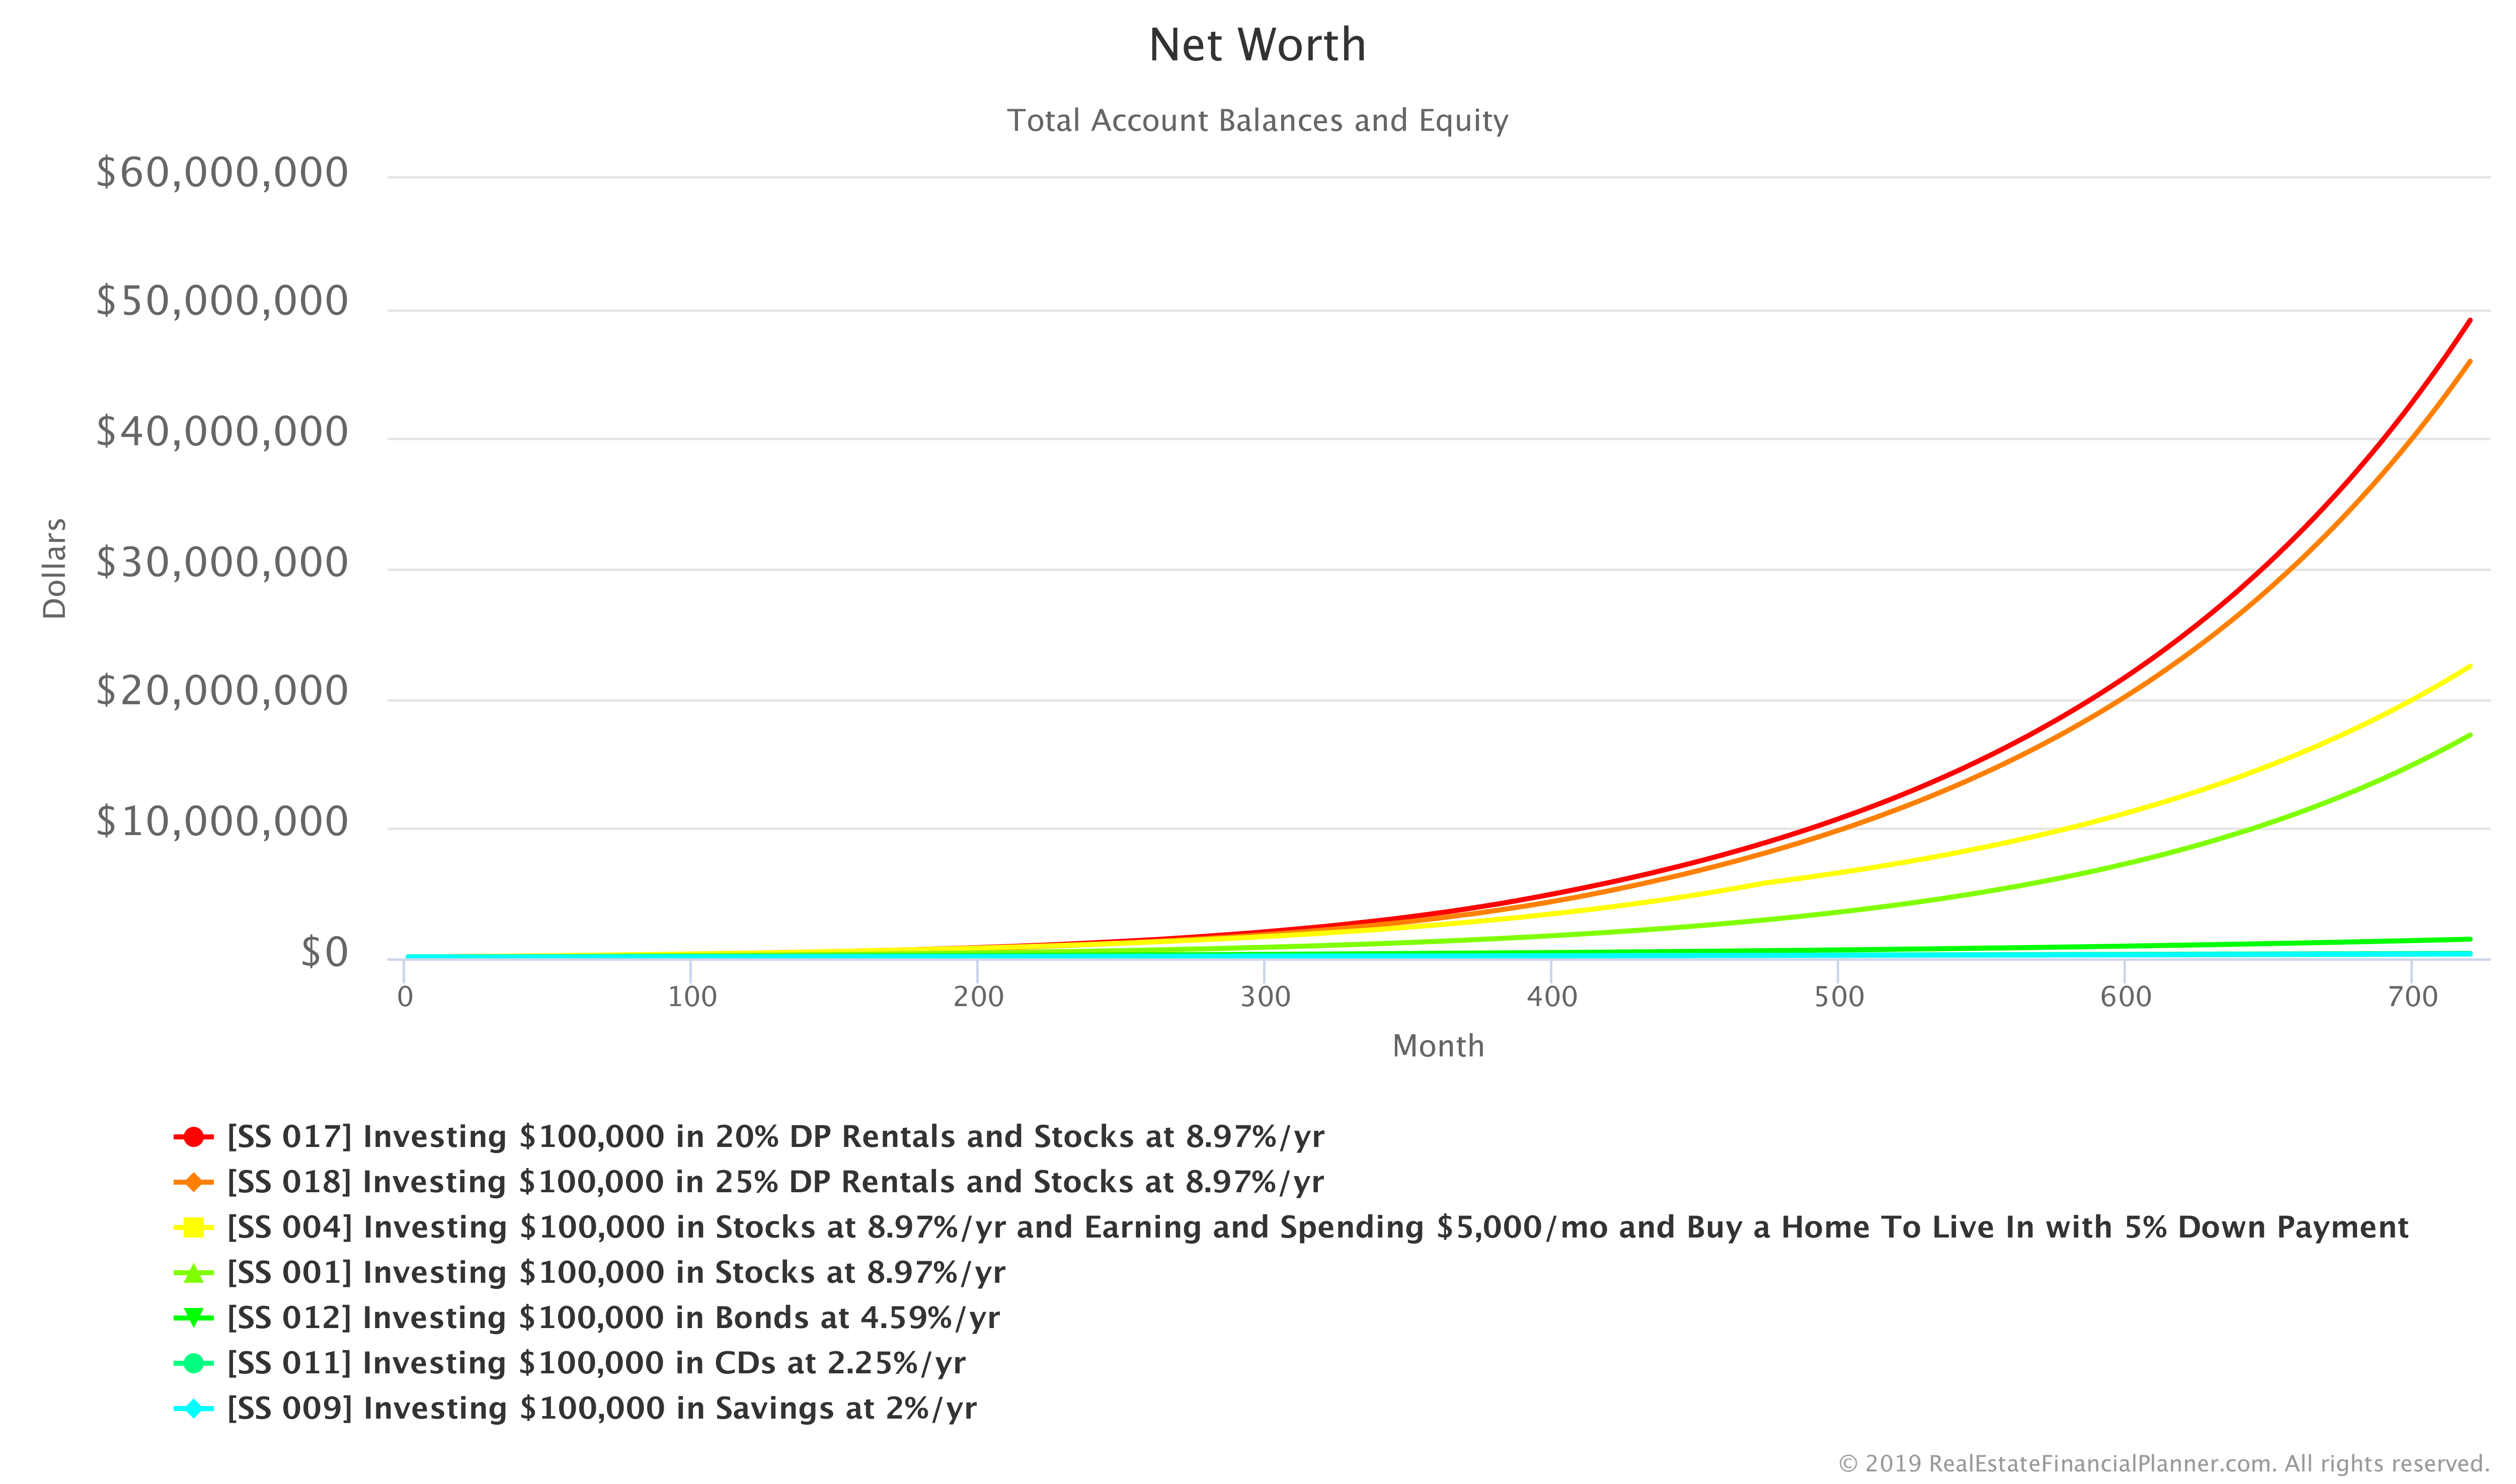
The following Chart shows the Net Worth of buying ten rental properties with 25% down payment on each just like we did with the 20% down payments.

How does this compare to our other possible investing opportunities with the same $100K? The Chart below shows the comparison between all of our options to this point.
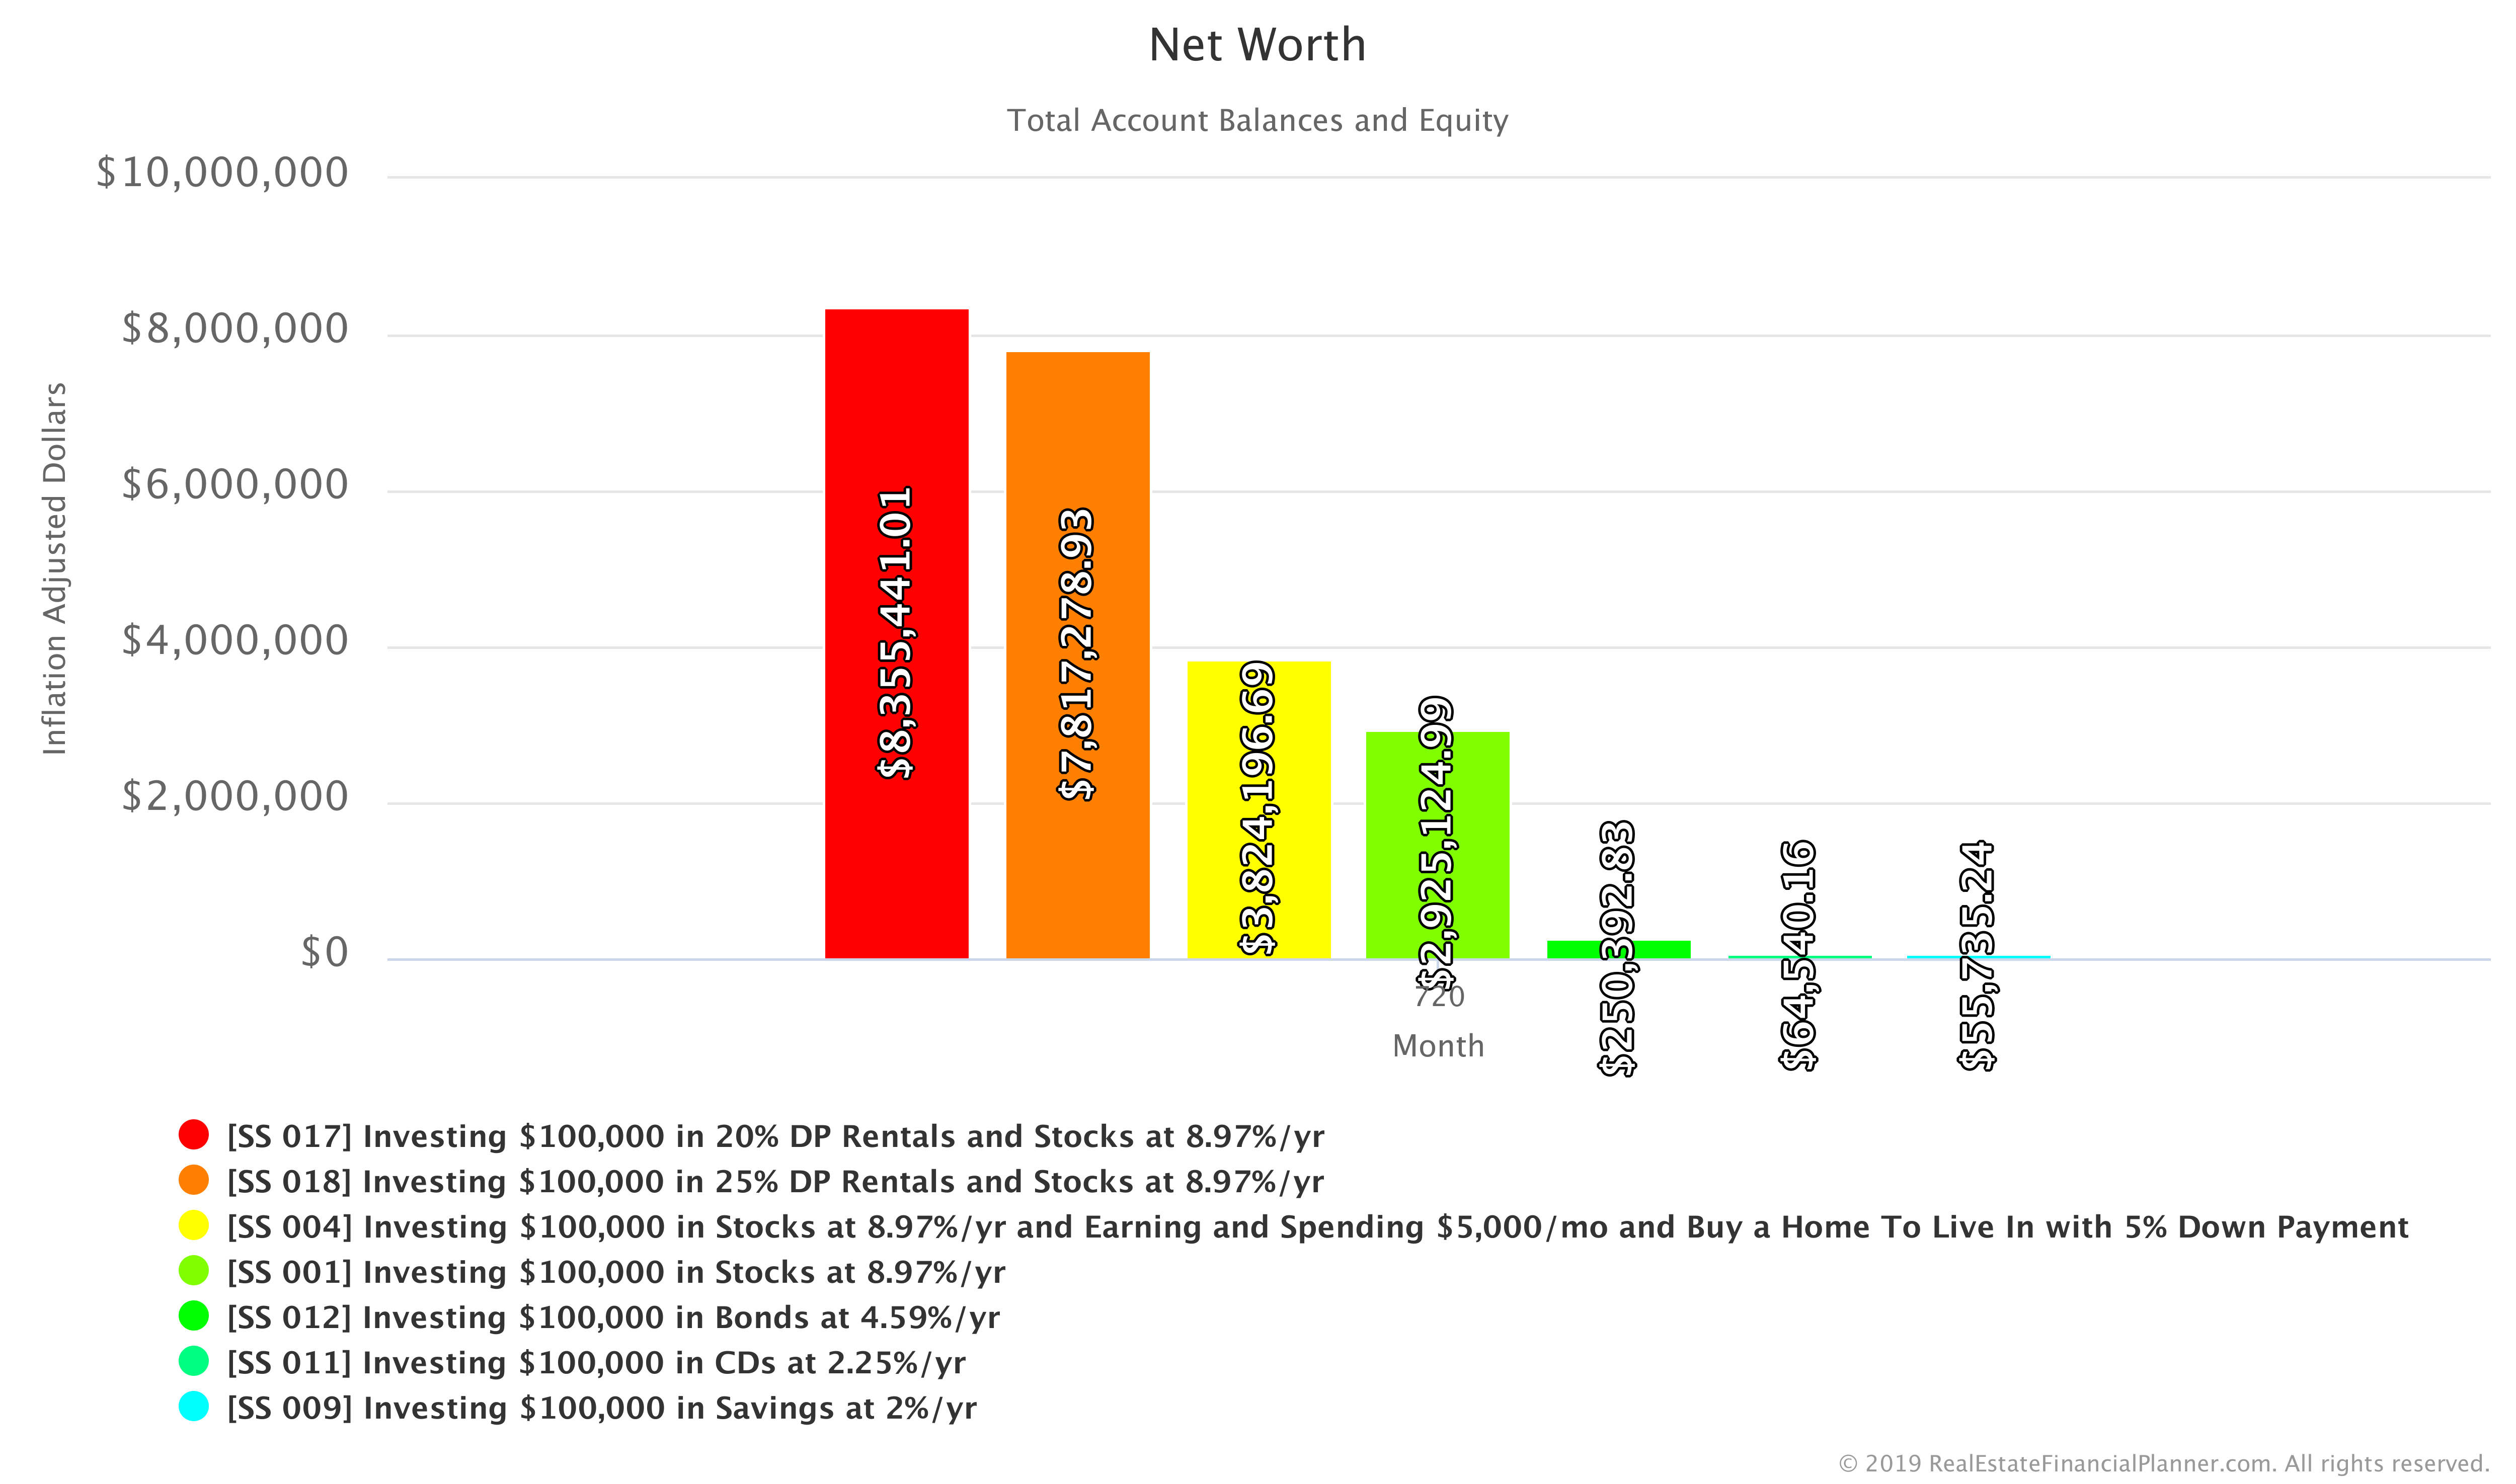
And, since it might be harder to see what is happening at the end of the Chart in year 60, the Chart below shows just year 60 Net Worth numbers for each option.

Looks like our Net Worth would be higher with less down payment.
If we adjust for inflation, we can see the same comparison in today’s dollars in the Chart below.
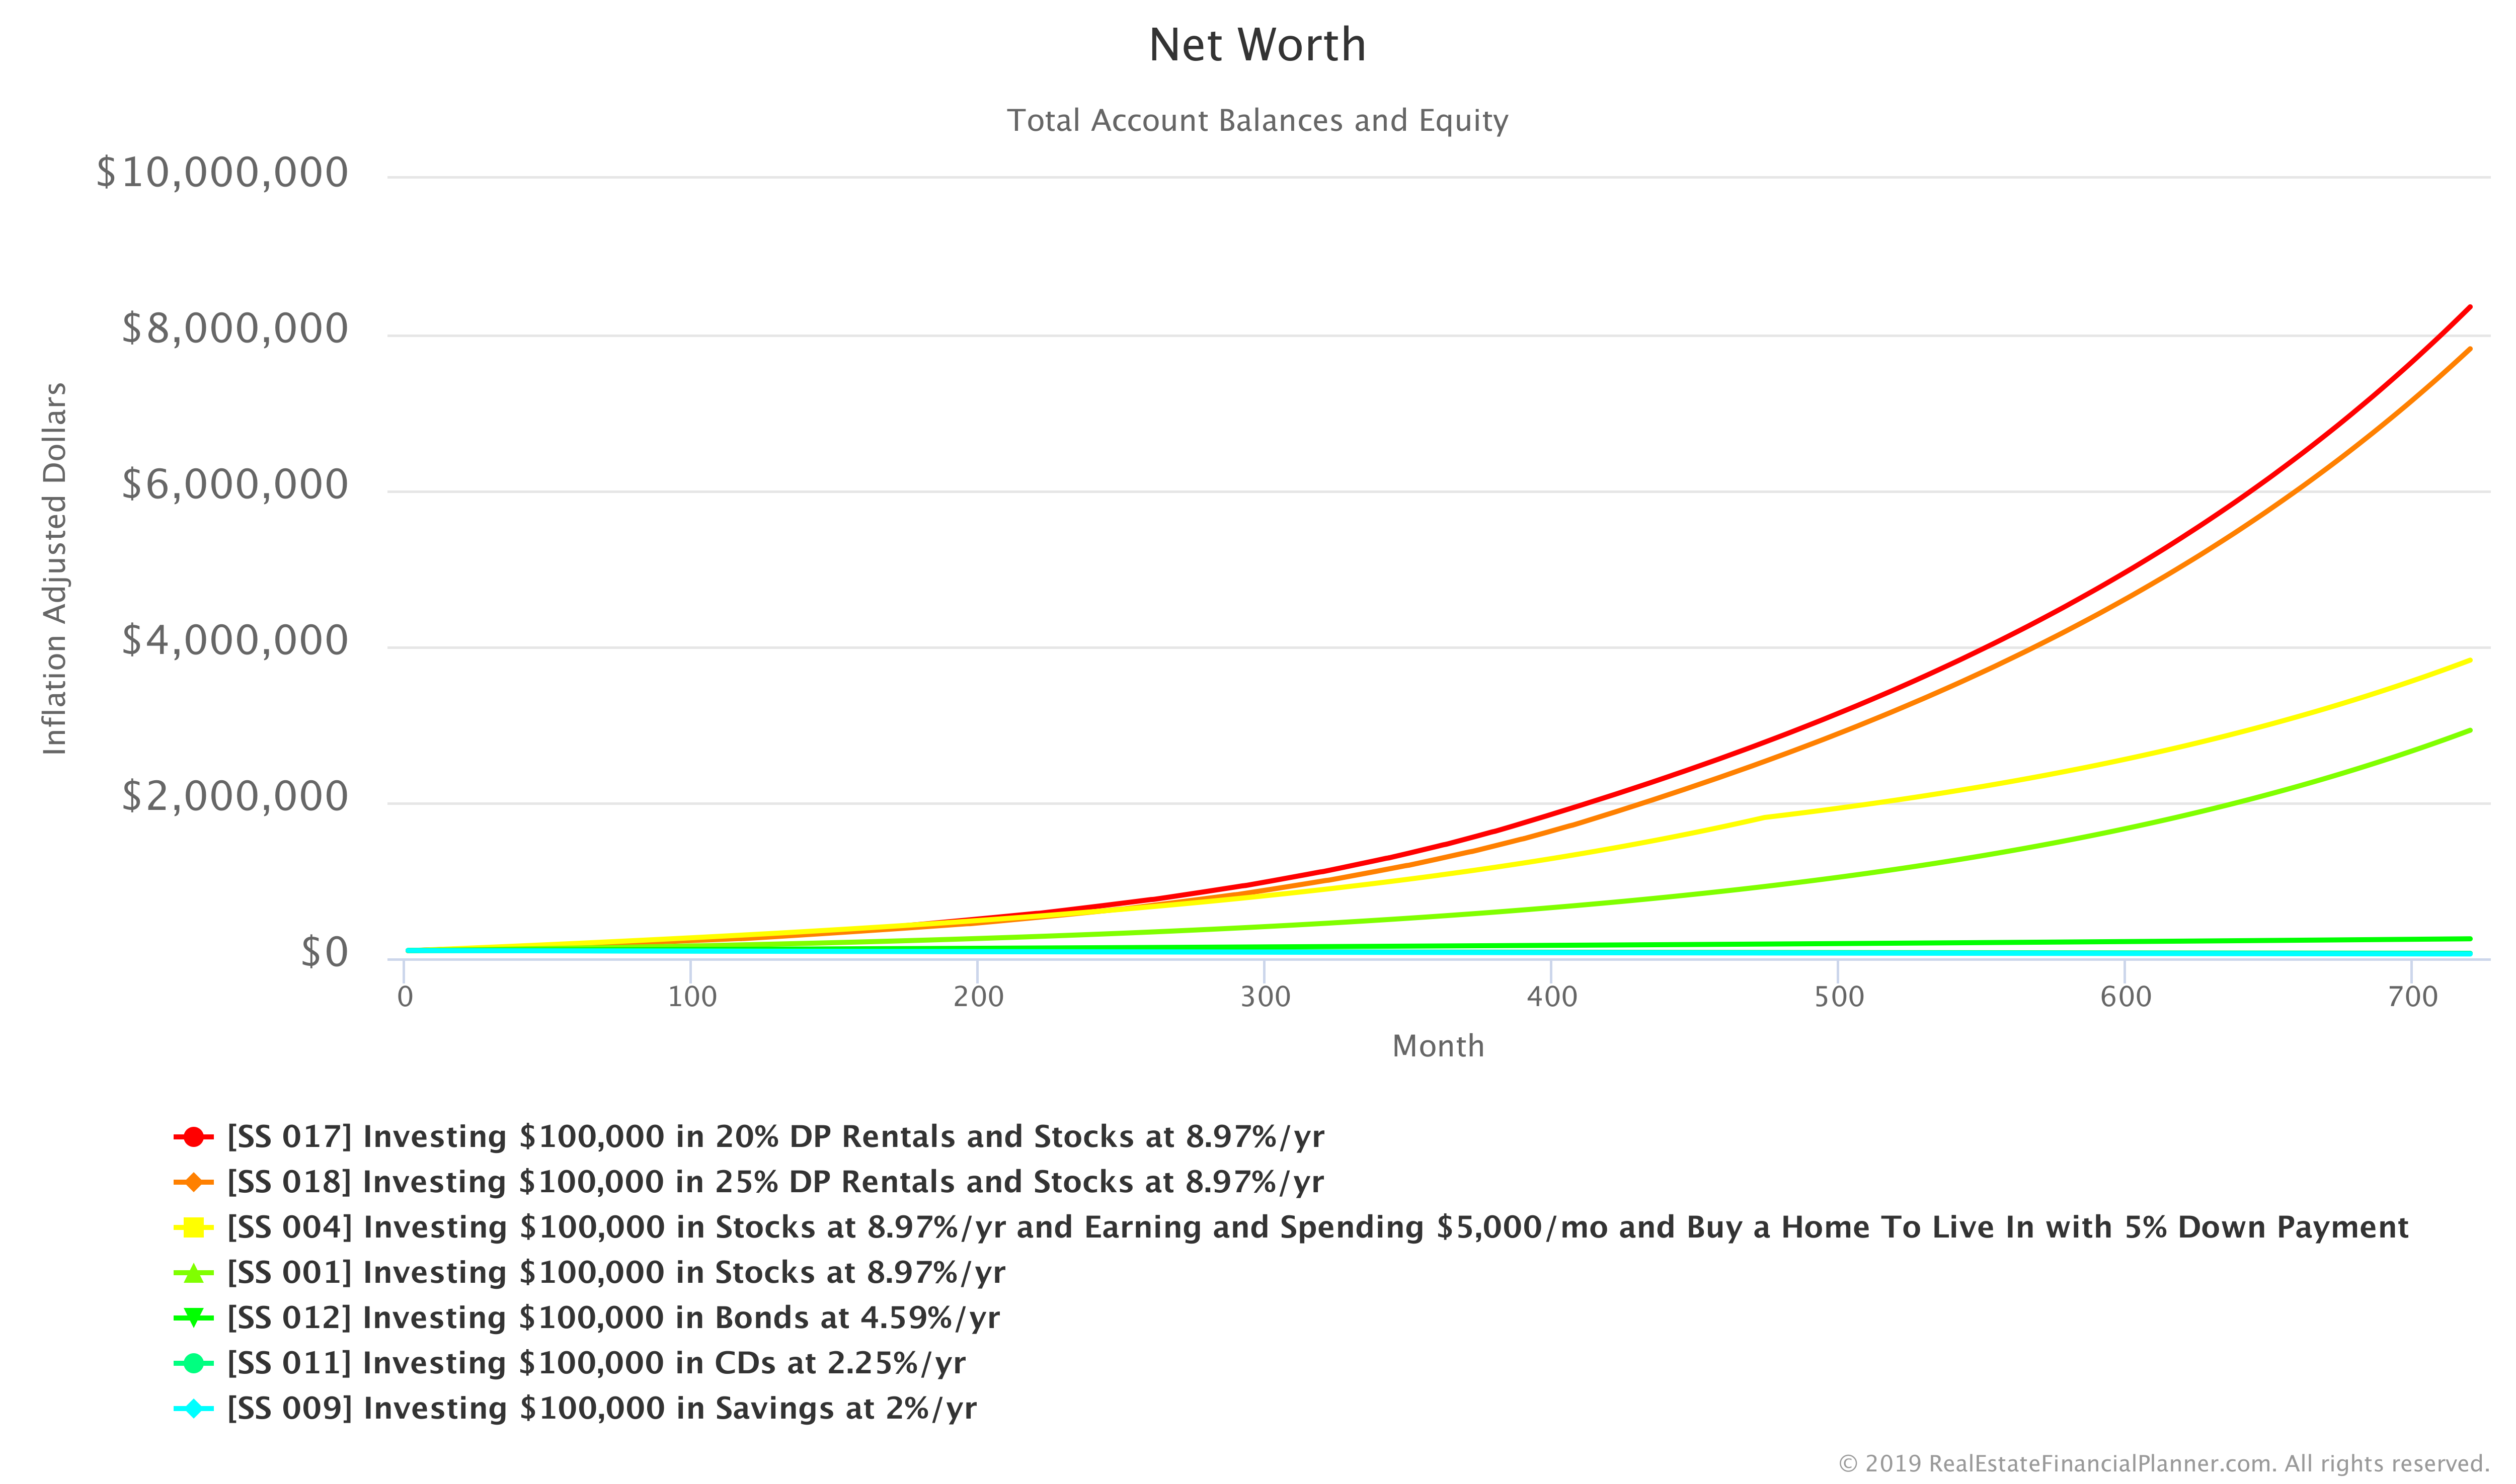
And, here’s the inflation-adjusted version of the same Net Worth comparison for year 60.
If you want to copy the 25% down payment Scenario to your Planner™, use the button below.
Login to copy this Scenario. New? Register For Free
Scenario into my Real Estate Financial Planner™ Software
SS 018 Investing $100,000 in 25% DP Rentals and Stocks at 8.97%/yr with 2 Accounts, 1 Property, and 1 Rule.
Or, read the detailed, computer-generated, narrated Blueprint™
Now that we know that putting less down when buying properties seems to be better, can we try a real estate investing strategy that requires lower down payments? That’s what we will go over next.
Investing $100K Buying 5% Down Payment Properties Using the Nomad™ Strategy
The Nomad™ investing strategy has you buy a home as an owner-occupant, move into the property, live there for a year (or more) and then convert the property to a rental when you buy your next property. You can repeat this process buying a new property each year until you have the number of rental properties you desire.
With the Nomad™ strategy you only need a 5% down payment and you get a slightly better interest rate since it is a owner-occupant property (even when considering the cost of private mortgage insurance).
Here’s what your Net Worth looks like if you acquire 10 properties (9 of them as rentals and 1 that you live in) all with 5% down payments. Any extra money from your $100K (and subsequent cash flow) is invested in the stock market at 8.97% per year.
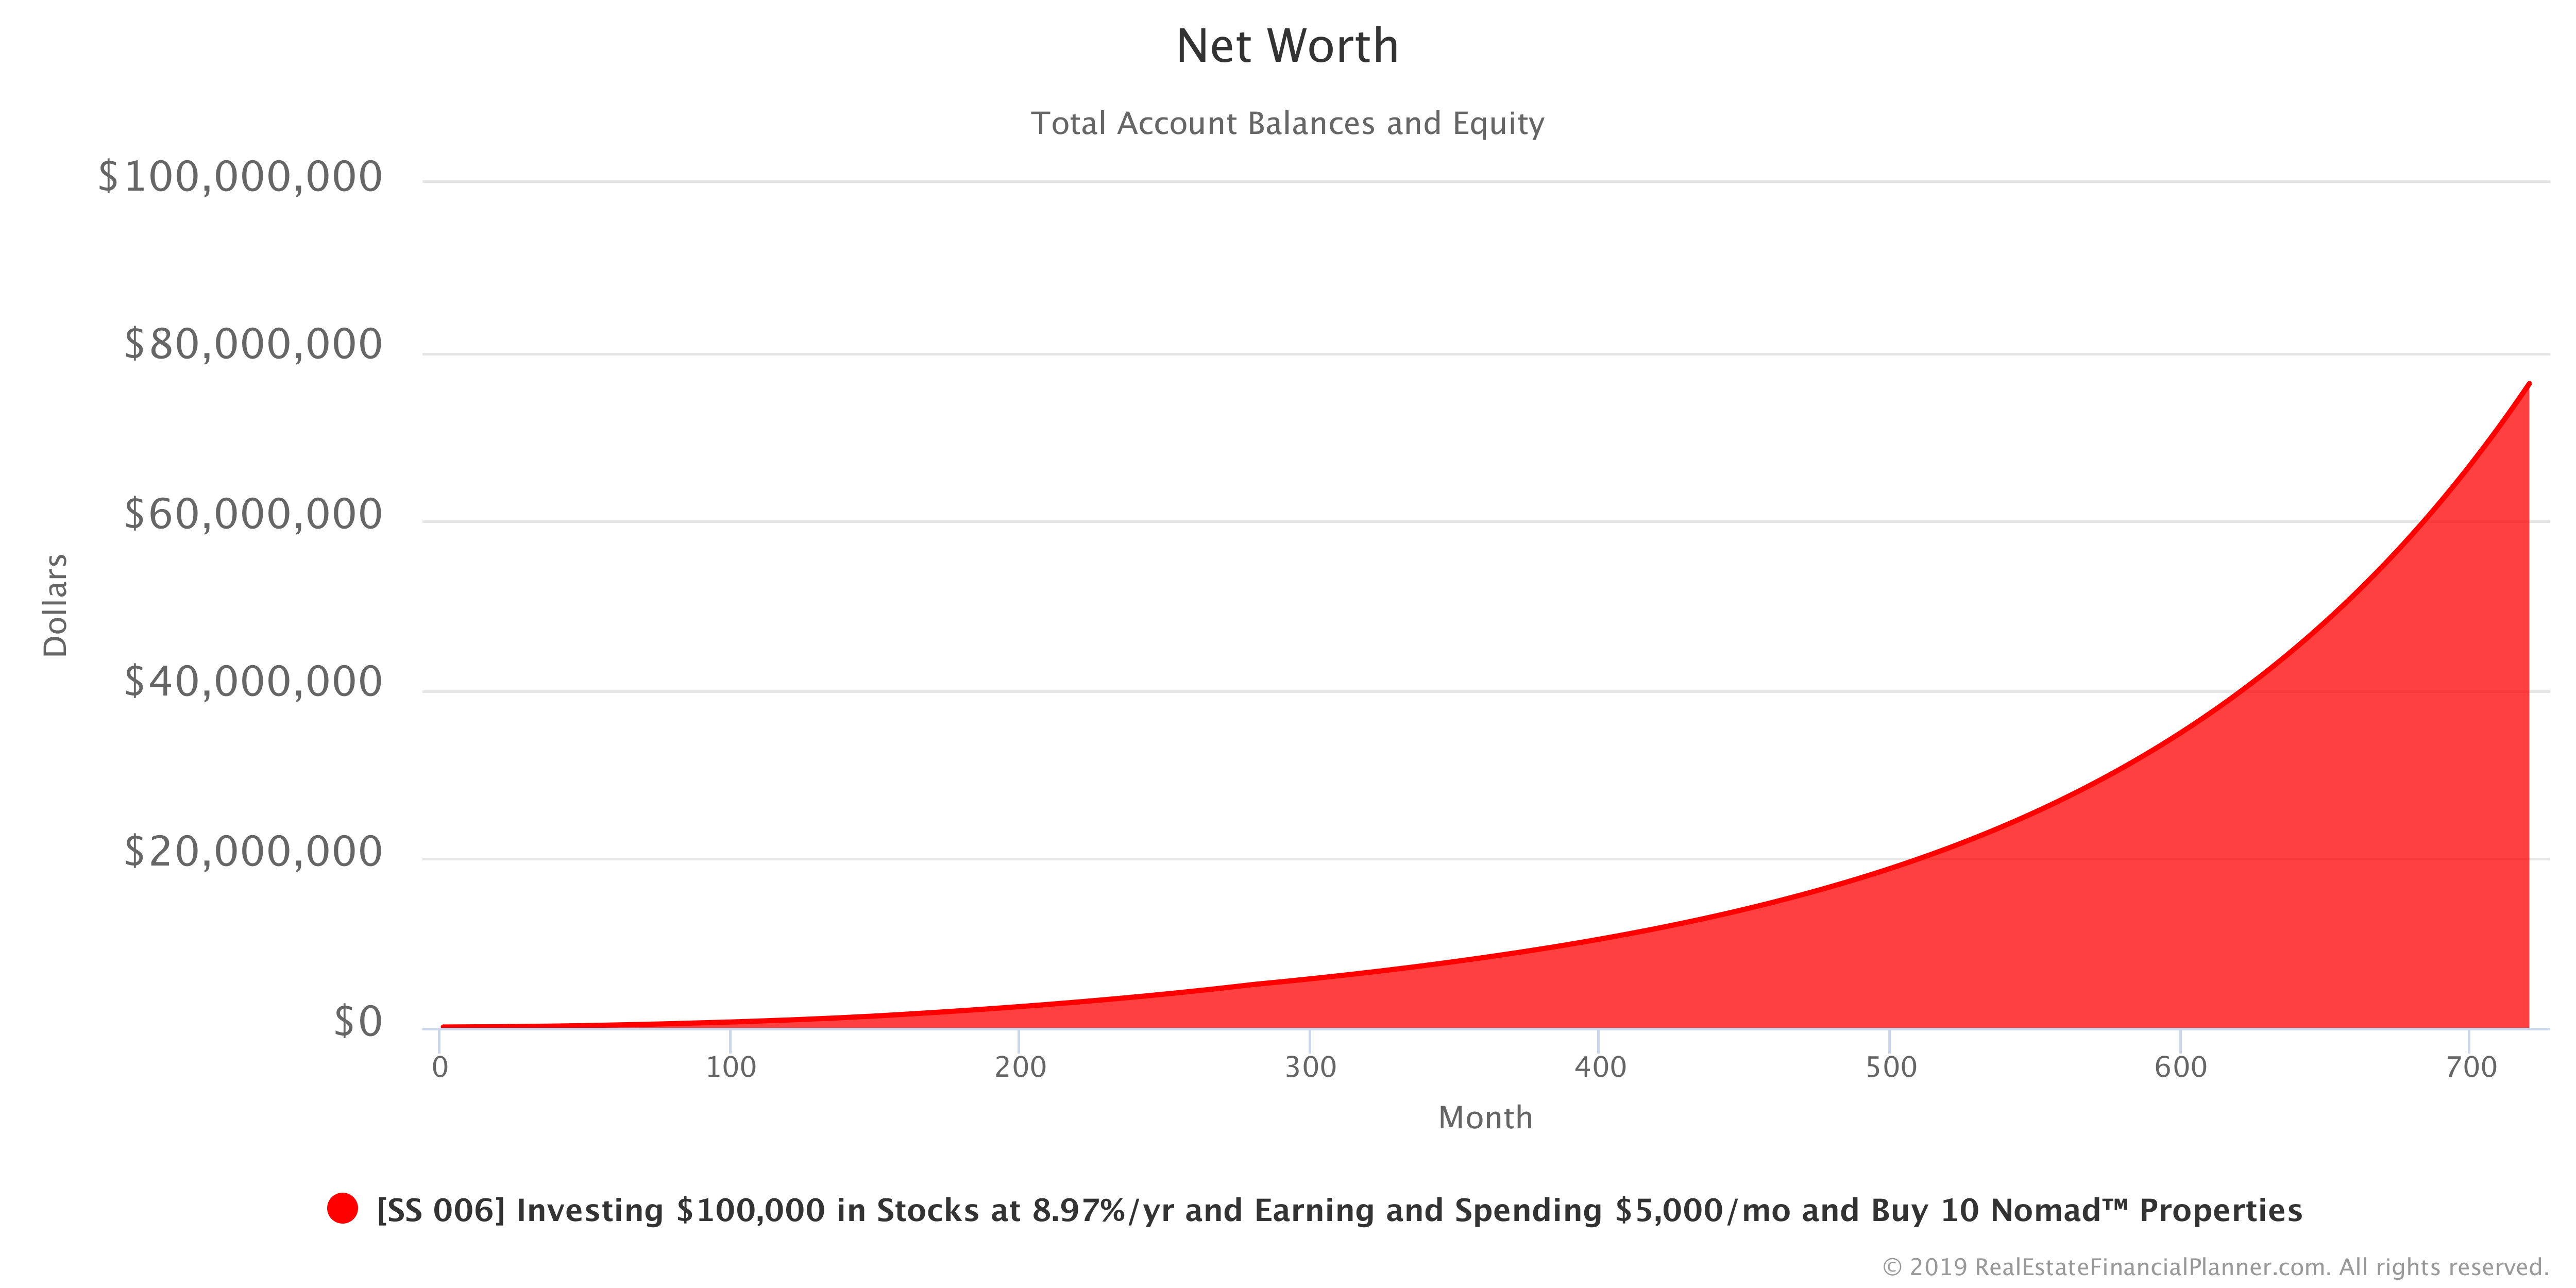
Nice! But, how does it compare to the other $100K investment alternatives we considered? That’s the Chart below.
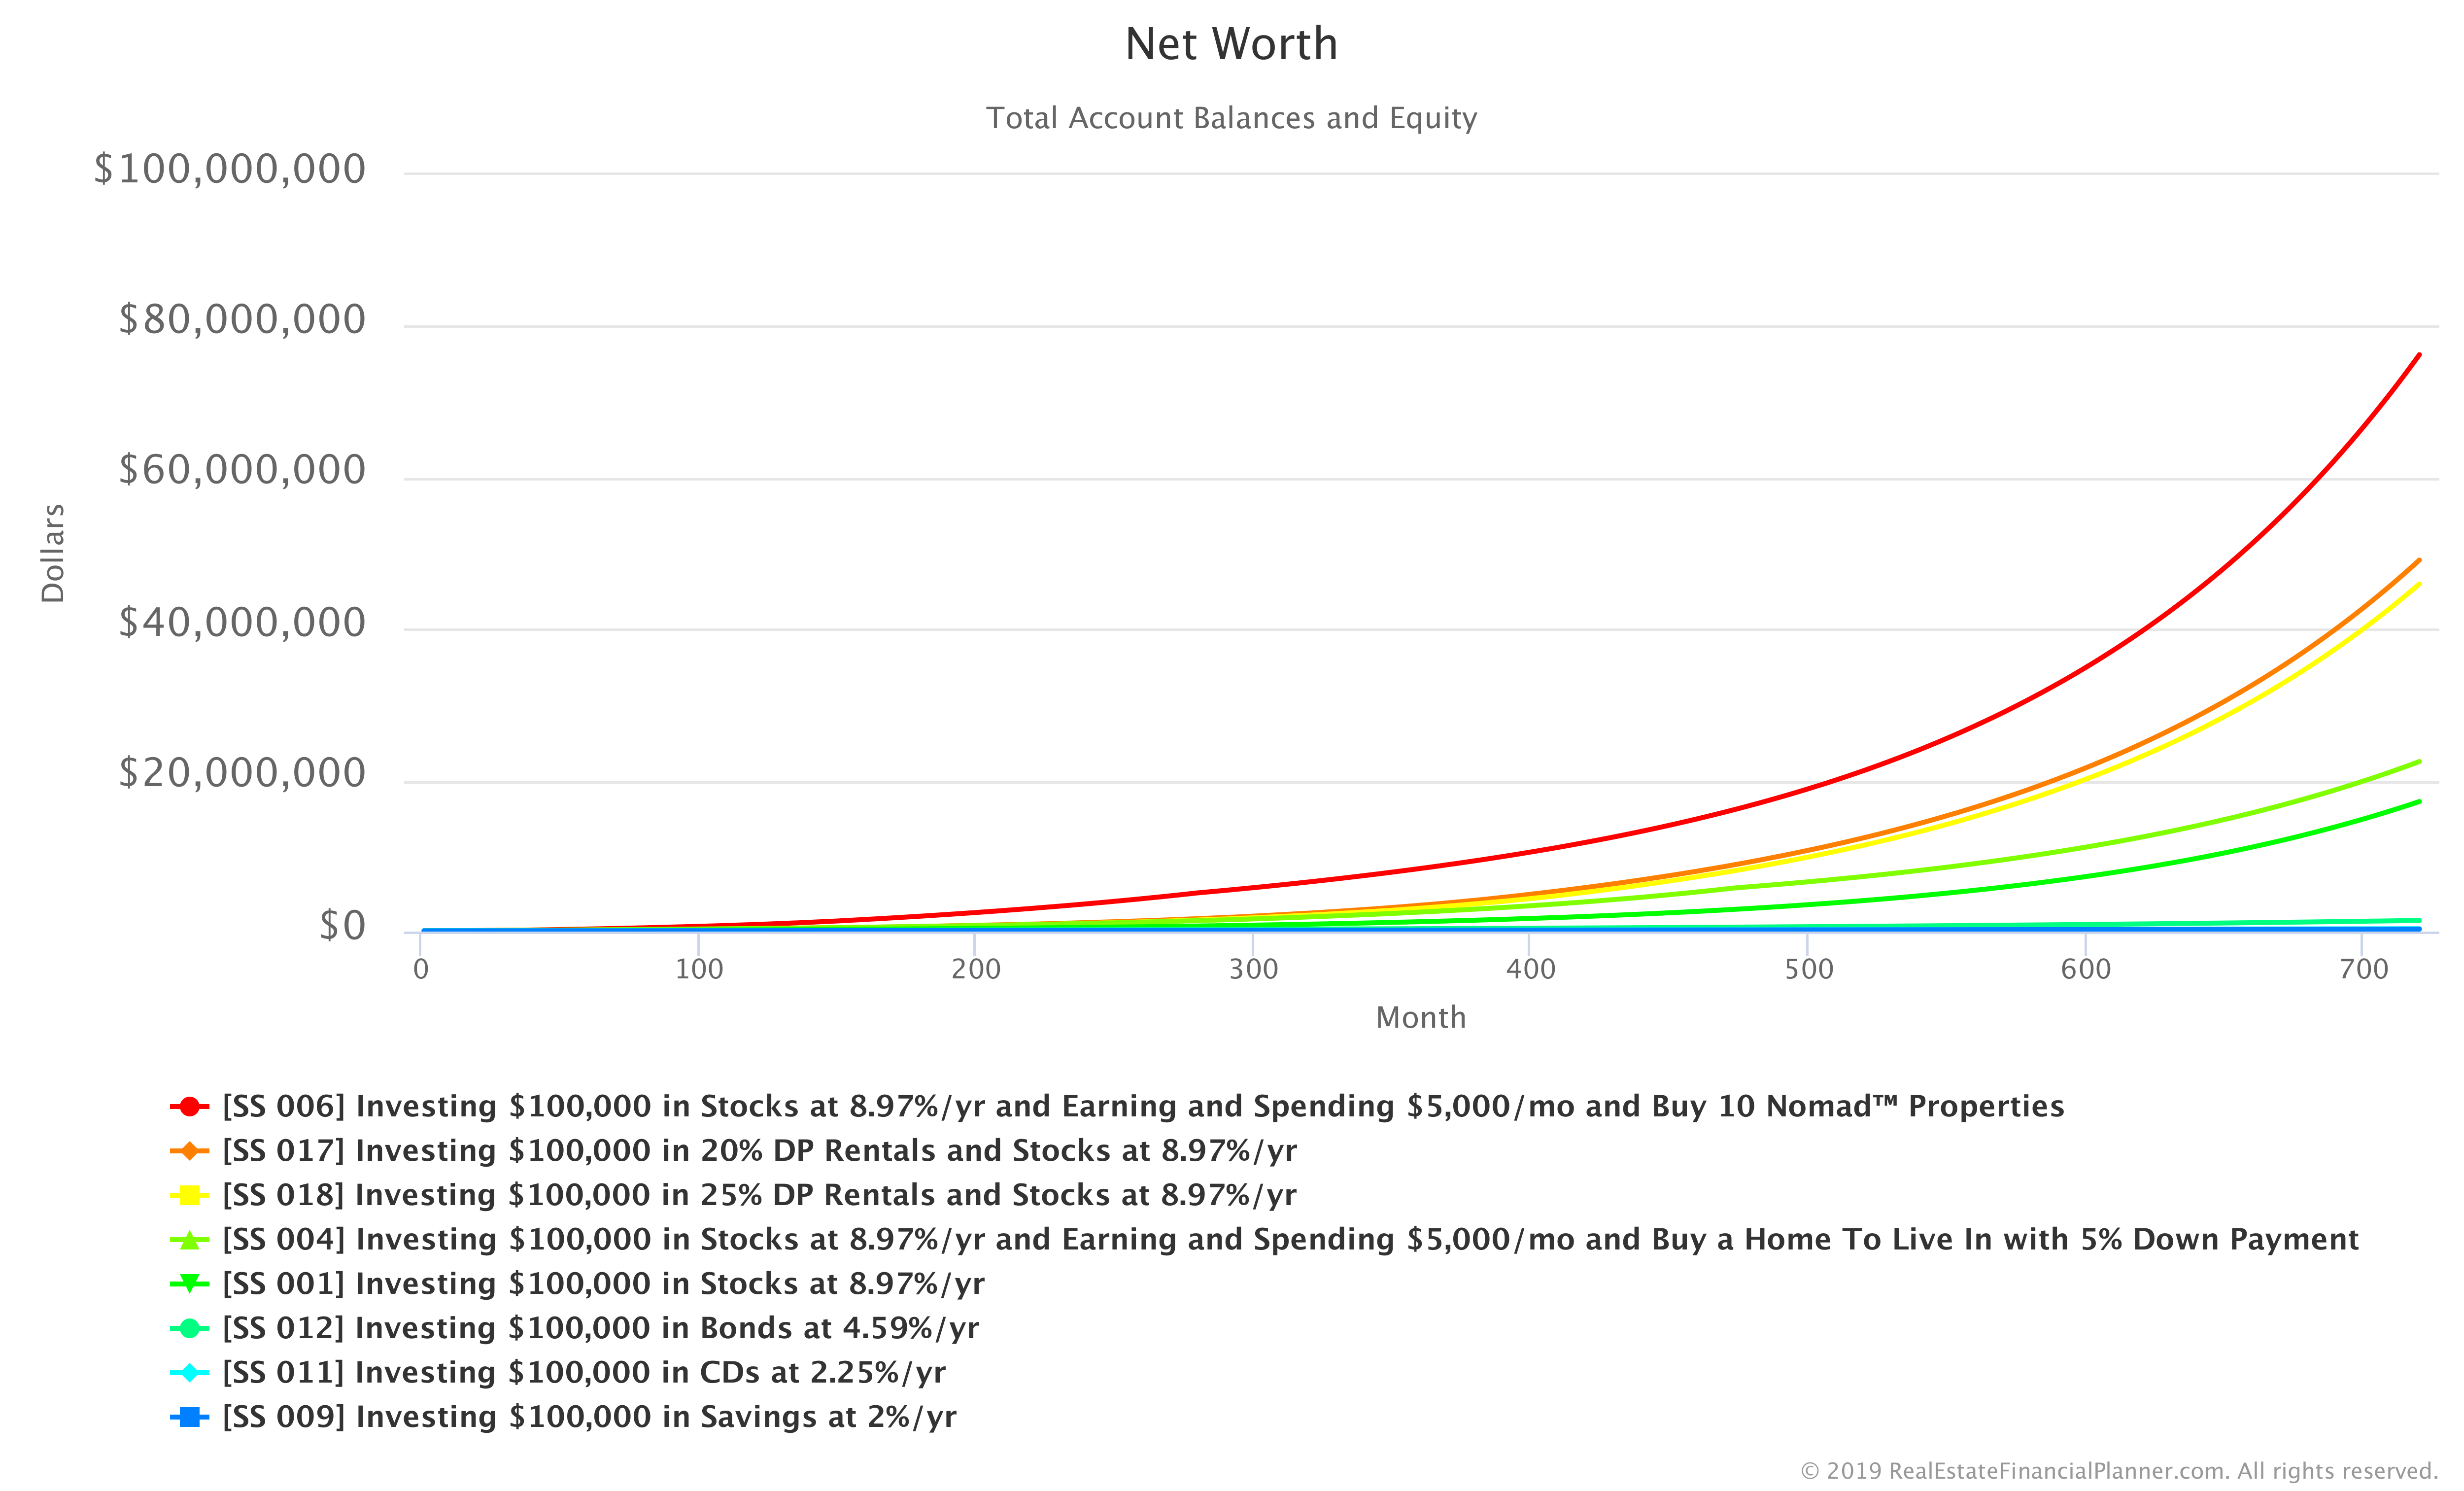
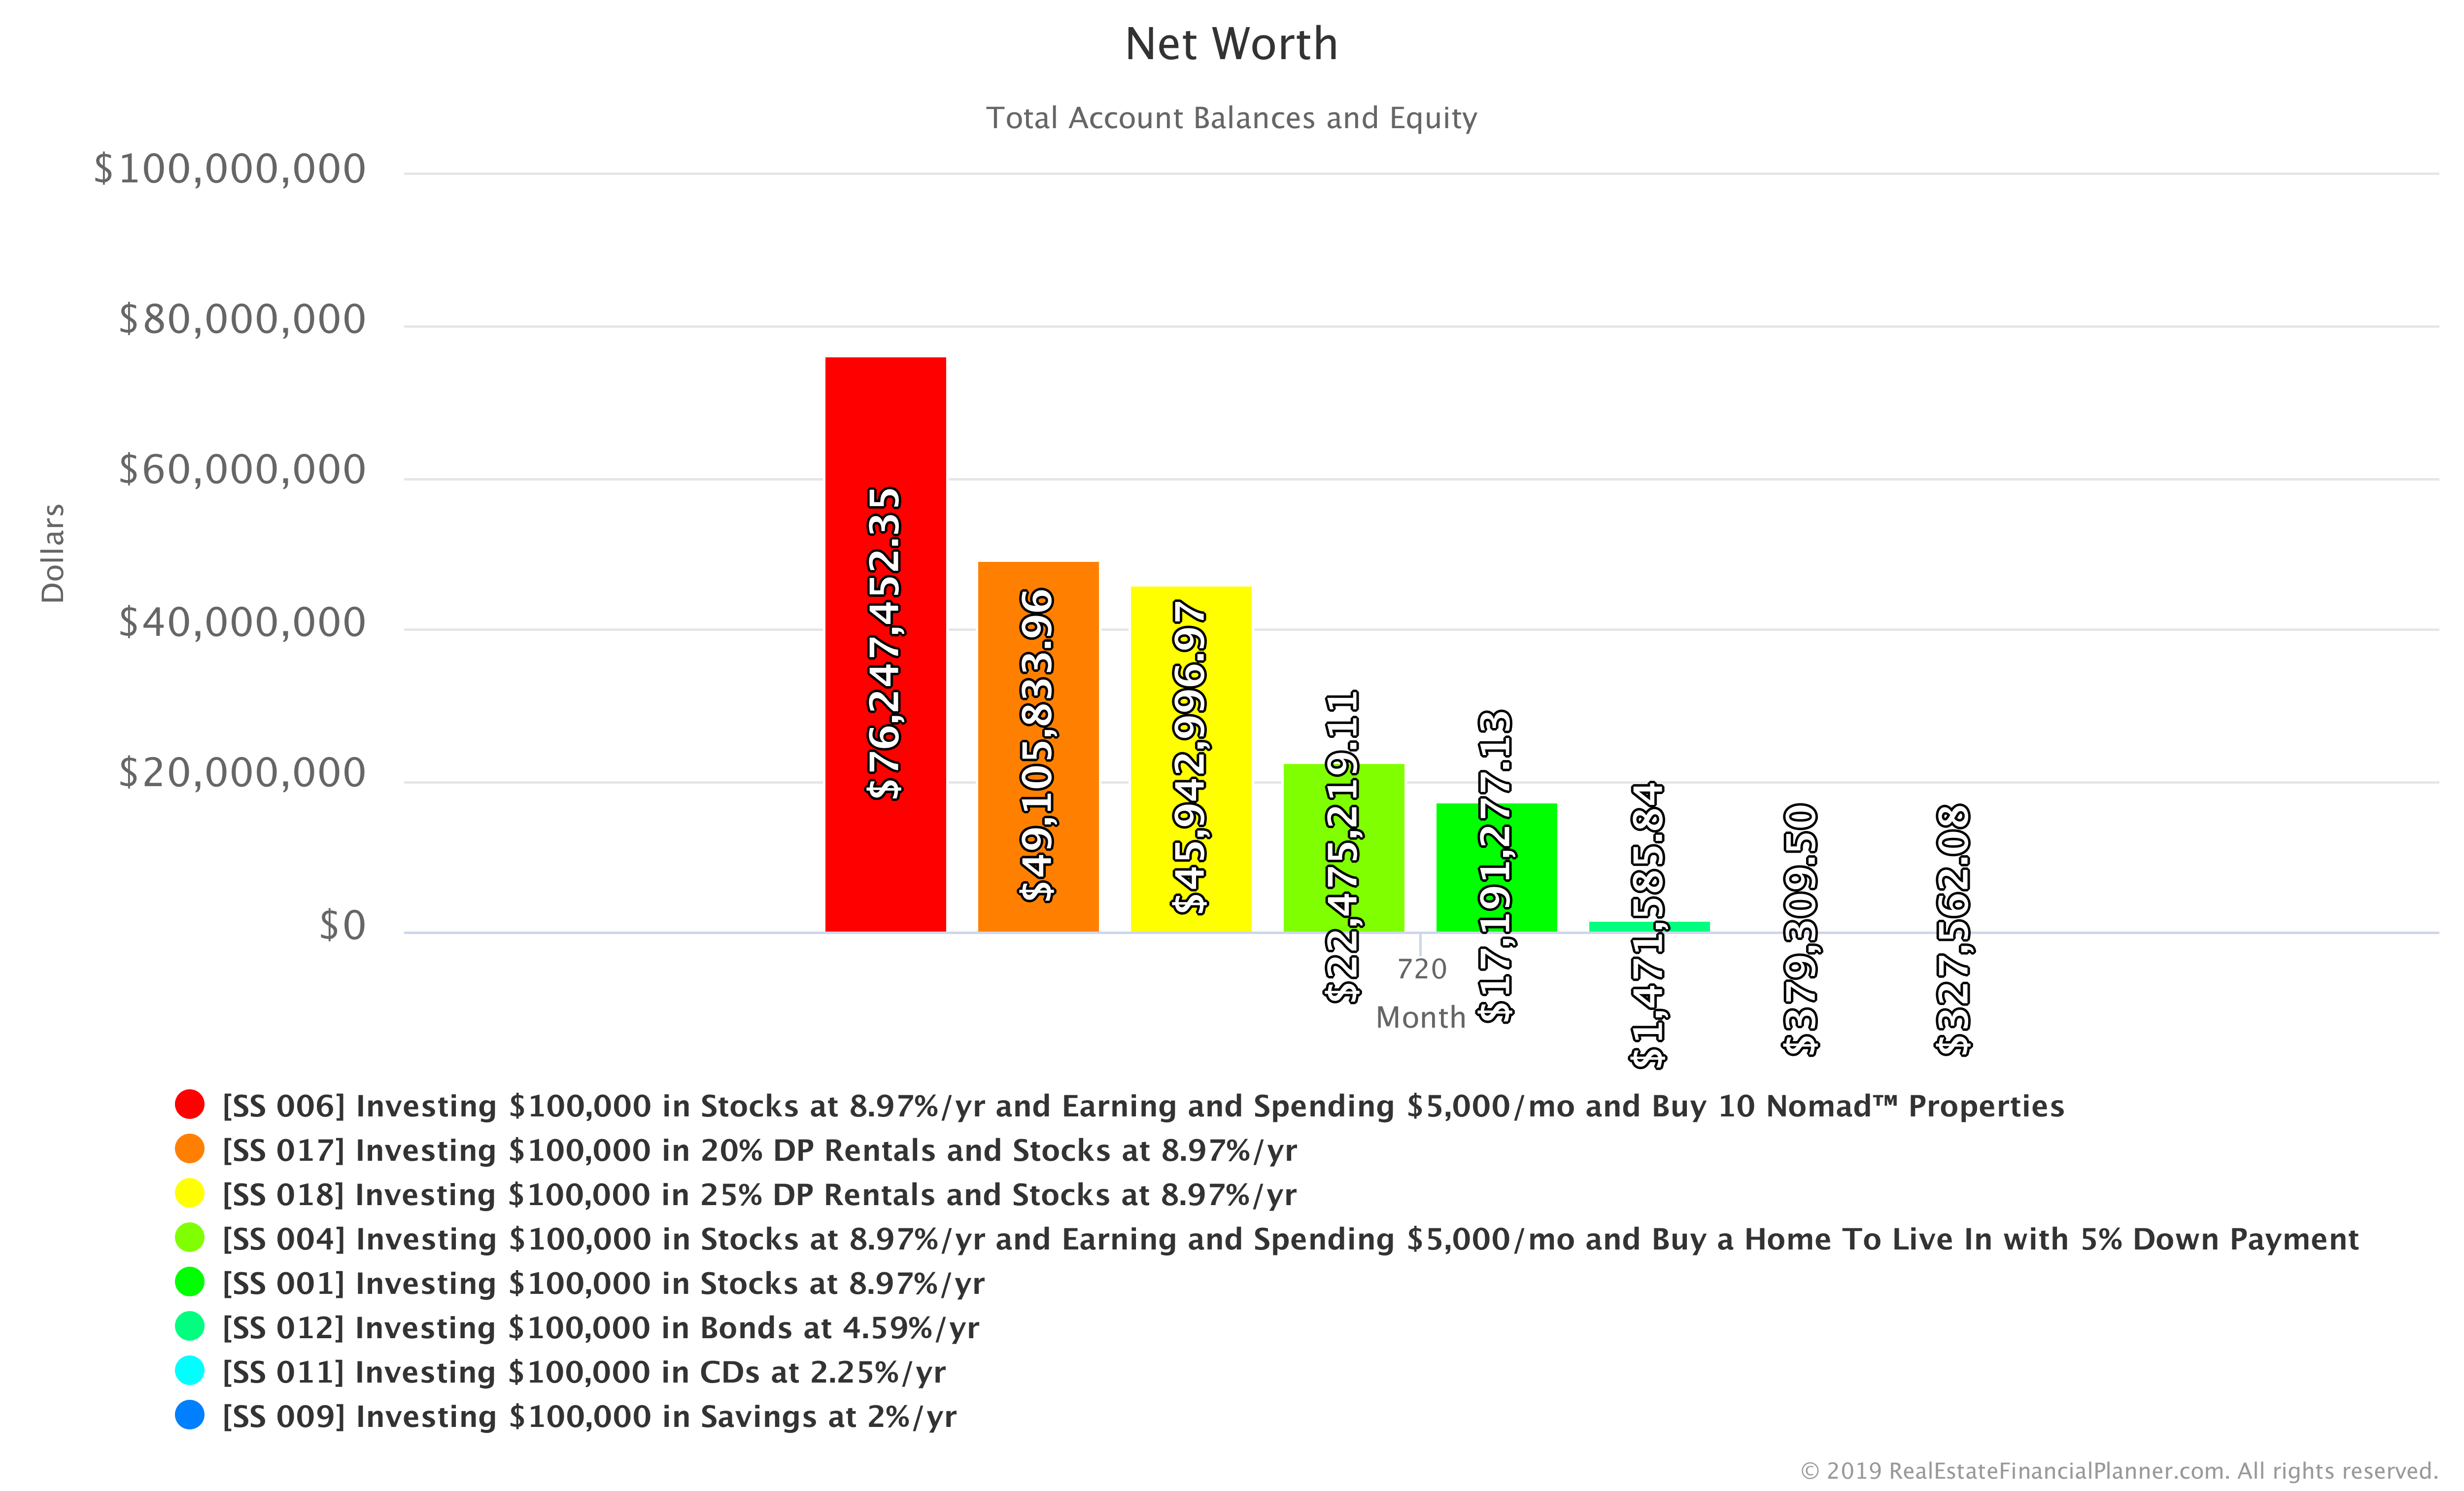
Looks like the Nomad™ one is best if you’re willing to move 10 times (that’s the downside of that investing strategy). How does it look in year 60? Let’s check out the Chart below comparing Net Worth for each Scenario in year 60.
If we adjust for inflation back to today’s dollars, the Chart below shows you the comparison for the entire 60 year timeline.

Looking just at year 60 in inflation-adjusted dollars, you can see just how much better Nomad™ performs in the Chart below.

But, what if you don’t want to move 10 times? What if you only move 9 times? Or, twice? Copy the Scenario to your own Planner™ and change the maximum number of properties to buy in the Rule for buying properties to see the impact of your changes.
Login to copy this Scenario. New? Register For Free
Scenario into my Real Estate Financial Planner™ Software
SS 006 Investing $100,000 in Stocks at 8.97%/yr and Earning and Spending $5,000/mo and Buy 10 Nomad™ Properties with 2 Accounts, 1 Property, and 2 Rules.
Or, read the detailed, computer-generated, narrated Blueprint™
Investing An Amount Other Than $100K
For the entirety of this article, we’ve focused on investing $100,000.
What if you want to change the amount that you’re starting with?
That’s why I wrote the Real Estate Financial Planner™ software. Just copy the Scenario that you’re interested in above to your own Planner™ to modify any of the assumptions.
To change the $100K you’re starting with… just adjust the starting balance in your Account and rerun the Scenario to see the new results within seconds.
More Sophisticated Modeling and Optimization
Most people that see this article thing, “OMG… this guy just went to freaky-town analyzing all these different investments starting with $100K!”
Honestly, these are the really basic models that we can do with the Real Estate Financial Planner™ software. These are “starting points” for you to copy to your own Planner™ and add in complexity.
- Do you already own Properties? No problem… use the Already Owned button when adding new Properties to model the properties you already own.
- Are you saving more each month? Go ahead and add a new Rule for modeling your paycheck and personal expenses to model saving money.
- Want to model you stopping working? Set your Rule for your paycheck and personal expenses to stop at a specific point. Or, model you stopping work when you hit your Target Monthly Income in Retirement number from your safe withdrawal rate and cash flow from rentals.
- Want to model social security? No problem… add another Rule for a paycheck without additional expenses to start at a specific date in the future.
- Want to model paying off properties early? No problem. Use our special Rule for that.
- Want to model buying more Properties than you need and then selling off some to pay the remaining ones to improve cash flow? We got a Rule for that.
- Want to refinance Properties to buy more? No problem.
- Want to stress-test your real estate investing strategy to see how it performs during market corrections? As you might have guessed… we have a Rule for that as well.
You can do all this and more with the Real Estate Financial Planner™ software.