Never buy rental properties with negative cash flow. Or, so the advice goes.
But what if you find yourself in a real estate market that is near impossible to find a property with positive cash flow?
In this special, one-time only class, James talks about an alternative to cash flow by using your rental properties… even ones with negative cash flow… as a means to save money.
This two-hour class was recorded on March 31, 2021.
Premise of the Class
Cash flow is important.
Some folks may argue that investing in real estate for anything other than cash flow is folly.
How about an alternative view to cash flow where we use rental properties as a means to save and accumulate money and increase net worth similarly to how we might investing in stocks for long-term growth?
In this webinar, we will focus on using rental properties as a investment for saving money in markets where finding cash flowing properties is challenging or impossible with reasonable sized down payments.
Cash Flow Options
What do you do if you’re in a market where it is difficult to find positive cash flowing properties?
- Invest in another market that has better economics…
- Change your investing strategy (to lease-option exits)…
- Put more down…
- Increase income and reduce expenses…
- Basically… all the things in the 2-hour How to Improve Cash Flow Workshop class
But, what if that is still not enough?
Alternatives To Buying Non-Cash-Flowing Properties
- Do nothing
- Invest in something else…
- What else could we invest in?
- Beyond money you need for liquidity/reserves… where are you going to put your money?
- And, do these other investments cash flow?
- Let’s see…
Do These Investments Cash Flow?
- Savings: Interest (that can look like cash flow)
- CDs: Interest (not usually immediately accessible without penalty)
- Bonds (including funds): interest (and some value/”price” speculation)
- Stocks (including index funds, mutual funds): price speculation and dividends (which can look like cash flow in some cases)
- Hedge funds: depends on what the fund is investing in but not usually cash flow
- Commodities: price speculation
- Business: can generate cash flow!
- Real estate is often like starting a rental property business
- Collectibles: price speculation (no real cash flow)
- Crypto-Currencies: price speculation (no real cash flow)
- Private Lender: interest on your money (may or may not be cash flow)
- Retirement Accounts: based on what you’re investing in (stocks, bonds, et cetera); limited accessibility without penalty until retirement
- Annuities
- Any others?
A Danger: Speculation
Every case I’ve personally seen where someone has said you should buy cash flowing properties it is associated with an admonition to not “speculate”.
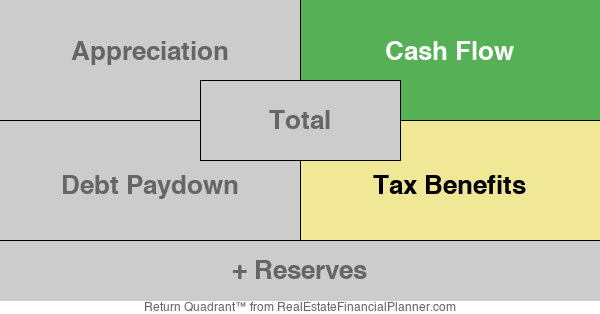
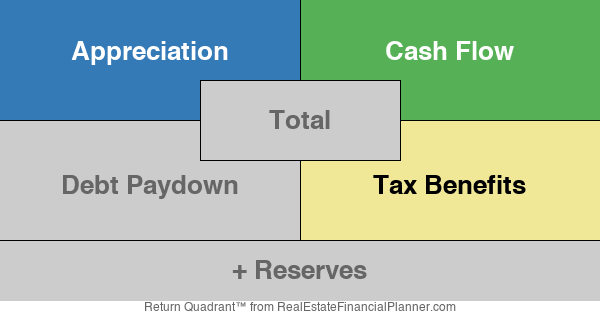
Let’s look at the Return Quadrants™.
- Which returns are speculative and market dependent?
- Which returns are less speculative and not market dependent?
- Which returns are cash now?
- Which returns are cash later?
And then, let’s look at some historical market data about rent and price appreciation.
Return Quadrant + Reserves™
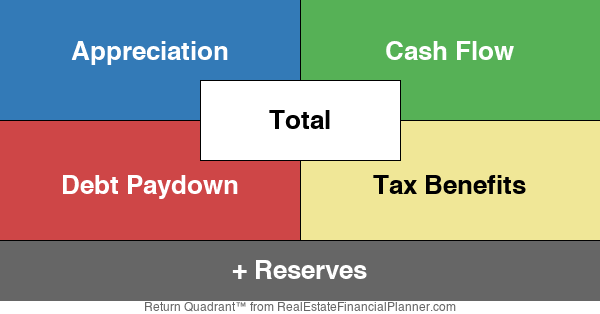
Speculative, Volatile, Consistent, Limited
More Speculative, More Volatile, Less Consistent, Unlimited.
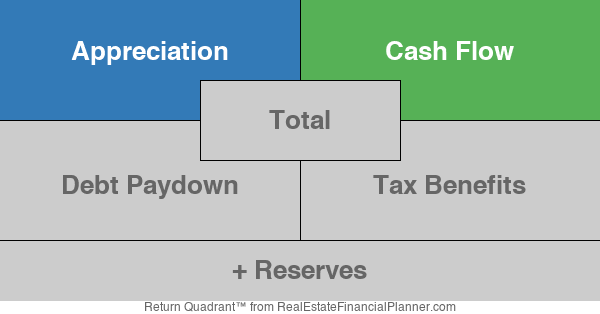
Less Speculative, Less Volatile, More Consistent, Strictly Limited.

A Word on Reserves
You may have noticed I did not highlight Reserves.
Speculative, volatility, consistency and limitedness of Reserves in Return Quadrants + Reserves™:
- All reserves are unlimited/perpetual – they do not have a fixed upper limit.
- However, for speculative, volatility and consistency it depends on what you’re keeping your reserves in.
- For RIDQ+R6™, ROIQ+R6™, ROEQ+R6™… by definition we’re keeping 6 months reserves in a savings account
- So, less speculative, less volatile and more consistent
- For RIDQ+R12™, ROIQ+R12™, ROEQ+R12™… by definition we’re keeping 12 months reserves with at least some in a stock-market-like account
- So, more speculative, more volatile and less consistent
Timing & Availability
Cash Later
Cash Now
The Past ≠ The Future
The Past Does Not Equal The Future:
- Just because a market has seen strong appreciation historically, does NOT mean it will continue to see strong appreciation
- Just because a market has not seen strong appreciation historically, does NOT mean it will continue to perform poorly
- Just because a market has seen strong cash flow historically, does NOT mean it will continue to see strong cash flow
- Just because a market has been cash flow weak historically, does NOT mean it will continue to see low cash flow
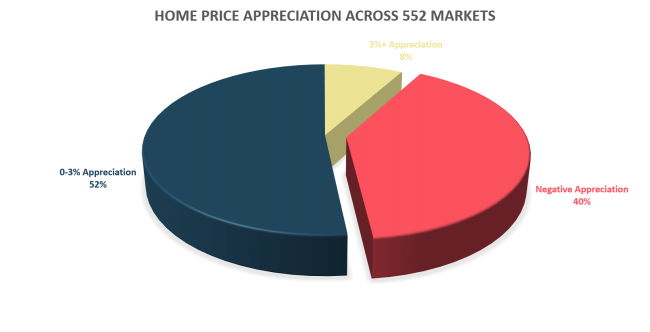
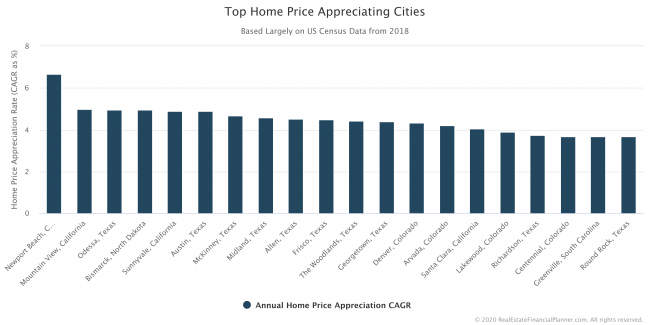
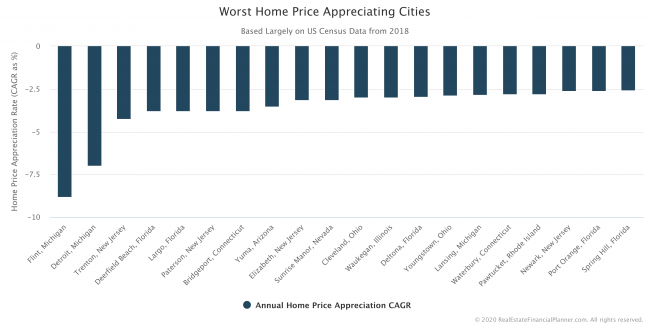
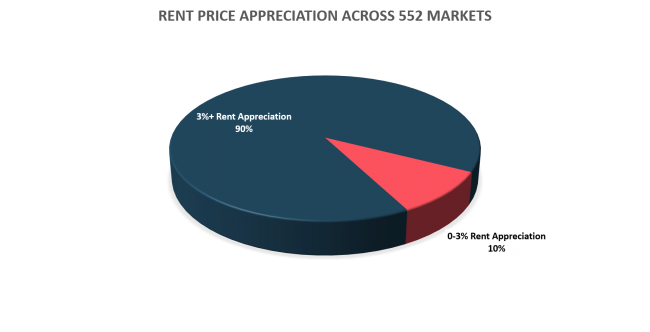
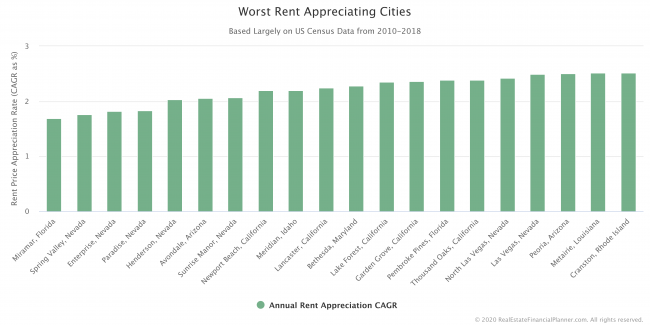
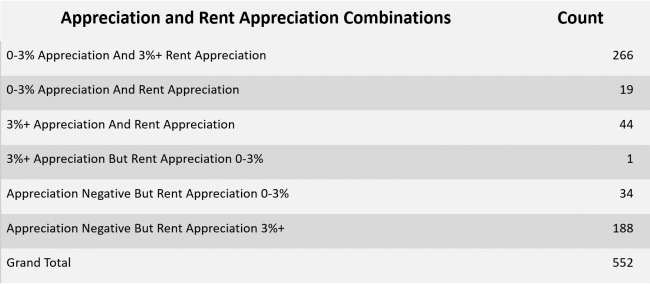
Historical Real Estate Data
I believe the original source is US census data:
- Largest 552 Real Estate Markets in the US
- Period 2010-2018
- I first presented this in the Cash Flow Versus Appreciation class
- Dig into this data here:


Saving With Real Estate
If we assume that over time cash flow and tax benefits combined are at least break-even.
Cash flow may even start off slightly negative.
While the The Past ≠ The Future, historical data suggests rents will creep up (and I’ll add/suggest with inflation).
Tax benefits are established at time of purchase and remain fixed for 27.5 years (or 39 years for commercial properties).
True Cash Flow™
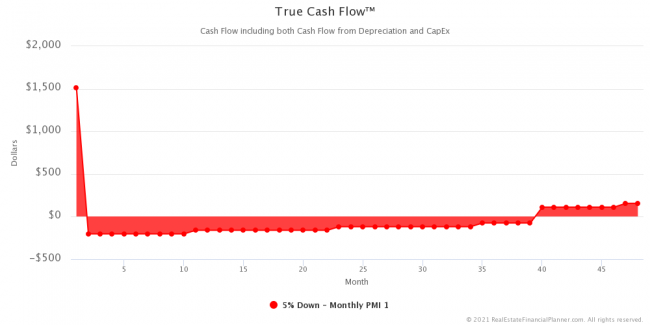
For more information, see True Cash Flow™.
Cumulative Negative True Cash Flow™

Appreciation is just enough to cover sales costs. Or sell it to a Tenant-Buyer (on a Lease-Option) to reduce/eliminate sales and transaction costs on sale.
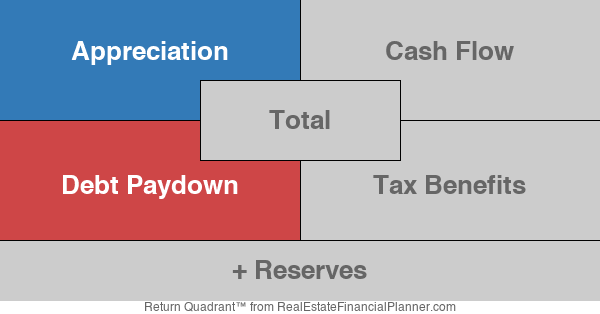
What we’re really left with is primarily Debt Paydown.
Equity gained by paying down the loan.
How does this “return” work?

Debt Paydown
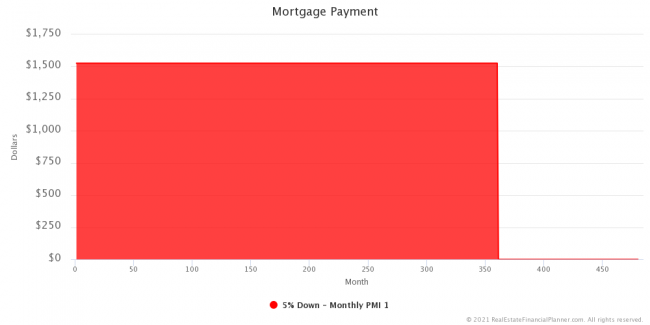
With traditional amortizing loans only. This does NOT work with interest only loans.
As you make monthly payments, a portion of that payment pays off the amount that you owe. You owe a bit less after each payment you make.
This is the “amortization table” you typically sign at closing when buying a home.
Your mortgage payment remains fixed over time. Other expenses do increase.
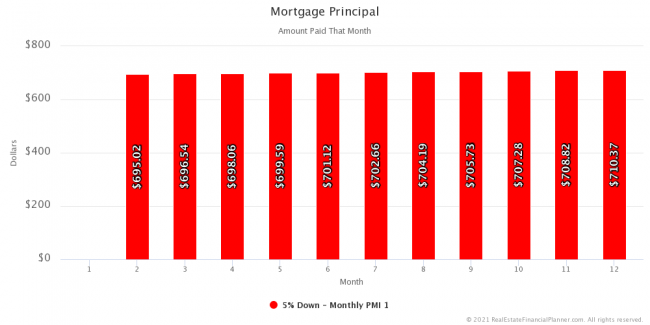
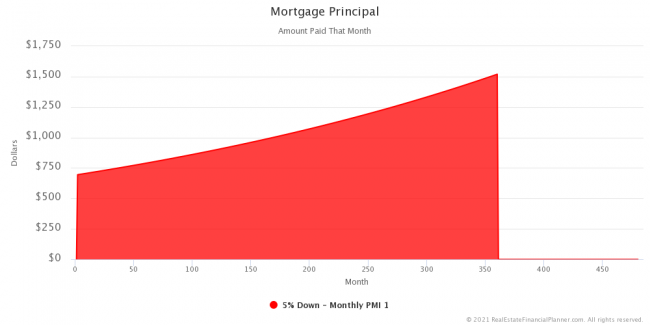
- The amount of loan you payoff with each payment increases over time.
- The amount you pay in interest decreases over time.
- The loan balance decreases over time.
Mortgage Payments

Mortgage Principal
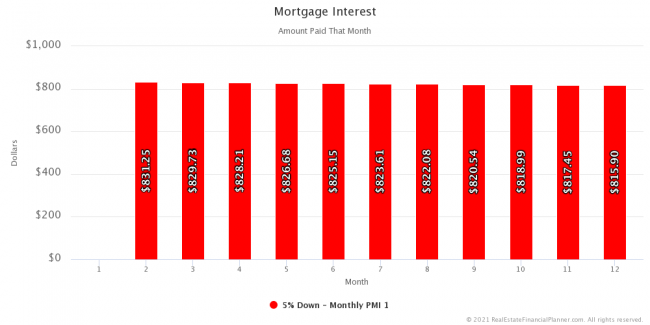
Mortgage Interest

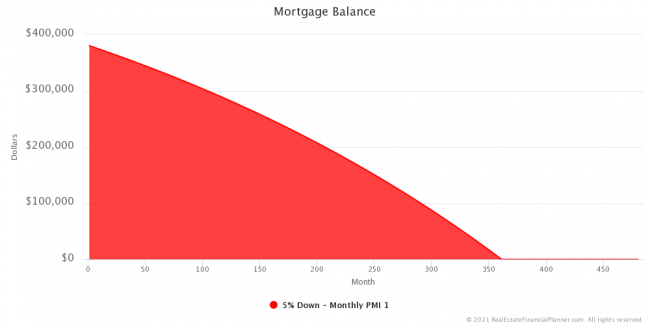
Mortgage Balance

Debt Paydown As A Black Box
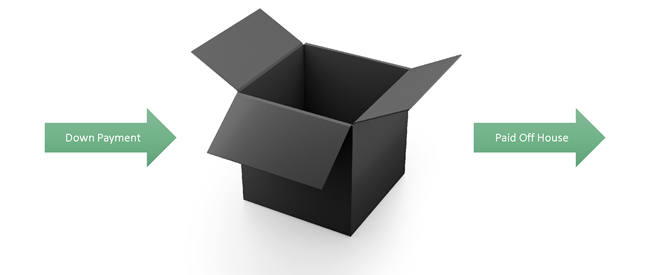
And, more specifically…
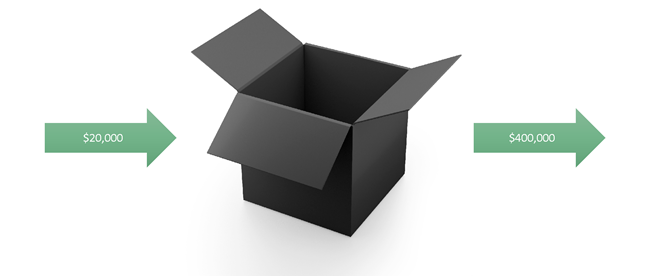
Calculating The Return from Debt Paydown
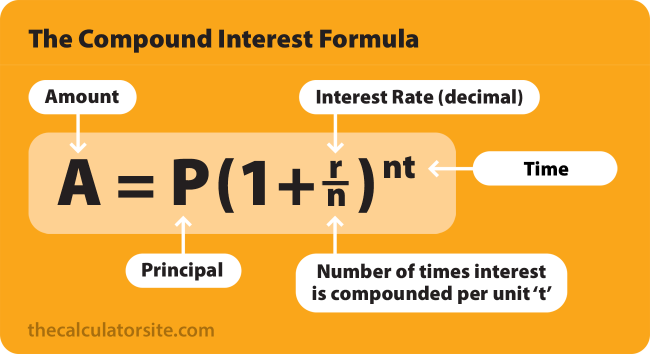
- $400,000 = $20,000(1 + r)30
- Assume we’re compounding interest once per year
- Solve for rate to figure out the rate you’d need to be getting to take $20,000 (your down payment) and have it be worth the full value of the house, $400,000, by year 30
- Appreciation is a totally different return so we just do the initial value of the house
- The house does NOT need to go up in value for you to get this return
- It is more correct to include your closing costs in addition to your down payment
So, what is that rate?
It depends!
Turns out the rate varies depending on:
- Down Payment % (and therefore amount)
- Term of the loan (30 years, 15 years, etc)
And, if you’re selling before the full term of the loan, the interest rate also matters. If you go the full term of the loan and pay it off, interest rate doesn’t matter at all.
Let’s see the ROI for various down payments and terms…

If you sell before the full term of the loan…

4.75%, 30 year loan with 20% on a purchase price of $400,000.
ROI from debt paydown would be:
- Year 1: 6.17%
- Year 2: 6.13%
- Year 3: 6.10%
If you went the full term of the loan, the compounding rate would have been 5.511%.
If you make your payments you get this return.
Tax benefits are likely too unless they change the tax law. Appreciation and cash flow are more market dependent.
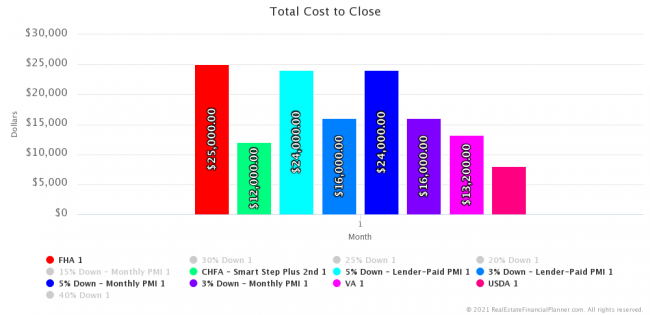
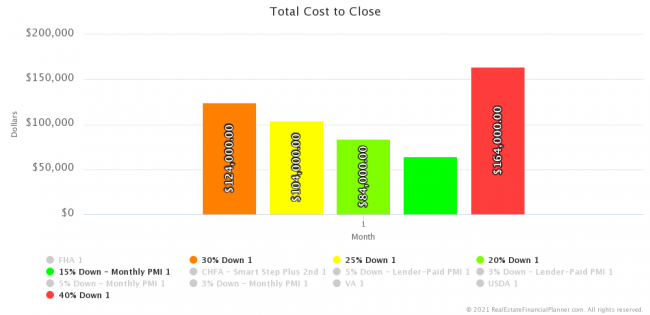
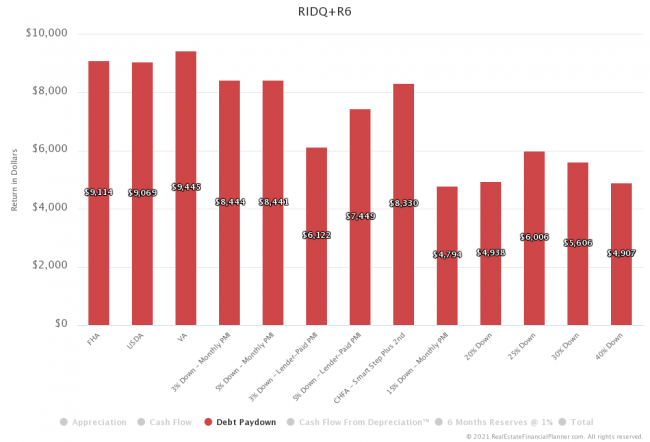
Return Varies By Loan Type
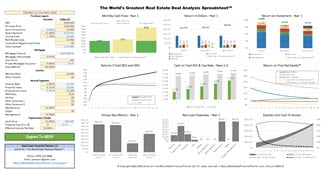
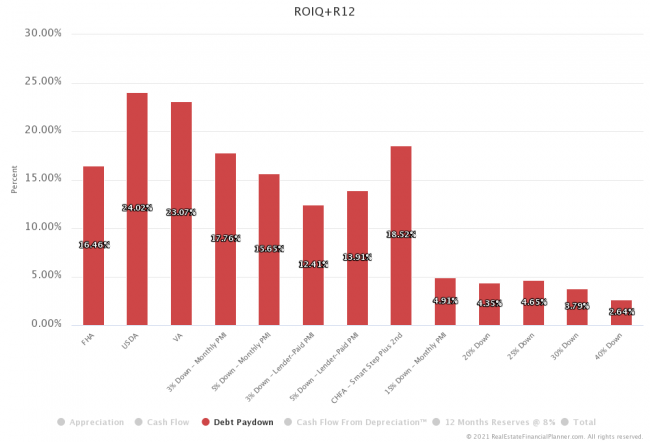
Let’s look at Return in Dollar Quadrants™ for a variety of loan types.
$400K property with interest rates from January, 2021. Interest rates vary based on loan.
This is a partial preview of the upcoming class Real Estate Investor Loan Comparison Deep Dive scheduled for April 28, 2021 where I’ll update the loan numbers right before class.
Return Quadrants™ – Emphasizing Debt Paydown

Let’s Consider A More Holistic Perspective
- No appreciation
- Full negative Cash Flow offset by Cash Flow From Depreciation™
- May or may not offset the full negative Cash Flow
- Use Return on Investment Quadrant™ for the first year
- Technically I am using 12 months starting month 2 (since there is no debt paydown in the first month and cash flow is abnormally high in month 1)
- Year 2 starts month 14 so I am not counting month 13 twice
- After that, it might be better to think in terms of Return on Equity Quadrant™
- Although ROE does not account for initial closing costs
- Might need to create a new chart term/chart!
- Will introduce True Net Equity™ and Return on True Net Equity Quadrant™ in next week’s class Should I Sell My Rental? ROTNEQ+R™ and that’s, arguably, an even better way to think about this
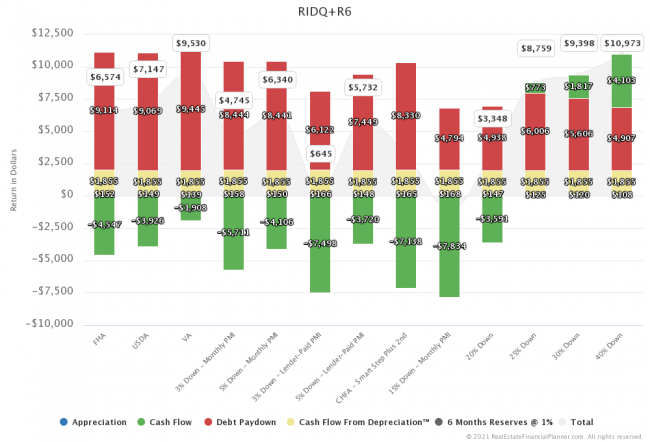
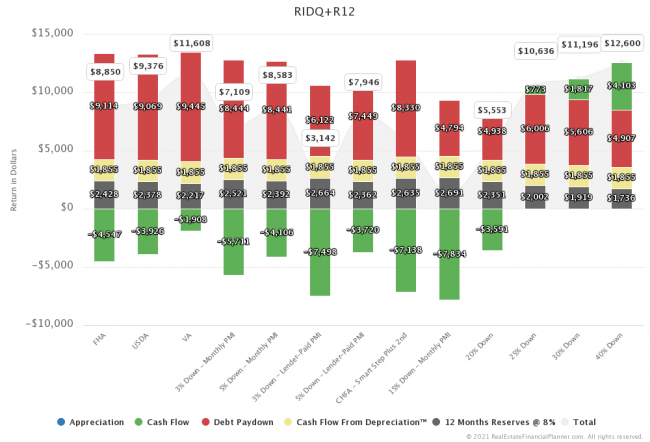
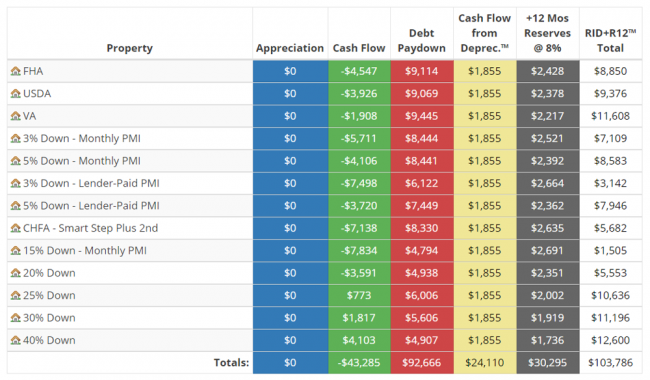
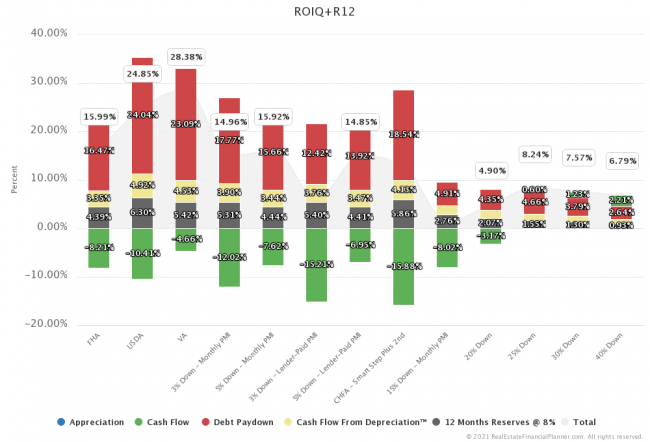
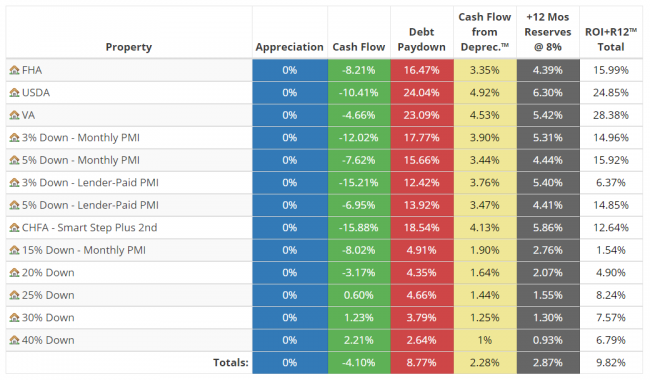
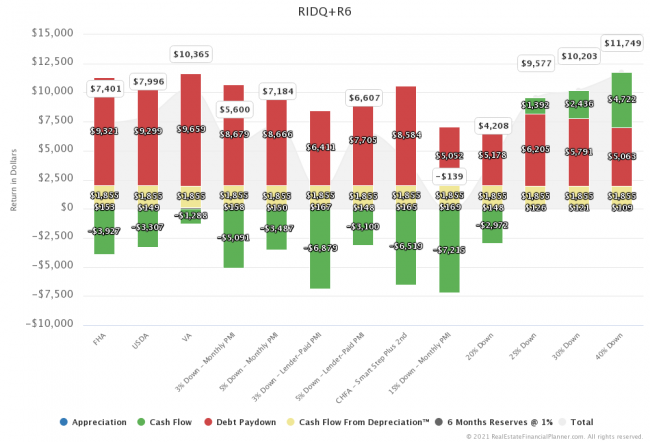
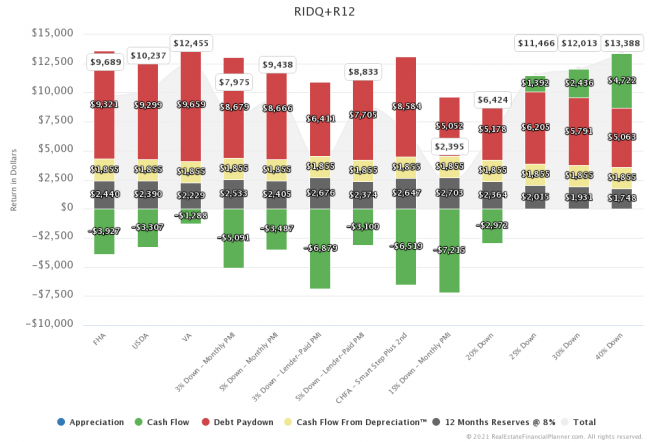
- Let’s look at quadrants with 6 months reserves then 12 months reserves for a variety of loan types…
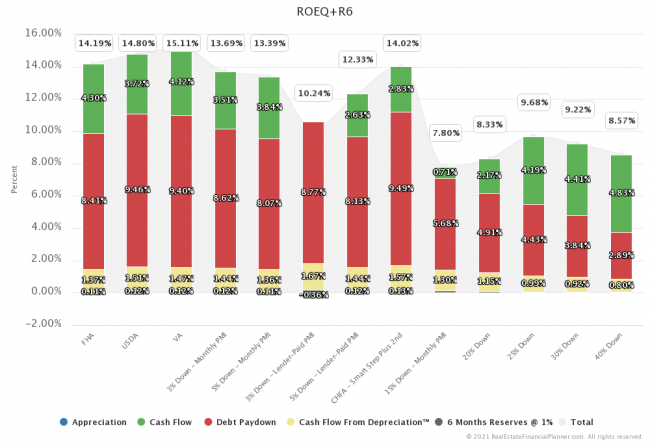
Year 1: Months 2 Through 13
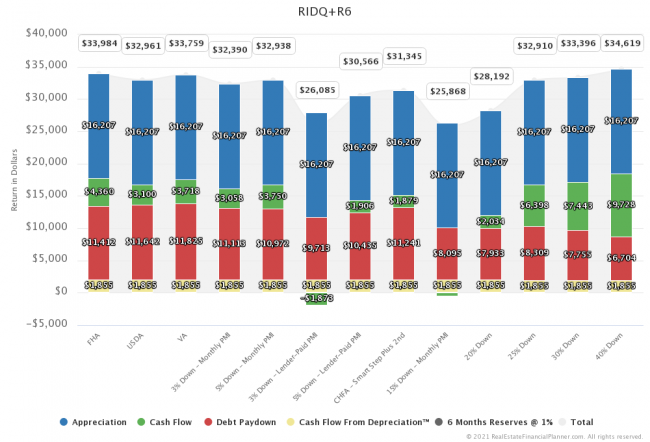
Return in Dollars + 6 Months Reserves Quadrant™


Return on Investment + 6 Months Reserves Quadrant™


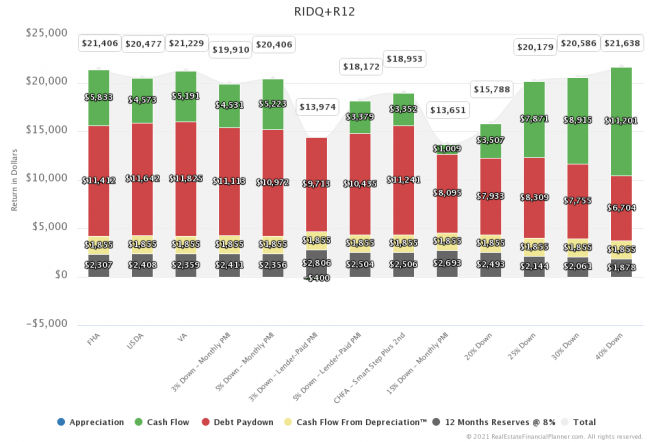
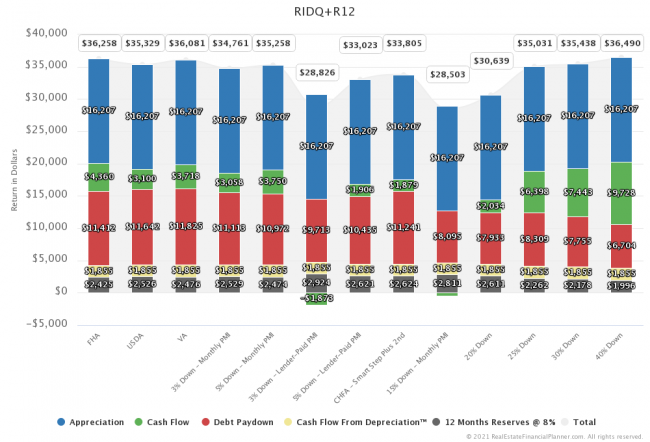
Return in Dollars + 12 Months Reserves Quadrant™
Return on Investment + 12 Months Reserves Quadrant™
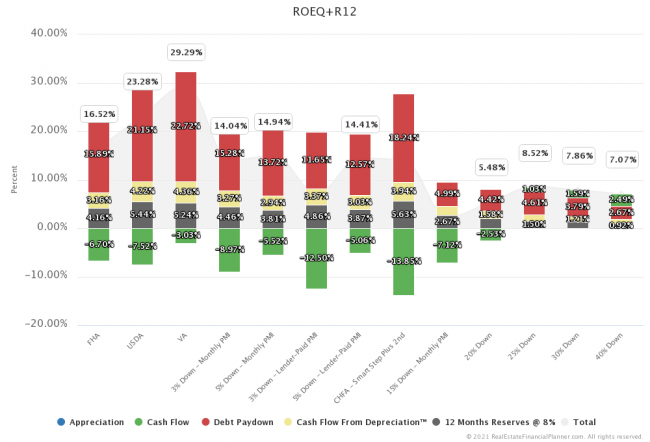
Year 2: Months 14 Through 25
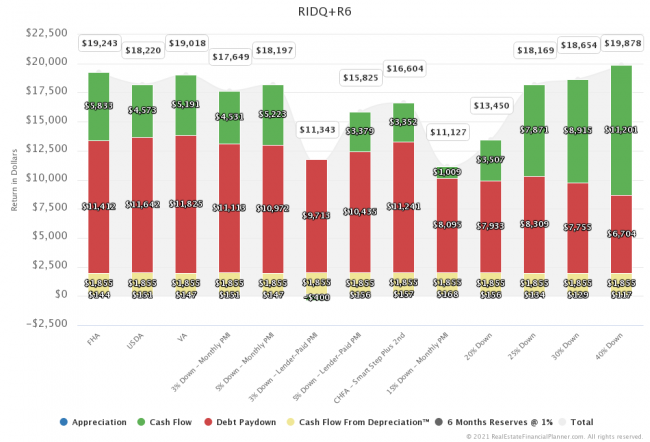
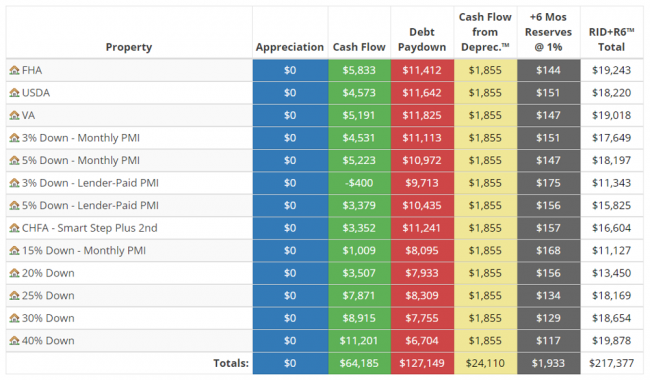
Return in Dollars + 6 Months Reserves Quadrant™

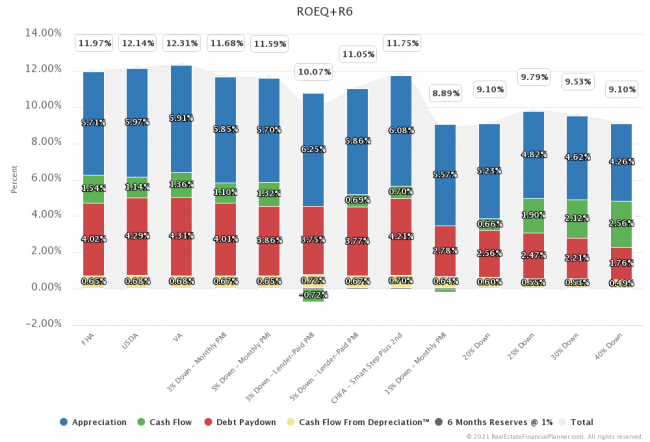
Return on Equity + 6 Months Reserves Quadrant™


Return in Dollars + 12 Months Reserves Quadrant™

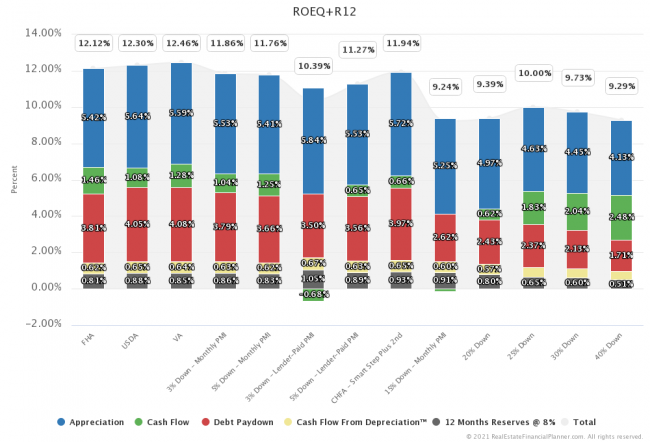
Return on Equity + 12 Months Reserves Quadrant™

Year 10: Months 122 Through 124
Return in Dollars + 6 Months Reserves Quadrant™
Return on Equity + 6 Months Reserves Quadrant™

Return in Dollars + 12 Months Reserves Quadrant™

Return on Equity + 12 Months Reserves Quadrant™
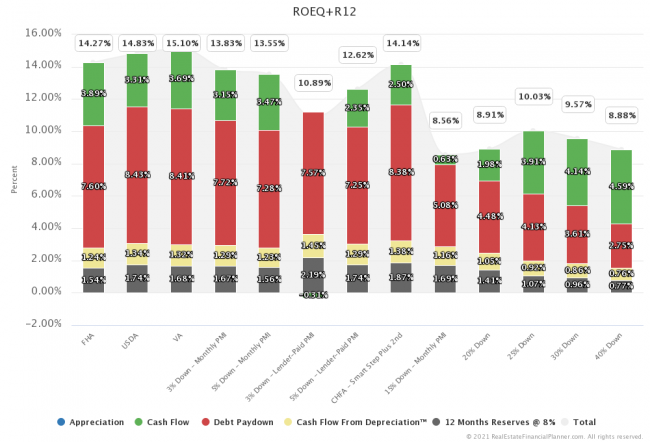
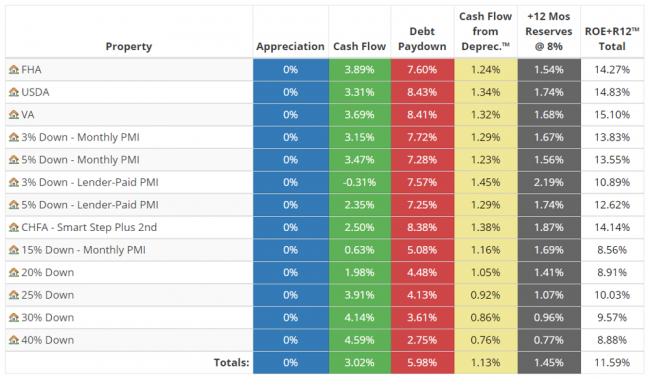
Appreciation
This was with NO appreciation.
- Which means equity is smaller.
- Which means Return on Equity is better.
If you have 3% appreciation:
- You get the return from Appreciation.
- You have larger equity.
- Which means Return on Equity is lower.
Be Careful
- Ideally, you’re still actively saving
- A danger of buying a property with negative cash flow is that you need to continue to make investments in it
- It is more conservative to set aside your reserves plus any negative cash flow you might have with reasonable modeling (Cumulative Negative Cash Flow or Cumulative Negative True Cash Flow™ chart from Real Estate Financial Planner™)
- You can think of this as “financing your down payment”
- If you had put more down, you could have had positive cash flow
- If you were planning to invest $X per month, this is the place to put your $X per month