You’ve heard of cash flow on rental properties. Basically, it is defined by taking all the income from your rentals minus all your expenses.
But, have you heard about True Cash Flow™?
True Cash Flow™ is your traditional cash flow plus Cash Flow from Depreciation™.
If you’re familiar with the Return Quadrants™, True Cash Flow™ is represented by the returns from these two sections:
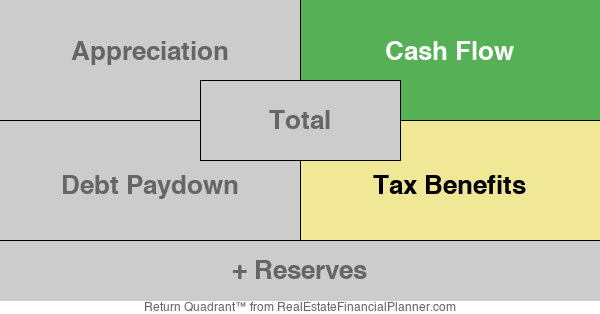
Post Depreciation Period
Depreciation for a residential rental property typically lasts 27.5 years. Since True Cash Flow™ is really cash flow + Cash Flow from Depreciation™, once you own a property more than 27.5 years and you can no longer depreciate the property a couple things happen.
First, Cash Flow from Depreciation™ goes to zero. You don’t have any depreciation left to take.
Second, True Cash Flow™ is now the same as regular cash flow.
So, True Cash Flow™ is helpful thinking tool only during the depreciation period and is not helpful once you get past the period you get to take depreciation on your rentals.
True Cash Flow™ When Contemplating: Should I Refinance My Rental Property?
When contemplating whether or not you should refinance your rental property, many real estate investors will consider whether any increase in monthly payment from a refinance will be covered by the True Cash Flow™ of any properties they may purchase with cash out refinance proceeds.
If the properties they’re going to buy cannot support the extra monthly payment from the refinance then don’t refi. Of course, there are more subtle and nuanced considerations that the Real Estate Financial Planner™ software does a great job modeling.
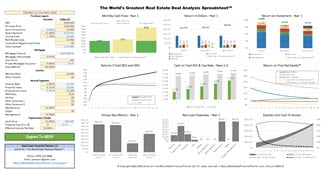
True Cash Flow™ Charts
You can view a variety of True Cash Flow™ related  Charts
ChartsYou can view True Cash Flow™ for any  Scenario Scenarios
You can also view True Cash Flow™ for any individual  Property Properties Scenario Properties
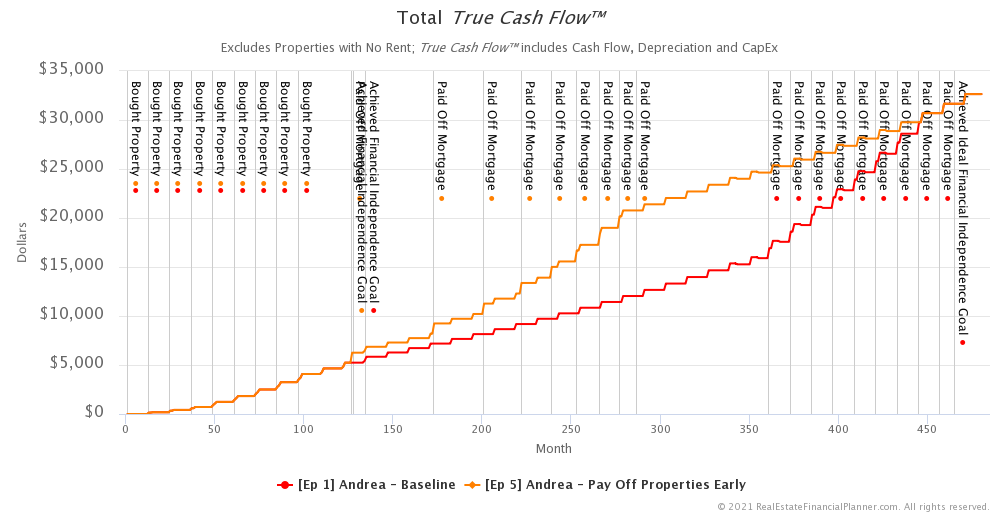
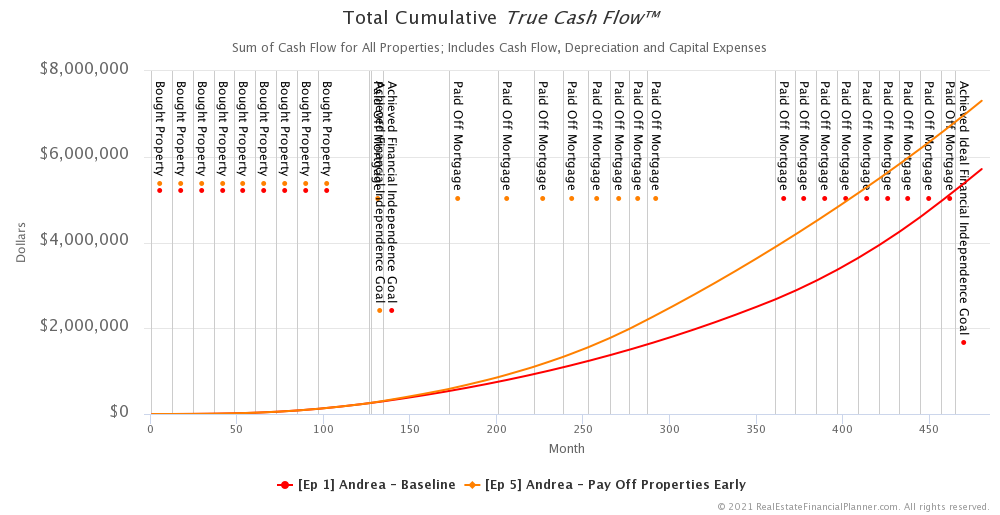
For example, here are a few from  Andrea’s situation.
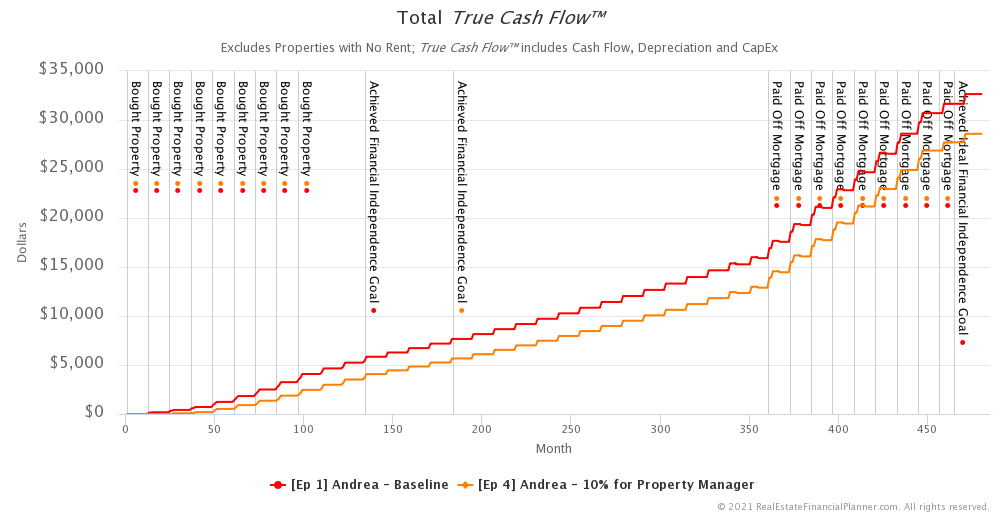
Or, the same Chart
Or this one when Andrea
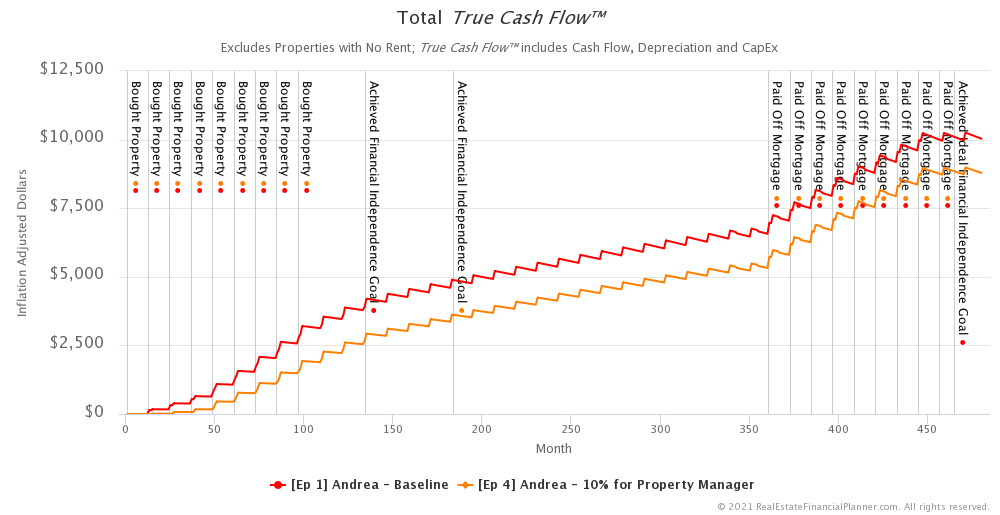
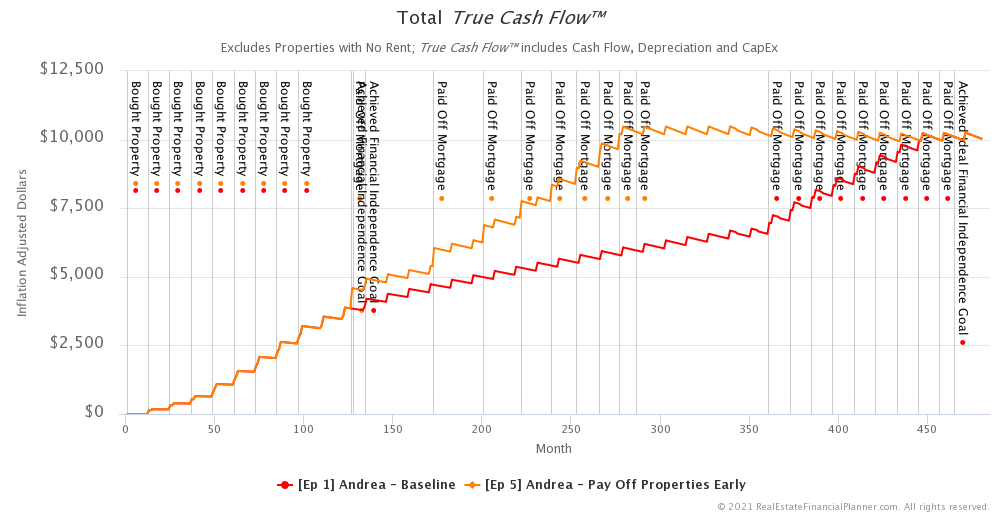
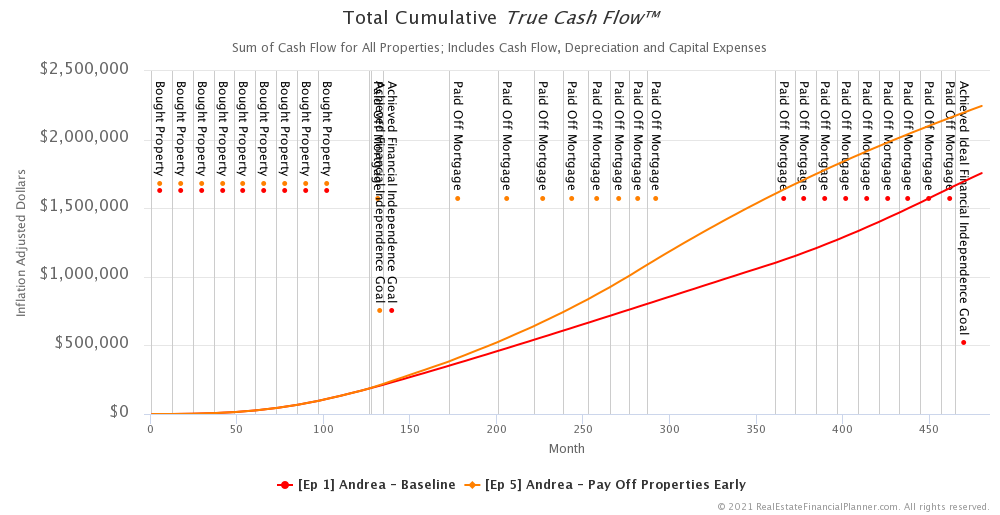
And here’s the inflation adjusted version of that same Chart
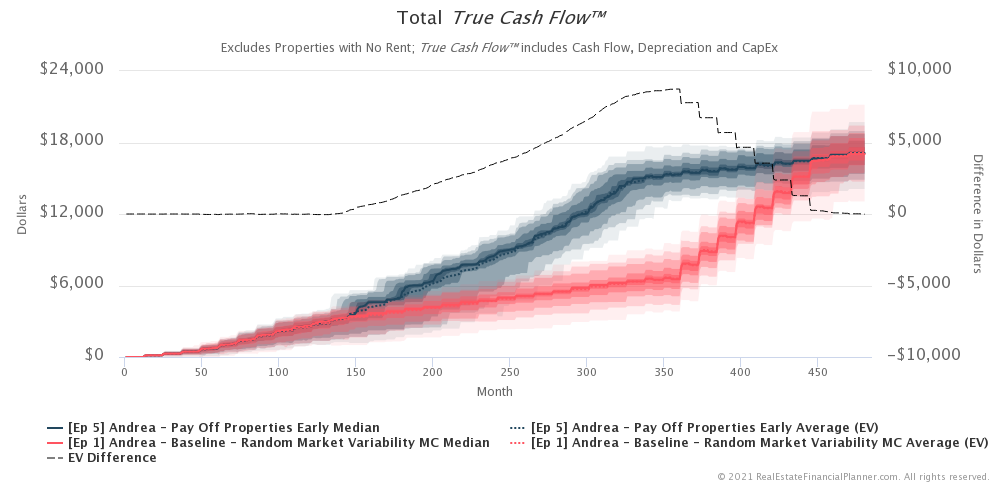
And, here’s an advanced comparison where we run monte carlo analysis and compare them.
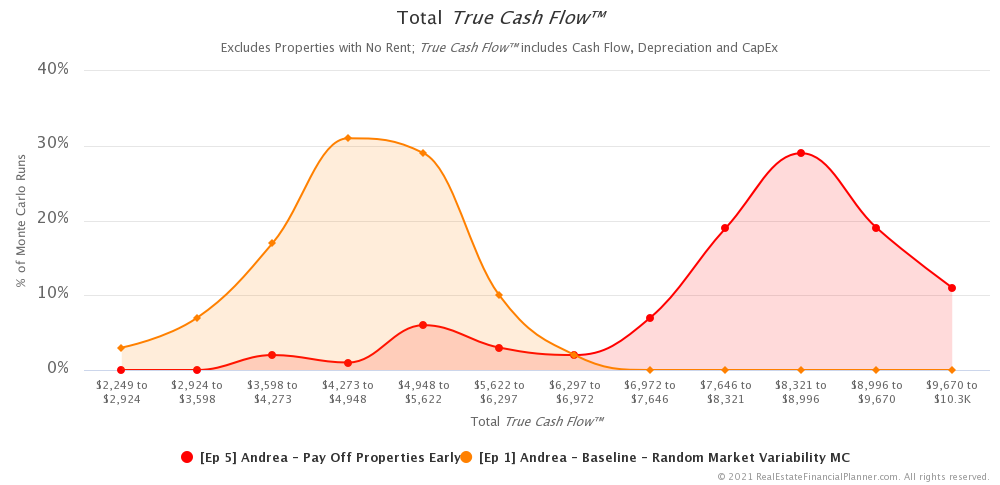
And, here’s what the probability curves look like for the monte carlo analysis for 20 years (month 240).
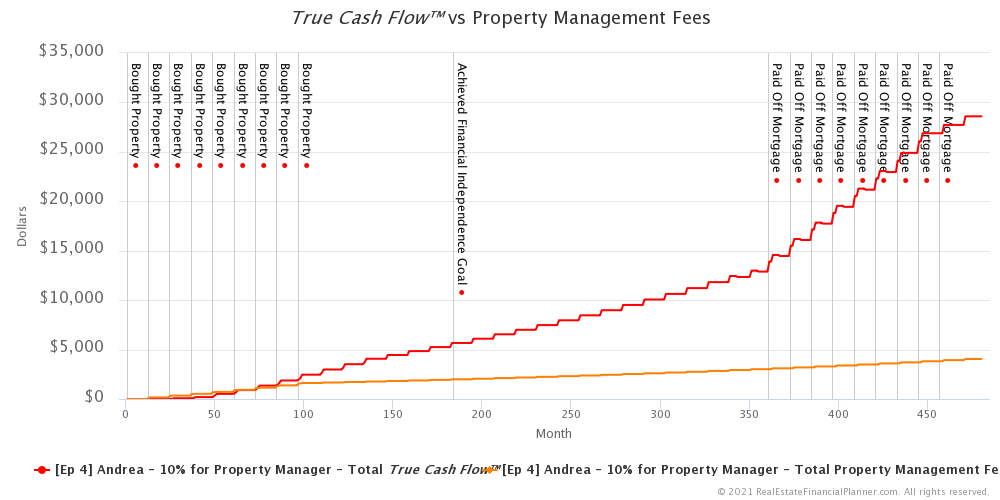
Want to see how much True Cash Flow™ that Andrea Chart
And, of course, the inflation adjusted version.
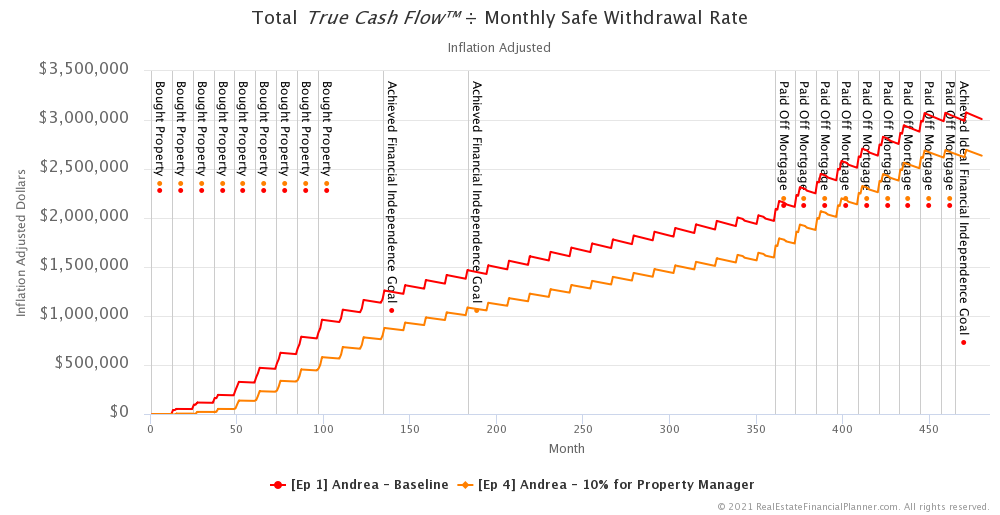
In episode 4 with Andrea Chart
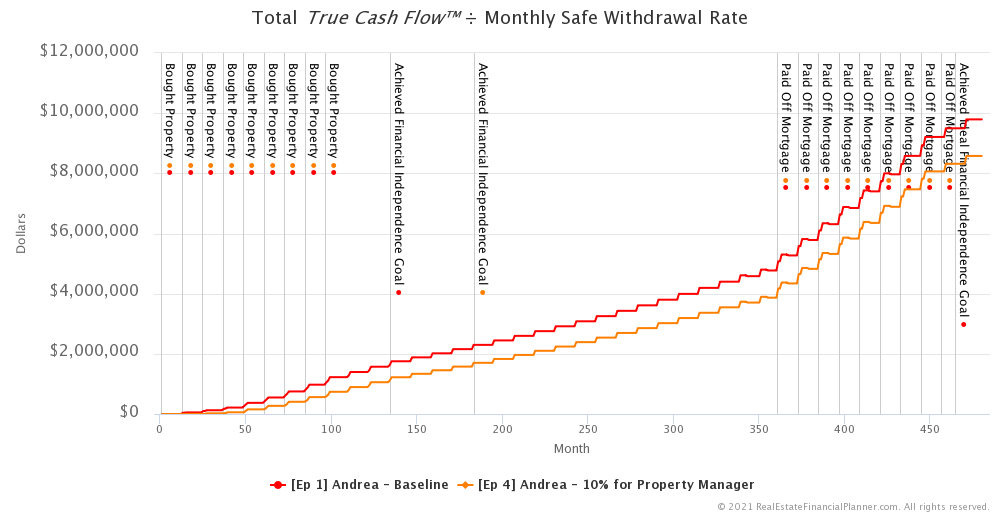
Total True Cash Flow™ ÷ Monthly Safe Withdrawal Rate
True Cash Flow™ on rental properties is similar in some ways to what we can “safely” spend if we had money invested in stocks, bonds, etc and used a safe withdrawal rate. So, as a thought exercise couldn’t we try to see what the value of the True Cash Flow™ is in terms of a lump sum invested in stocks, bonds, etc?
If we took the True Cash Flow™ and divided by the monthly safe withdrawal rate, we could see how much money we would have needed to invest in stocks, bonds, etc to generate the same cash flow. That’s the Chart
By the way, for monthly safe withdrawal rate I mean safe withdrawal rate divided by 12 months.
Of course, we could adjust this same chart for inflation.
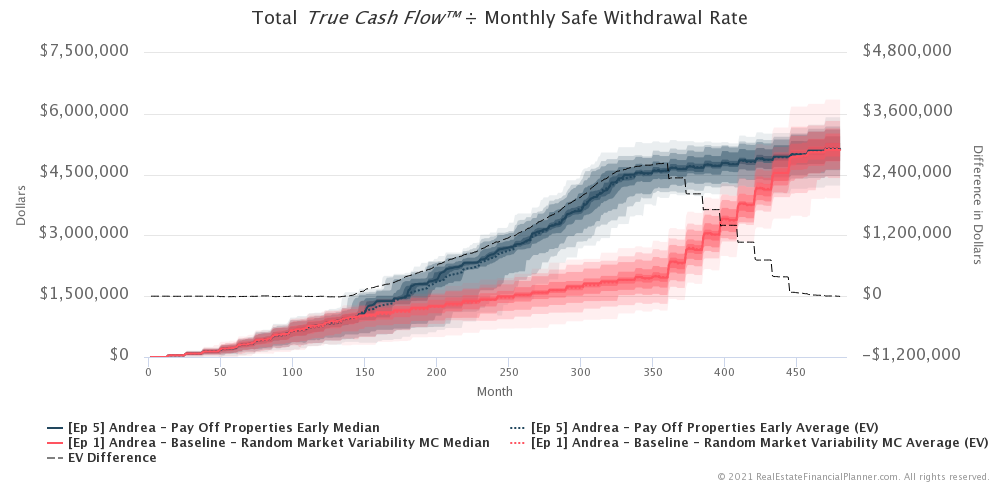
And here’s the advanced monte carlo version with a comparison of the  Expected Value
Class on Cash Flow Power Meter™
Here’s a class I taught on the Cash Flow Power Meter™: