Appreciation Rate is the rate the  Property
Historical Appreciation Rates
We will cover how the Real Estate Financial Planner™ software calculates and uses Appreciation Rate here.
However, before we get there, let’s look at what some historical appreciation rates have been for a sampling of the 552 largest cities in the US have been according to the US census data between 2010 and 2018.
I’ve shown summaries of historical appreciation rates (grouped by states) below.
You could use the historical Appreciation Rate for each city when analyzing properties using the The World’s Greatest Real Estate Deal Analysis Spreadsheet™ or when setting the Appreciation Rate for the Property
However, you should be aware of the dangers of using historical numbers and believing that they will hold true in the future. The short answer is: they may not. I’d go as far as to say, they likely will not.
Alabama Appreciation Rates 2010-2018
There are 7 cities in Alabama. The following is a summary of the home price appreciation for each Alabama city between 2010 and 2018.
| City in Alabama | CoC ROI | Price Appr | Rent Appr |
|---|---|---|---|
| Birmingham, Alabama | 3.71% | -0.23% | 5.77% |
| Dothan, Alabama | 1.14% | 0.4% | 5.55% |
| Hoover, Alabama | 0.43% | 0.43% | 4.33% |
| Huntsville, Alabama | 0.96% | 1.69% | 5.23% |
| Mobile, Alabama | 2.38% | -0.75% | 5.22% |
| Montgomery, Alabama | 3.05% | -0.45% | 5.12% |
| Tuscaloosa, Alabama | 1.34% | 1.49% | 5.36% |
Alaska Appreciation Rates 2010-2018
Here's the data for Anchorage in Alaska.
| City in Alaska | CoC ROI | Price Appr | Rent Appr |
|---|---|---|---|
| Anchorage, Alaska | 1.69% | 1.27% | 3.73% |
Arizona Appreciation Rates 2010-2018
There are 14 cities in Arizona. The following is a summary of the home price appreciation for each Arizona city between 2010 and 2018.
| City in Arizona | CoC ROI | Price Appr | Rent Appr |
|---|---|---|---|
| Avondale, Arizona | 3.66% | -0.98% | 2.06% |
| Casas Adobes, Arizona | 3.19% | -1.76% | 3.54% |
| Chandler, Arizona | 2.61% | 0.05% | 3.82% |
| Gilbert, Arizona | 2.79% | 0.42% | 3.46% |
| Glendale, Arizona | 2.66% | -0.9% | 3.43% |
| Mesa, Arizona | 2.6% | -0.63% | 3.5% |
| Peoria, Arizona | 2.66% | 0.01% | 2.5% |
| Phoenix, Arizona | 2.53% | -0.58% | 3.71% |
| San Tan Valley, Arizona | 3.95% | 0.02% | 3.56% |
| Scottsdale, Arizona | 1.25% | -0.67% | 3.19% |
| Surprise, Arizona | 3.69% | -0.72% | 3.13% |
| Tempe, Arizona | 2.32% | -0.12% | 4.03% |
| Tucson, Arizona | 2.87% | -2.22% | 3.68% |
| Yuma, Arizona | 3.56% | -3.55% | 3.75% |
Arkansas Appreciation Rates 2010-2018
There are 6 cities in Arkansas. The following is a summary of the home price appreciation for each Arkansas city between 2010 and 2018.
| City in Arkansas | CoC ROI | Price Appr | Rent Appr |
|---|---|---|---|
| Fayetteville, Arkansas | 0.09% | 1.25% | 4.11% |
| Fort Smith, Arkansas | 1.23% | 0.68% | 4.77% |
| Jonesboro, Arkansas | 1.06% | 1.65% | 5.11% |
| Little Rock, Arkansas | 0.43% | 0.76% | 4.5% |
| North Little Rock, Arkansas | 1.22% | 0.85% | 5.1% |
| Springdale, Arkansas | 1.17% | -0.18% | 4.14% |
California Appreciation Rates 2010-2018
There are 113 cities in California. The following is a summary of the home price appreciation for each California city between 2010 and 2018.
| City in California | CoC ROI | Price Appr | Rent Appr |
|---|---|---|---|
| Alameda, California | 0.79% | 1.97% | 4.23% |
| Alhambra, California | 1% | 1.24% | 2.68% |
| Anaheim, California | 1.53% | 0.55% | 3.48% |
| Antioch, California | 2.68% | -1.14% | 4.47% |
| Arden-Arcade, California | 1.27% | -0.2% | 2.79% |
| Bakersfield, California | 2.28% | -0.56% | 3.79% |
| Berkeley, California | 0.44% | 2.85% | 4.13% |
| Burbank, California | 1.12% | 1.27% | 3.54% |
| Carlsbad, California | 1.19% | 1.58% | 3.69% |
| Carmichael, California | 1.54% | -0.26% | 3.24% |
| Carson, California | 1.82% | -0.09% | 3.34% |
| Chico, California | 1.59% | -0.74% | 2.87% |
| Chula Vista, California | 1.58% | 0.04% | 3.53% |
| Citrus Heights, California | 2.59% | -0.58% | 3.34% |
| Clovis, California | 2% | -0.55% | 3.88% |
| Concord, California | 1.68% | 0.44% | 3.81% |
| Corona, California | 1.86% | -0.02% | 3% |
| Costa Mesa, California | 1.25% | 0.69% | 3.01% |
| Daly City, California | 1.64% | 1.6% | 5.03% |
| Downey, California | 1.23% | -0.2% | 2.91% |
| East Los Angeles, California | 1.33% | 0.07% | 3.27% |
| El Cajon, California | 1.55% | 0.72% | 3.48% |
| El Monte, California | 1.2% | 0.44% | 2.64% |
| Elk Grove, California | 2.54% | 0.45% | 2.8% |
| Escondido, California | 1.74% | -0.01% | 3.41% |
| Fairfield, California | 2.29% | -1.06% | 4.21% |
| Folsom, California | 1.63% | 0.35% | 3.49% |
| Fontana, California | 1.82% | -0.09% | 3.25% |
| Fremont, California | 1.23% | 3.31% | 5.31% |
| Fresno, California | 2.45% | -1.38% | 3.42% |
| Fullerton, California | 1.21% | 0.56% | 2.86% |
| Garden Grove, California | 1.47% | 0.91% | 2.36% |
| Glendale, California | 0.93% | 1.27% | 3.58% |
| Hawthorne, California | 0.92% | -0.07% | 2.84% |
| Hayward, California | 1.82% | 1.46% | 4.64% |
| Hemet, California | 3.38% | -2.09% | 2.97% |
| Hesperia, California | 3.36% | -2.23% | 3.04% |
| Huntington Beach, California | 1.27% | 0.24% | 3.07% |
| Indio, California | 1.6% | -1.43% | 3.53% |
| Inglewood, California | 1.48% | 0.24% | 3.73% |
| Irvine, California | 1.43% | 1.66% | 3.11% |
| Laguna Niguel, California | 1.54% | 0.56% | 3.19% |
| Lake Forest, California | 1.81% | 0.47% | 2.35% |
| Lakewood, California | 1.79% | 0.4% | 3.46% |
| Lancaster, California | 2.47% | -1.2% | 2.24% |
| Livermore, California | 1.32% | 1.53% | 5.44% |
| Long Beach, California | 1.1% | 0.14% | 3.18% |
| Los Angeles, California | 0.99% | 0.77% | 3.95% |
| Menifee, California | 2.59% | 1.14% | 4.42% |
| Merced, California | 2.61% | -1.12% | 3.83% |
| Mission Viejo, California | 1.94% | 0.67% | 3.76% |
| Modesto, California | 2.56% | -1.14% | 3.56% |
| Moreno Valley, California | 2.97% | -0.52% | 2.53% |
| Mountain View, California | 0.76% | 4.99% | 6.14% |
| Murrieta, California | 2.39% | 0.27% | 3.55% |
| Napa, California | 1.41% | 0.88% | 4.43% |
| Newport Beach, California | 0.26% | 6.67% | 2.2% |
| Norwalk, California | 2.08% | 0.28% | 3.25% |
| Oakland, California | 0.7% | 1.85% | 4.31% |
| Oceanside, California | 2.2% | 0.39% | 3.71% |
| Ontario, California | 2.57% | -0.36% | 3.11% |
| Orange, California | 1.41% | 0.58% | 3.1% |
| Oxnard, California | 1.99% | -1.02% | 3.35% |
| Palmdale, California | 2.69% | -1.39% | 3.84% |
| Palo Alto, California | 0.4% | 0% | 5.19% |
| Pasadena, California | 0.93% | 1.25% | 3.64% |
| Pleasanton, California | 1.15% | 1.87% | 5.06% |
| Pomona, California | 1.91% | 0.05% | 3.55% |
| Rancho Cordova, California | 2.19% | -0.21% | 3.43% |
| Rancho Cucamonga, California | 2.05% | 0.3% | 3.2% |
| Redding, California | 2.33% | -1.34% | 4.35% |
| Redondo Beach, California | 1.01% | 1.21% | 3.27% |
| Redwood City, California | 0.84% | 3.59% | 6.11% |
| Rialto, California | 2.46% | -1.01% | 2.83% |
| Richmond, California | 1.53% | 0.19% | 3.35% |
| Riverside, California | 2.14% | -0.36% | 3.44% |
| Roseville, California | 1.82% | 0.76% | 4.1% |
| Sacramento, California | 2.05% | -0.27% | 3.62% |
| Salinas, California | 1.83% | -1.11% | 3.68% |
| San Bernardino, California | 2.67% | -1.71% | 2.72% |
| San Diego, California | 1.48% | 1.22% | 3.46% |
| San Francisco, California | 0.59% | 2.6% | 4.04% |
| San Jose, California | 1.09% | 2.36% | 5.15% |
| San Leandro, California | 1.27% | 0.71% | 3.86% |
| San Marcos, California | 1.45% | 0.27% | 3.42% |
| San Mateo, California | 1.07% | 2.99% | 5.57% |
| San Ramon, California | 0.86% | 1.94% | 4.94% |
| Santa Ana, California | 1.87% | 0.5% | 2.92% |
| Santa Barbara, California | 0.71% | 0.02% | 3.18% |
| Santa Clara, California | 1.22% | 4.04% | 5.85% |
| Santa Clarita, California | 1.88% | 0.52% | 3.23% |
| Santa Maria, California | 2.53% | -0.8% | 3.84% |
| Santa Monica, California | 0.33% | 2.45% | 2.86% |
| Santa Rosa, California | 1.68% | 0.33% | 4.32% |
| Simi Valley, California | 1.98% | -0.16% | 3.02% |
| Stockton, California | 2.36% | -1.58% | 3.35% |
| Sunnyvale, California | 0.99% | 4.9% | 6.17% |
| Temecula, California | 2.35% | 1.05% | 3.93% |
| Thousand Oaks, California | 1.55% | 0.21% | 2.39% |
| Torrance, California | 1.01% | 0.85% | 2.96% |
| Tracy, California | 2.26% | 0.85% | 4.27% |
| Tustin, California | 1.37% | 0.63% | 2.91% |
| Upland, California | 1.51% | -0.14% | 3.16% |
| Vacaville, California | 2.31% | 0.1% | 3.33% |
| Vallejo, California | 2.44% | -0.94% | 3.57% |
| Ventura, California | 1.62% | -0.17% | 2.64% |
| Victorville, California | 3.59% | -1.72% | 3.57% |
| Visalia, California | 2.54% | -0.75% | 3.09% |
| Vista, California | 1.96% | 0.47% | 3.38% |
| Walnut Creek, California | 1.2% | 0.8% | 4.6% |
| West Covina, California | 1.81% | 0.53% | 3.17% |
| Westminster, California | 1.21% | 0.56% | 2.52% |
| Whittier, California | 1.1% | 0.08% | 3.09% |
Colorado Appreciation Rates 2010-2018
There are 17 cities in Colorado. The following is a summary of the home price appreciation for each Colorado city between 2010 and 2018.
| City in Colorado | CoC ROI | Price Appr | Rent Appr |
|---|---|---|---|
| Arvada, Colorado | 1.96% | 4.19% | 5.48% |
| Aurora, Colorado | 2.91% | 3.56% | 6.04% |
| Boulder, Colorado | 0.88% | 3.08% | 4.96% |
| Broomfield, Colorado | 2.31% | 3.57% | 6.95% |
| Centennial, Colorado | 2.43% | 3.68% | 5.11% |
| Colorado Springs, Colorado | 2.56% | 1.49% | 5.26% |
| Denver, Colorado | 1.8% | 4.33% | 6.2% |
| Fort Collins, Colorado | 2.08% | 3.65% | 5.81% |
| Grand Junction, Colorado | 2.33% | -0.38% | 3.8% |
| Greeley, Colorado | 2.44% | 2.52% | 5.28% |
| Highlands Ranch, Colorado | 2.53% | 3.26% | 5.44% |
| Lakewood, Colorado | 2.07% | 3.9% | 5.52% |
| Longmont, Colorado | 2.03% | 3.44% | 4.74% |
| Loveland, Colorado | 2.46% | 3.14% | 5.68% |
| Pueblo, Colorado | 3.55% | 0.3% | 4.63% |
| Thornton, Colorado | 2.79% | 3.13% | 5.6% |
| Westminster, Colorado | 2.61% | 3.29% | 5.96% |
Connecticut Appreciation Rates 2010-2018
There are 9 cities in Connecticut. The following is a summary of the home price appreciation for each Connecticut city between 2010 and 2018.
| City in Connecticut | CoC ROI | Price Appr | Rent Appr |
|---|---|---|---|
| Bridgeport, Connecticut | 1.42% | -3.8% | 4% |
| Danbury, Connecticut | 2.17% | -1.79% | 3.97% |
| Hartford, Connecticut | 1.77% | -1.69% | 4.15% |
| Meriden, Connecticut | 1.32% | -2.09% | 3.43% |
| New Britain, Connecticut | 1.46% | -1.28% | 4% |
| New Haven, Connecticut | 1.91% | -1.68% | 3.84% |
| Norwalk, Connecticut | 1.23% | -1.24% | 4.16% |
| Stamford, Connecticut | 1.1% | -1.05% | 3.48% |
| Waterbury, Connecticut | 1.63% | -2.83% | 3.59% |
Delaware Appreciation Rates 2010-2018
Here's the data for Wilmington in Delaware.
| City in Delaware | CoC ROI | Price Appr | Rent Appr |
|---|---|---|---|
| Wilmington, Delaware | 3.07% | -1.02% | 3.94% |
District of Columbia Appreciation Rates 2010-2018
Here's the data for Washington in District of Columbia.
| City in District of Columbia | CoC ROI | Price Appr | Rent Appr |
|---|---|---|---|
| Washington, District of Columbia | 1.45% | 2.51% | 4.85% |
Florida Appreciation Rates 2010-2018
There are 46 cities in Florida. The following is a summary of the home price appreciation for each Florida city between 2010 and 2018.
| City in Florida | CoC ROI | Price Appr | Rent Appr |
|---|---|---|---|
| Alafaya, Florida | 2.14% | -1.49% | 4.28% |
| Boca Raton, Florida | -0.12% | 0.22% | 3.46% |
| Boynton Beach, Florida | 3.32% | -1.87% | 3.66% |
| Brandon, Florida | 2.95% | -1.15% | 3.92% |
| Cape Coral, Florida | 1.74% | -0.33% | 3.37% |
| Clearwater, Florida | 1.76% | -0.78% | 3.66% |
| Coral Springs, Florida | 0.63% | -0.49% | 2.73% |
| Davie, Florida | 1.08% | -1.28% | 3.77% |
| Daytona Beach, Florida | 2.4% | -2.27% | 3.71% |
| Deerfield Beach, Florida | 4.07% | -3.81% | 3.03% |
| Delray Beach, Florida | 1.77% | -0.59% | 3.03% |
| Deltona, Florida | 3.92% | -2.95% | 2.82% |
| Fort Lauderdale, Florida | 0.41% | -0.17% | 3.76% |
| Fort Myers, Florida | 0.55% | 1.33% | 3.23% |
| Gainesville, Florida | 1.12% | -1.1% | 3.49% |
| Hialeah, Florida | 2.02% | -0.97% | 3.61% |
| Hollywood, Florida | 1.06% | -0.62% | 3.46% |
| Jacksonville, Florida | 2.32% | -1.22% | 3.98% |
| Jupiter, Florida | 1% | 0.58% | 3.26% |
| Kendall, Florida | 0.42% | 0.6% | 3.15% |
| Lakeland, Florida | 2.79% | -2.36% | 3.9% |
| Largo, Florida | 4.04% | -3.81% | 3.57% |
| Lehigh Acres, Florida | 3.47% | -1.73% | 2.74% |
| Melbourne, Florida | 2.3% | -1.28% | 2.94% |
| Miami, Florida | 0.28% | 0.07% | 4.28% |
| Miami Beach, Florida | -0.23% | 1.8% | 4.24% |
| Miami Gardens, Florida | 2.88% | -2.1% | 3.99% |
| Miramar, Florida | 1.27% | -0.89% | 1.69% |
| Orlando, Florida | 1.4% | -0.42% | 3.76% |
| Palm Bay, Florida | 3.7% | -1.98% | 3.33% |
| Palm Coast, Florida | 2.51% | -1.07% | 3.74% |
| Palm Harbor, Florida | 2.06% | -0.79% | 4.08% |
| Pembroke Pines, Florida | 1.68% | -1.41% | 2.38% |
| Plantation, Florida | 1.29% | -0.35% | 3.65% |
| Pompano Beach, Florida | 2.31% | -2.37% | 3.28% |
| Port Orange, Florida | 2.79% | -2.61% | 3.85% |
| Port St Lucie, Florida | 2.98% | -0.74% | 3.43% |
| Riverview, Florida | 2.5% | -1.05% | 3.23% |
| Spring Hill, Florida | 3.51% | -2.58% | 3.3% |
| St Petersburg, Florida | 1.9% | -0.25% | 4.37% |
| Sunrise, Florida | 3.79% | -2.42% | 3.32% |
| Tallahassee, Florida | 1.3% | -0.22% | 4.19% |
| Tamarac, Florida | 4.01% | -1.76% | 2.83% |
| Tampa, Florida | 1.33% | 0.23% | 4.37% |
| Town n Country, Florida | 3% | -2.21% | 3.48% |
| West Palm Beach, Florida | 1.17% | -0.28% | 3.58% |
Georgia Appreciation Rates 2010-2018
There are 10 cities in Georgia. The following is a summary of the home price appreciation for each Georgia city between 2010 and 2018.
| City in Georgia | CoC ROI | Price Appr | Rent Appr |
|---|---|---|---|
| Albany, Georgia | 2.87% | -0.56% | 5.64% |
| Athens, Georgia | 2.1% | 0.21% | 4.12% |
| Atlanta, Georgia | 1.29% | 0.73% | 4.68% |
| Augusta, Georgia | 3.71% | -0.26% | 5.34% |
| Columbus, Georgia | 2.99% | 0.16% | 5.47% |
| Johns Creek, Georgia | 1.46% | 1.18% | 4.37% |
| Roswell, Georgia | 0.83% | 1.4% | 4.52% |
| Sandy Springs, Georgia | 0.31% | 0.23% | 4.4% |
| Savannah, Georgia | 3% | -0.13% | 4.79% |
| Warner Robins, Georgia | 4.15% | -0.65% | 4.56% |
Hawaii Appreciation Rates 2010-2018
Here's the data for Honolulu in Hawaii.
| City in Hawaii | CoC ROI | Price Appr | Rent Appr |
|---|---|---|---|
| Honolulu, Hawaii | 1.48% | 2.45% | 3.85% |
Idaho Appreciation Rates 2010-2018
There are 3 cities in Idaho. The following is a summary of the home price appreciation for each Idaho city between 2010 and 2018.
| City in Idaho | CoC ROI | Price Appr | Rent Appr |
|---|---|---|---|
| Boise, Idaho | 1.99% | 1.1% | 3.81% |
| Meridian, Idaho | 2.44% | 1.1% | 2.2% |
| Nampa, Idaho | 3.41% | 0.14% | 4% |
Illinois Appreciation Rates 2010-2018
There are 16 cities in Illinois. The following is a summary of the home price appreciation for each Illinois city between 2010 and 2018.
| City in Illinois | CoC ROI | Price Appr | Rent Appr |
|---|---|---|---|
| Arlington Heights, Illinois | 0.15% | -0.87% | 3.56% |
| Aurora, Illinois | 1.91% | -1.74% | 4.27% |
| Bloomington, Illinois | 0.47% | 0.36% | 3.99% |
| Champaign, Illinois | 1.27% | 0.4% | 4.42% |
| Chicago, Illinois | 1.05% | -1.41% | 3.95% |
| Decatur, Illinois | 2.9% | -0.29% | 4.3% |
| Elgin, Illinois | 1.1% | -2.17% | 3.7% |
| Evanston, Illinois | 0.03% | -0.52% | 3.33% |
| Joliet, Illinois | 1.21% | -1.82% | 4.35% |
| Naperville, Illinois | -0.09% | -0.05% | 4.07% |
| Palatine, Illinois | 0.44% | -1.14% | 2.71% |
| Peoria, Illinois | 1.05% | 0.3% | 4.47% |
| Rockford, Illinois | 2.02% | -2.44% | 3.92% |
| Schaumburg, Illinois | 1.57% | -0.76% | 3.36% |
| Springfield, Illinois | 1.82% | 0.9% | 4.46% |
| Waukegan, Illinois | 1.84% | -3.02% | 3.1% |
Indiana Appreciation Rates 2010-2018
There are 12 cities in Indiana. The following is a summary of the home price appreciation for each Indiana city between 2010 and 2018.
| City in Indiana | CoC ROI | Price Appr | Rent Appr |
|---|---|---|---|
| Bloomington, Indiana | 1.76% | 1.48% | 4.06% |
| Carmel, Indiana | 0.74% | 1.39% | 3.99% |
| Evansville, Indiana | 4.01% | 0.16% | 4.97% |
| Fishers, Indiana | 1.63% | 2.15% | 4.12% |
| Fort Wayne, Indiana | 2.88% | 0.54% | 4.1% |
| Gary, Indiana | 5.68% | -1.43% | 4.35% |
| Hammond, Indiana | 5.18% | -1.32% | 4.32% |
| Indianapolis, Indiana | 2.85% | 0.28% | 4.42% |
| Kokomo, Indiana | 3.93% | -0.31% | 4.2% |
| Lafayette, Indiana | 3.8% | 0.23% | 3.82% |
| Muncie, Indiana | 5.28% | -0.9% | 4.09% |
| South Bend, Indiana | 4.05% | -0.89% | 3.52% |
Iowa Appreciation Rates 2010-2018
There are 8 cities in Iowa. The following is a summary of the home price appreciation for each Iowa city between 2010 and 2018.
| City in Iowa | CoC ROI | Price Appr | Rent Appr |
|---|---|---|---|
| Ames, Iowa | 1.06% | 1.4% | 4.02% |
| Cedar Rapids, Iowa | 0.91% | 0.7% | 3.99% |
| Davenport, Iowa | 1.1% | 0.72% | 4.4% |
| Des Moines, Iowa | 1.75% | 0.59% | 3.73% |
| Iowa City, Iowa | 0.81% | 1.35% | 4.25% |
| Sioux City, Iowa | 2.27% | 1.93% | 5.29% |
| Waterloo, Iowa | 1.88% | 0.76% | 4.57% |
| West Des Moines, Iowa | 0.9% | 1.42% | 3.53% |
Kansas Appreciation Rates 2010-2018
There are 6 cities in Kansas. The following is a summary of the home price appreciation for each Kansas city between 2010 and 2018.
| City in Kansas | CoC ROI | Price Appr | Rent Appr |
|---|---|---|---|
| Kansas City, Kansas | 3.01% | -1.62% | 5.91% |
| Lawrence, Kansas | 0.25% | 0.66% | 3.81% |
| Olathe, Kansas | 0.2% | 1.52% | 4.3% |
| Overland Park, Kansas | 0.22% | 1.38% | 4.15% |
| Topeka, Kansas | 1.47% | 0.45% | 5.72% |
| Wichita, Kansas | 1.13% | 1.01% | 5.65% |
Kentucky Appreciation Rates 2010-2018
There are 3 cities in Kentucky. The following is a summary of the home price appreciation for each Kentucky city between 2010 and 2018.
| City in Kentucky | CoC ROI | Price Appr | Rent Appr |
|---|---|---|---|
| Lexington, Kentucky | 1.72% | 1.32% | 4.39% |
| Louisville, Kentucky | 2.01% | 0.8% | 4.85% |
| Owensboro, Kentucky | 2.6% | 1.14% | 6.17% |
Louisiana Appreciation Rates 2010-2018
There are 7 cities in Louisiana. The following is a summary of the home price appreciation for each Louisiana city between 2010 and 2018.
| City in Louisiana | CoC ROI | Price Appr | Rent Appr |
|---|---|---|---|
| Baton Rouge, Louisiana | 0.69% | 0.89% | 4.66% |
| Bossier City, Louisiana | 1.22% | 1.72% | 5.36% |
| Lafayette, Louisiana | 0.37% | 1.42% | 4.8% |
| Lake Charles, Louisiana | 1.25% | 2.05% | 5.24% |
| Metairie, Louisiana | 0.21% | 0.67% | 2.51% |
| New Orleans, Louisiana | 0.02% | 1.1% | 3.1% |
| Shreveport, Louisiana | 0.84% | 1.48% | 5% |
Maine Appreciation Rates 2010-2018
Here's the data for Portland in Maine.
| City in Maine | CoC ROI | Price Appr | Rent Appr |
|---|---|---|---|
| Portland, Maine | 1.24% | 0.99% | 3.57% |
Maryland Appreciation Rates 2010-2018
There are 10 cities in Maryland. The following is a summary of the home price appreciation for each Maryland city between 2010 and 2018.
| City in Maryland | CoC ROI | Price Appr | Rent Appr |
|---|---|---|---|
| Baltimore, Maryland | 3.07% | -1% | 4.92% |
| Bethesda, Maryland | 0.66% | 0.86% | 2.28% |
| Columbia, Maryland | 2.2% | -0.38% | 3.81% |
| Ellicott City, Maryland | 1.04% | -0.61% | 4.14% |
| Frederick, Maryland | 2.46% | -1.39% | 3.86% |
| Germantown, Maryland | 3.07% | -0.68% | 3.71% |
| Glen Burnie, Maryland | 2.78% | -1.39% | 3.96% |
| Rockville, Maryland | 1.81% | 0.27% | 2.96% |
| Silver Spring, Maryland | 1.59% | 0.68% | 3.36% |
| Waldorf, Maryland | 3.89% | -2.25% | 4.37% |
Massachusetts Appreciation Rates 2010-2018
There are 14 cities in Massachusetts. The following is a summary of the home price appreciation for each Massachusetts city between 2010 and 2018.
| City in Massachusetts | CoC ROI | Price Appr | Rent Appr |
|---|---|---|---|
| Boston, Massachusetts | 1.7% | 2.35% | 4.09% |
| Brockton, Massachusetts | 1.94% | -1.19% | 2.81% |
| Cambridge, Massachusetts | 1.68% | 3.17% | 4.71% |
| Fall River, Massachusetts | 1.15% | -1.1% | 4.34% |
| Framingham, Massachusetts | 1.16% | 0.44% | 3.76% |
| Lawrence, Massachusetts | 2.14% | -0.38% | 4.16% |
| Lowell, Massachusetts | 1.97% | 0.11% | 3.62% |
| Lynn, Massachusetts | 1.45% | 0.36% | 3.77% |
| New Bedford, Massachusetts | 1.2% | -1.42% | 3.61% |
| Newton, Massachusetts | 0.47% | 2.43% | 3.09% |
| Quincy, Massachusetts | 1.39% | 1.39% | 3.92% |
| Somerville, Massachusetts | 1.41% | 3.58% | 4.61% |
| Springfield, Massachusetts | 2.32% | -0.33% | 3.58% |
| Worcester, Massachusetts | 1.99% | -1.24% | 4.13% |
Michigan Appreciation Rates 2010-2018
There are 18 cities in Michigan. The following is a summary of the home price appreciation for each Michigan city between 2010 and 2018.
| City in Michigan | CoC ROI | Price Appr | Rent Appr |
|---|---|---|---|
| Ann Arbor, Michigan | 0.58% | 2.36% | 3.79% |
| Dearborn, Michigan | 2.67% | -1.06% | 3.84% |
| Detroit, Michigan | 9.06% | -6.98% | 4.35% |
| Farmington Hills, Michigan | 1.03% | 0.22% | 3.63% |
| Flint, Michigan | 14.08% | -8.82% | 5.29% |
| Grand Rapids, Michigan | 3.16% | 0.93% | 4.64% |
| Kalamazoo, Michigan | 2.68% | -0.54% | 3.31% |
| Lansing, Michigan | 4.3% | -2.85% | 3.8% |
| Livonia, Michigan | 2.17% | -0.32% | 3.78% |
| Rochester Hills, Michigan | 1.42% | 1.35% | 4.12% |
| Royal Oak, Michigan | 1.44% | 1.56% | 3.92% |
| Southfield, Michigan | 2.63% | -1.26% | 3.23% |
| St Clair Shores, Michigan | 3.76% | -1.2% | 4.76% |
| Sterling Heights, Michigan | 2.19% | -0.1% | 4.38% |
| Troy, Michigan | 0.9% | 1.04% | 3.19% |
| Warren, Michigan | 3.5% | -1.62% | 4.06% |
| Westland, Michigan | 3.09% | -1.99% | 3.09% |
| Wyoming, Michigan | 3.11% | -0.38% | 3.49% |
Minnesota Appreciation Rates 2010-2018
There are 11 cities in Minnesota. The following is a summary of the home price appreciation for each Minnesota city between 2010 and 2018.
| City in Minnesota | CoC ROI | Price Appr | Rent Appr |
|---|---|---|---|
| Bloomington, Minnesota | 1.8% | -0.25% | 3.35% |
| Brooklyn Park, Minnesota | 1.5% | -1% | 3.42% |
| Duluth, Minnesota | 2.03% | 0.09% | 2.79% |
| Eagan, Minnesota | 1.56% | 0.66% | 3.26% |
| Maple Grove, Minnesota | 2.2% | 0.62% | 3.68% |
| Minneapolis, Minnesota | 1.21% | 0.23% | 3.59% |
| Plymouth, Minnesota | 1.11% | 0.3% | 3.64% |
| Rochester, Minnesota | 1.99% | 1.21% | 4.1% |
| St Cloud, Minnesota | 2.16% | -1.11% | 2.54% |
| St Paul, Minnesota | 1.63% | -0.61% | 3.43% |
| Woodbury, Minnesota | 2.05% | 0.47% | 4.12% |
Mississippi Appreciation Rates 2010-2018
There are 2 cities in Mississippi. The following is a summary of the home price appreciation for each Mississippi city between 2010 and 2018.
| City in Mississippi | CoC ROI | Price Appr | Rent Appr |
|---|---|---|---|
| Gulfport, Mississippi | 1.75% | -1.16% | 2.55% |
| Jackson, Mississippi | 3.05% | -0.38% | 4.66% |
Missouri Appreciation Rates 2010-2018
There are 9 cities in Missouri. The following is a summary of the home price appreciation for each Missouri city between 2010 and 2018.
| City in Missouri | CoC ROI | Price Appr | Rent Appr |
|---|---|---|---|
| Columbia, Missouri | 1% | 1.01% | 4.16% |
| Independence, Missouri | 3.21% | -0.6% | 5.26% |
| Kansas City, Missouri | 1.71% | 0.27% | 5.05% |
| Lee's Summit, Missouri | 0.84% | 1.21% | 3.36% |
| O'Fallon, Missouri | 1.27% | 0.29% | 4.15% |
| Springfield, Missouri | 2.31% | 1.3% | 4.48% |
| St Charles, Missouri | 1.08% | -0.3% | 4.33% |
| St Joseph, Missouri | 2.37% | 0.56% | 5.32% |
| St Louis, Missouri | 1.95% | -0.29% | 5.46% |
Montana Appreciation Rates 2010-2018
There are 3 cities in Montana. The following is a summary of the home price appreciation for each Montana city between 2010 and 2018.
| City in Montana | CoC ROI | Price Appr | Rent Appr |
|---|---|---|---|
| Billings, Montana | 1.52% | 2.2% | 4.69% |
| Great Falls, Montana | 1.43% | 1.66% | 4.72% |
| Missoula, Montana | 0.69% | 1.05% | 3.21% |
Nebraska Appreciation Rates 2010-2018
There are 2 cities in Nebraska. The following is a summary of the home price appreciation for each Nebraska city between 2010 and 2018.
| City in Nebraska | CoC ROI | Price Appr | Rent Appr |
|---|---|---|---|
| Lincoln, Nebraska | 0.51% | 1.3% | 4.17% |
| Omaha, Nebraska | 0.85% | 1.21% | 4.69% |
Nevada Appreciation Rates 2010-2018
There are 9 cities in Nevada. The following is a summary of the home price appreciation for each Nevada city between 2010 and 2018.
| City in Nevada | CoC ROI | Price Appr | Rent Appr |
|---|---|---|---|
| Enterprise, Nevada | 2.85% | -0.84% | 1.82% |
| Henderson, Nevada | 2.42% | -0.86% | 2.03% |
| Las Vegas, Nevada | 2.59% | -1.04% | 2.49% |
| North Las Vegas, Nevada | 3.55% | -1.61% | 2.42% |
| Paradise, Nevada | 1.88% | -1.58% | 1.83% |
| Reno, Nevada | 1.71% | 0.08% | 2.85% |
| Sparks, Nevada | 2.12% | -0.08% | 2.97% |
| Spring Valley, Nevada | 2.8% | -1.63% | 1.76% |
| Sunrise Manor, Nevada | 3.54% | -3.16% | 2.07% |
New Hampshire Appreciation Rates 2010-2018
There are 2 cities in New Hampshire. The following is a summary of the home price appreciation for each New Hampshire city between 2010 and 2018.
| City in New Hampshire | CoC ROI | Price Appr | Rent Appr |
|---|---|---|---|
| Manchester, New Hampshire | 1.56% | -0.97% | 3.05% |
| Nashua, New Hampshire | 1.48% | -0.44% | 3.09% |
New Jersey Appreciation Rates 2010-2018
There are 8 cities in New Jersey. The following is a summary of the home price appreciation for each New Jersey city between 2010 and 2018.
| City in New Jersey | CoC ROI | Price Appr | Rent Appr |
|---|---|---|---|
| Clifton, New Jersey | 0.49% | -1.21% | 3.49% |
| Elizabeth, New Jersey | -0.03% | -3.16% | 3.26% |
| Hoboken, New Jersey | 1.3% | 2.13% | 4.21% |
| Jersey City, New Jersey | 0.8% | -0.29% | 3.95% |
| Newark, New Jersey | 0.72% | -2.62% | 3.41% |
| Paterson, New Jersey | 0.22% | -3.8% | 3.46% |
| Toms River, New Jersey | 2.01% | -2.01% | 3.39% |
| Trenton, New Jersey | 3.28% | -4.26% | 3.64% |
New Mexico Appreciation Rates 2010-2018
There are 4 cities in New Mexico. The following is a summary of the home price appreciation for each New Mexico city between 2010 and 2018.
| City in New Mexico | CoC ROI | Price Appr | Rent Appr |
|---|---|---|---|
| Albuquerque, New Mexico | 1.5% | 0.01% | 3.49% |
| Las Cruces, New Mexico | 2.32% | -0.67% | 3.76% |
| Rio Rancho, New Mexico | 3% | 0.37% | 3.28% |
| Santa Fe, New Mexico | 1.73% | -1.43% | 3.06% |
New York Appreciation Rates 2010-2018
There are 10 cities in New York. The following is a summary of the home price appreciation for each New York city between 2010 and 2018.
| City in New York | CoC ROI | Price Appr | Rent Appr |
|---|---|---|---|
| Albany, New York | 0.99% | -0.78% | 3.78% |
| Buffalo, New York | 4.9% | 1.56% | 5.59% |
| Cheektowaga, New York | 2.23% | 1.3% | 3.82% |
| Mount Vernon, New York | -0.01% | -1.98% | 3.47% |
| New Rochelle, New York | 0.13% | -1.24% | 3.49% |
| New York, New York | 0.94% | 1.04% | 4.25% |
| Rochester, New York | 3.99% | 0.97% | 4.02% |
| Syracuse, New York | 2.81% | 0.98% | 4.38% |
| Tonawanda, New York | 1.84% | 1.81% | 4.33% |
| Yonkers, New York | 0.21% | -1.29% | 3.74% |
North Carolina Appreciation Rates 2010-2018
There are 13 cities in North Carolina. The following is a summary of the home price appreciation for each North Carolina city between 2010 and 2018.
| City in North Carolina | CoC ROI | Price Appr | Rent Appr |
|---|---|---|---|
| Asheville, North Carolina | 2.05% | 2.16% | 4.93% |
| Cary, North Carolina | 1.53% | 1.53% | 5.04% |
| Charlotte, North Carolina | 2.74% | 1.56% | 5.17% |
| Concord, North Carolina | 2.12% | 1% | 4.54% |
| Durham, North Carolina | 2.06% | 1.71% | 4.78% |
| Fayetteville, North Carolina | 3.67% | 0.79% | 4.22% |
| Gastonia, North Carolina | 2.62% | 0.43% | 5.11% |
| Greensboro, North Carolina | 2.38% | 0.4% | 3.87% |
| Greenville, North Carolina | 2.35% | 0.5% | 5% |
| High Point, North Carolina | 2.83% | -0.11% | 4.89% |
| Raleigh, North Carolina | 2.18% | 1.87% | 4.96% |
| Wilmington, North Carolina | 1.74% | -0.23% | 3.6% |
| Winston-Salem, North Carolina | 2.31% | 0.12% | 4.31% |
North Dakota Appreciation Rates 2010-2018
There are 2 cities in North Dakota. The following is a summary of the home price appreciation for each North Dakota city between 2010 and 2018.
| City in North Dakota | CoC ROI | Price Appr | Rent Appr |
|---|---|---|---|
| Bismarck, North Dakota | 0.58% | 4.94% | 5.5% |
| Fargo, North Dakota | 0.58% | 3.29% | 4.26% |
Ohio Appreciation Rates 2010-2018
There are 11 cities in Ohio. The following is a summary of the home price appreciation for each Ohio city between 2010 and 2018.
| City in Ohio | CoC ROI | Price Appr | Rent Appr |
|---|---|---|---|
| Akron, Ohio | 4.04% | -1.49% | 4.01% |
| Canton, Ohio | 4.86% | -1.94% | 4.55% |
| Cincinnati, Ohio | 1.52% | -0.61% | 4.05% |
| Cleveland, Ohio | 4.8% | -3.02% | 4.16% |
| Columbus, Ohio | 2.53% | 0.01% | 4.77% |
| Dayton, Ohio | 4.42% | -2.34% | 4.53% |
| Kettering, Ohio | 1.93% | -0.42% | 3.9% |
| Lorain, Ohio | 3.65% | -2.41% | 3.99% |
| Parma, Ohio | 2.72% | -1.82% | 3.34% |
| Toledo, Ohio | 3.74% | -2.38% | 4.4% |
| Youngstown, Ohio | 8.69% | -2.88% | 6% |
Oklahoma Appreciation Rates 2010-2018
There are 6 cities in Oklahoma. The following is a summary of the home price appreciation for each Oklahoma city between 2010 and 2018.
| City in Oklahoma | CoC ROI | Price Appr | Rent Appr |
|---|---|---|---|
| Broken Arrow, Oklahoma | 0.92% | 1.22% | 5.15% |
| Edmond, Oklahoma | -0.48% | 2.13% | 5.33% |
| Lawton, Oklahoma | 1% | 1.45% | 5.74% |
| Norman, Oklahoma | -0.54% | 2.13% | 4.68% |
| Oklahoma City, Oklahoma | -0.1% | 1.71% | 5.78% |
| Tulsa, Oklahoma | 0.22% | 1.11% | 4.76% |
Oregon Appreciation Rates 2010-2018
There are 8 cities in Oregon. The following is a summary of the home price appreciation for each Oregon city between 2010 and 2018.
| City in Oregon | CoC ROI | Price Appr | Rent Appr |
|---|---|---|---|
| Beaverton, Oregon | 1.45% | 1.31% | 5.83% |
| Bend, Oregon | 1.56% | 1.05% | 5.25% |
| Eugene, Oregon | 1.46% | 0.65% | 3.99% |
| Gresham, Oregon | 1.84% | 1% | 4.96% |
| Hillsboro, Oregon | 2.28% | 1.93% | 5.75% |
| Medford, Oregon | 1.76% | -0.51% | 3.53% |
| Portland, Oregon | 1.27% | 2.92% | 5.7% |
| Salem, Oregon | 1.59% | 0.77% | 4.93% |
Pennsylvania Appreciation Rates 2010-2018
There are 7 cities in Pennsylvania. The following is a summary of the home price appreciation for each Pennsylvania city between 2010 and 2018.
| City in Pennsylvania | CoC ROI | Price Appr | Rent Appr |
|---|---|---|---|
| Allentown, Pennsylvania | 3.17% | -1.52% | 4.07% |
| Bethlehem, Pennsylvania | 1.98% | -0.39% | 4.11% |
| Erie, Pennsylvania | 2.61% | 0.53% | 4.9% |
| Philadelphia, Pennsylvania | 3.39% | 0.1% | 4.88% |
| Pittsburgh, Pennsylvania | 4.17% | 2.55% | 5.45% |
| Reading, Pennsylvania | 5.07% | -0.02% | 4.66% |
| Scranton, Pennsylvania | 3.05% | -0.84% | 5.46% |
Rhode Island Appreciation Rates 2010-2018
There are 4 cities in Rhode Island. The following is a summary of the home price appreciation for each Rhode Island city between 2010 and 2018.
| City in Rhode Island | CoC ROI | Price Appr | Rent Appr |
|---|---|---|---|
| Cranston, Rhode Island | 1.16% | -1.59% | 2.52% |
| Pawtucket, Rhode Island | 1.61% | -2.82% | 3.08% |
| Providence, Rhode Island | 1.61% | -2.56% | 3.02% |
| Warwick, Rhode Island | 2.23% | -1.11% | 2.56% |
South Carolina Appreciation Rates 2010-2018
There are 6 cities in South Carolina. The following is a summary of the home price appreciation for each South Carolina city between 2010 and 2018.
| City in South Carolina | CoC ROI | Price Appr | Rent Appr |
|---|---|---|---|
| Charleston, South Carolina | 1.68% | 1.79% | 5.64% |
| Columbia, South Carolina | 2.21% | 0.71% | 4.8% |
| Greenville, South Carolina | 1% | 3.68% | 6.23% |
| Mount Pleasant, South Carolina | 1.4% | 2.14% | 4.56% |
| North Charleston, South Carolina | 2.95% | 0.65% | 5.26% |
| Rock Hill, South Carolina | 3.03% | 0.62% | 5.26% |
South Dakota Appreciation Rates 2010-2018
There are 2 cities in South Dakota. The following is a summary of the home price appreciation for each South Dakota city between 2010 and 2018.
| City in South Dakota | CoC ROI | Price Appr | Rent Appr |
|---|---|---|---|
| Rapid City, South Dakota | 0.66% | 1.41% | 3.63% |
| Sioux Falls, South Dakota | 0.66% | 1.61% | 3.08% |
Tennessee Appreciation Rates 2010-2018
There are 9 cities in Tennessee. The following is a summary of the home price appreciation for each Tennessee city between 2010 and 2018.
| City in Tennessee | CoC ROI | Price Appr | Rent Appr |
|---|---|---|---|
| Chattanooga, Tennessee | 1.55% | 2.08% | 5.05% |
| Clarksville, Tennessee | 2.56% | 1.9% | 5.37% |
| Franklin, Tennessee | 1.35% | 2.28% | 5.08% |
| Jackson, Tennessee | 2.51% | 1.33% | 6.53% |
| Johnson City, Tennessee | 1.42% | 0.49% | 5.15% |
| Knoxville, Tennessee | 2.74% | 0.97% | 4.75% |
| Memphis, Tennessee | 3.77% | -0.65% | 4.96% |
| Murfreesboro, Tennessee | 1.81% | 2.53% | 4.33% |
| Nashville, Tennessee | 1.87% | 3.17% | 5.39% |
Texas Appreciation Rates 2010-2018
There are 50 cities in Texas. The following is a summary of the home price appreciation for each Texas city between 2010 and 2018.
| City in Texas | CoC ROI | Price Appr | Rent Appr |
|---|---|---|---|
| Abilene, Texas | 2.67% | 1.48% | 6.24% |
| Allen, Texas | 0.67% | 4.52% | 5.11% |
| Amarillo, Texas | 1.5% | 1.31% | 5.02% |
| Arlington, Texas | 1.16% | 1.78% | 5.07% |
| Austin, Texas | -0.14% | 4.88% | 5.78% |
| Baytown, Texas | 2.36% | 0.5% | 5.45% |
| Beaumont, Texas | 2.38% | -0.43% | 5.27% |
| Brownsville, Texas | 2.03% | -0.11% | 6.06% |
| Bryan, Texas | 1.66% | 1.64% | 5.44% |
| Carrollton, Texas | 1.2% | 3.02% | 4.88% |
| College Station, Texas | -0.16% | 3.21% | 4.86% |
| Conroe, Texas | 1.04% | 3.2% | 5.44% |
| Corpus Christi, Texas | 2.1% | 1.12% | 5.7% |
| Dallas, Texas | 0.83% | 1.94% | 4.86% |
| Denton, Texas | 0.72% | 3.14% | 5.2% |
| Edinburg, Texas | 0.79% | 0.69% | 4.75% |
| El Paso, Texas | 0.75% | 0.44% | 5.02% |
| Fort Worth, Texas | 1.07% | 1.78% | 5.65% |
| Frisco, Texas | -0.29% | 4.47% | 5.33% |
| Garland, Texas | 2.42% | 2.11% | 4.62% |
| Georgetown, Texas | 0.38% | 4.4% | 5.45% |
| Grand Prairie, Texas | 1.9% | 1.55% | 4.9% |
| Houston, Texas | 1% | 1.96% | 4.99% |
| Irving, Texas | 1.59% | 1.56% | 5.05% |
| Killeen, Texas | 1.72% | 1.27% | 4.4% |
| Laredo, Texas | 1.15% | -0.01% | 5.34% |
| League City, Texas | 0.89% | 2.89% | 5.13% |
| Lewisville, Texas | 1.53% | 2.42% | 5.06% |
| Longview, Texas | 1.27% | 1.23% | 4.63% |
| Lubbock, Texas | 1.75% | 1.8% | 5.18% |
| McAllen, Texas | 0.81% | 1.07% | 4.59% |
| McKinney, Texas | 0.03% | 4.68% | 6.2% |
| Mesquite, Texas | 3% | 0.97% | 4.49% |
| Midland, Texas | 1.67% | 4.57% | 8.09% |
| New Braunfels, Texas | 1.45% | 3.27% | 5.46% |
| North Richland Hills, Texas | 1.33% | 2.38% | 5.37% |
| Odessa, Texas | 2.23% | 4.96% | 8.57% |
| Pasadena, Texas | 2.21% | 0.69% | 5% |
| Pearland, Texas | 0.9% | 2.42% | 5.16% |
| Plano, Texas | 0.45% | 3.49% | 5.59% |
| Richardson, Texas | 1.02% | 3.74% | 5.11% |
| Round Rock, Texas | 0.75% | 3.66% | 5.13% |
| San Angelo, Texas | 1.88% | 2.96% | 5.6% |
| San Antonio, Texas | 1.52% | 1.25% | 5.01% |
| Sugar Land, Texas | 0.96% | 3.1% | 5.03% |
| Temple, Texas | 0.92% | 2.13% | 5.32% |
| The Woodlands, Texas | -0.23% | 4.41% | 5.62% |
| Tyler, Texas | 1.08% | 1.49% | 4.54% |
| Waco, Texas | 1.61% | 2.23% | 4.63% |
| Wichita Falls, Texas | 1.99% | 0.34% | 4.56% |
Utah Appreciation Rates 2010-2018
There are 8 cities in Utah. The following is a summary of the home price appreciation for each Utah city between 2010 and 2018.
| City in Utah | CoC ROI | Price Appr | Rent Appr |
|---|---|---|---|
| Ogden, Utah | 2.9% | 1.37% | 3.64% |
| Orem, Utah | 2.41% | 1.63% | 4.13% |
| Provo, Utah | 1.96% | 1.73% | 3.51% |
| Salt Lake City, Utah | 1.7% | 2.08% | 4.38% |
| Sandy, Utah | 2.08% | 1.78% | 4.45% |
| St George, Utah | 2.15% | 0.08% | 3.08% |
| West Jordan, Utah | 2.85% | 1.54% | 4.14% |
| West Valley City, Utah | 3.42% | 1.1% | 4.99% |
Virginia Appreciation Rates 2010-2018
There are 13 cities in Virginia. The following is a summary of the home price appreciation for each Virginia city between 2010 and 2018.
| City in Virginia | CoC ROI | Price Appr | Rent Appr |
|---|---|---|---|
| Alexandria, Virginia | 1.27% | 1.32% | 3.43% |
| Arlington, Virginia | 1.22% | 1.81% | 3.28% |
| Chesapeake, Virginia | 2.42% | -0.8% | 4.32% |
| Hampton, Virginia | 3.13% | -0.66% | 4.19% |
| Lynchburg, Virginia | 2.87% | 0.83% | 5.58% |
| Newport News, Virginia | 2.43% | -0.65% | 3.56% |
| Norfolk, Virginia | 2.62% | -0.72% | 4.18% |
| Portsmouth, Virginia | 3.06% | -0.75% | 3.99% |
| Reston, Virginia | 1.84% | 1.14% | 3.34% |
| Richmond, Virginia | 2.24% | 0.43% | 4.46% |
| Roanoke, Virginia | 3.09% | 0.2% | 4.89% |
| Suffolk, Virginia | 2.38% | -1.12% | 6.74% |
| Virginia Beach, Virginia | 2.81% | -0.01% | 3.52% |
Washington Appreciation Rates 2010-2018
There are 16 cities in Washington. The following is a summary of the home price appreciation for each Washington city between 2010 and 2018.
| City in Washington | CoC ROI | Price Appr | Rent Appr |
|---|---|---|---|
| Auburn, Washington | 1.88% | 0.04% | 4.86% |
| Bellevue, Washington | 1.16% | 3.03% | 5.79% |
| Bellingham, Washington | 1.3% | 1.12% | 3.74% |
| Everett, Washington | 2.12% | 0.39% | 4.8% |
| Federal Way, Washington | 1.95% | 0.45% | 4.69% |
| Kennewick, Washington | 2.31% | 1.92% | 4.2% |
| Kent, Washington | 2% | 0.25% | 5.17% |
| Kirkland, Washington | 1.5% | 2.14% | 4.64% |
| Redmond, Washington | 1.51% | 3.52% | 5.12% |
| Renton, Washington | 2.04% | 1.24% | 5.54% |
| Seattle, Washington | 1.1% | 3.15% | 6.02% |
| Spokane, Washington | 2.51% | 0.71% | 4.47% |
| Spokane Valley, Washington | 2.37% | 0.24% | 3.88% |
| Tacoma, Washington | 2.21% | 0.31% | 4.9% |
| Vancouver, Washington | 2.38% | 1.03% | 5.21% |
| Yakima, Washington | 2.53% | 0.44% | 4.22% |
Wisconsin Appreciation Rates 2010-2018
There are 11 cities in Wisconsin. The following is a summary of the home price appreciation for each Wisconsin city between 2010 and 2018.
| City in Wisconsin | CoC ROI | Price Appr | Rent Appr |
|---|---|---|---|
| Appleton, Wisconsin | 1.8% | 0.24% | 4.59% |
| Eau Claire, Wisconsin | 1.87% | 0.41% | 4.42% |
| Green Bay, Wisconsin | 1.61% | -0.15% | 3.22% |
| Janesville, Wisconsin | 2.15% | -0.13% | 3.81% |
| Kenosha, Wisconsin | 1.74% | -1.55% | 3.25% |
| Madison, Wisconsin | 1.1% | 0.62% | 3.73% |
| Milwaukee, Wisconsin | 2.28% | -2.11% | 3.84% |
| Oshkosh, Wisconsin | 1.74% | 0.08% | 3.81% |
| Racine, Wisconsin | 2.63% | -2.37% | 4.55% |
| Waukesha, Wisconsin | 1.24% | -0.66% | 2.92% |
| West Allis, Wisconsin | 1.4% | -1.48% | 2.91% |
Wyoming Appreciation Rates 2010-2018
Here's the data for Cheyenne in Wyoming.
| City in Wyoming | CoC ROI | Price Appr | Rent Appr |
|---|---|---|---|
| Cheyenne, Wyoming | 2.3% | 2.16% | 5.26% |
How the Real Estate Financial Planner™ Calculates It And Uses It
We express the Appreciation Rate in terms of rate per year, but calculate it monthly. We calculate it monthly by converting it to a monthly compound rate that will equal the full yearly Appreciation Rate when you use the monthly rate twelve times.
$AppreciationMonthlyCompoundingRate =

((1 + ($AppreciationRate/100))**(1/12) - 1 );
This monthly value is multiplied by the current value of the Property each month to determine the amount by which the Property went up or down in value that month.
We enter the initial value for the Appreciation Rate when we add the Property. Appreciation Rate will remain at this value until and unless you change it using  Rules. To manipulate the value of the Appreciation Rate you might want to use Rules like the Set Value on Property Rule. This will allow you to change the Appreciation Rate to be another fixed value, a random value within a range you define, or a random value based on a normal distribution curve you define, or increase or decease using addition/subtraction or multiplication/division. How it is calculated depends on how you set up the Rule.
This is inline with our philosophy here: we provide you the tools to model the world as you believe it exists using Rules. We try not to dictate how you need to model it; instead we provide you with the flexibility to model it how you think it is. That’s why we say the Real Estate Financial Planner™ software is refreshingly complicated.
We expect the value of the Appreciation Rate to be in percent format. For example, if you want the Appreciation Rate for a Property to be 3% per year, enter 3.000 for the value (not .03).
We can use fixed values for the Appreciation Rate over the course of an entire  Scenario. An example is shown in the
  Chart below.
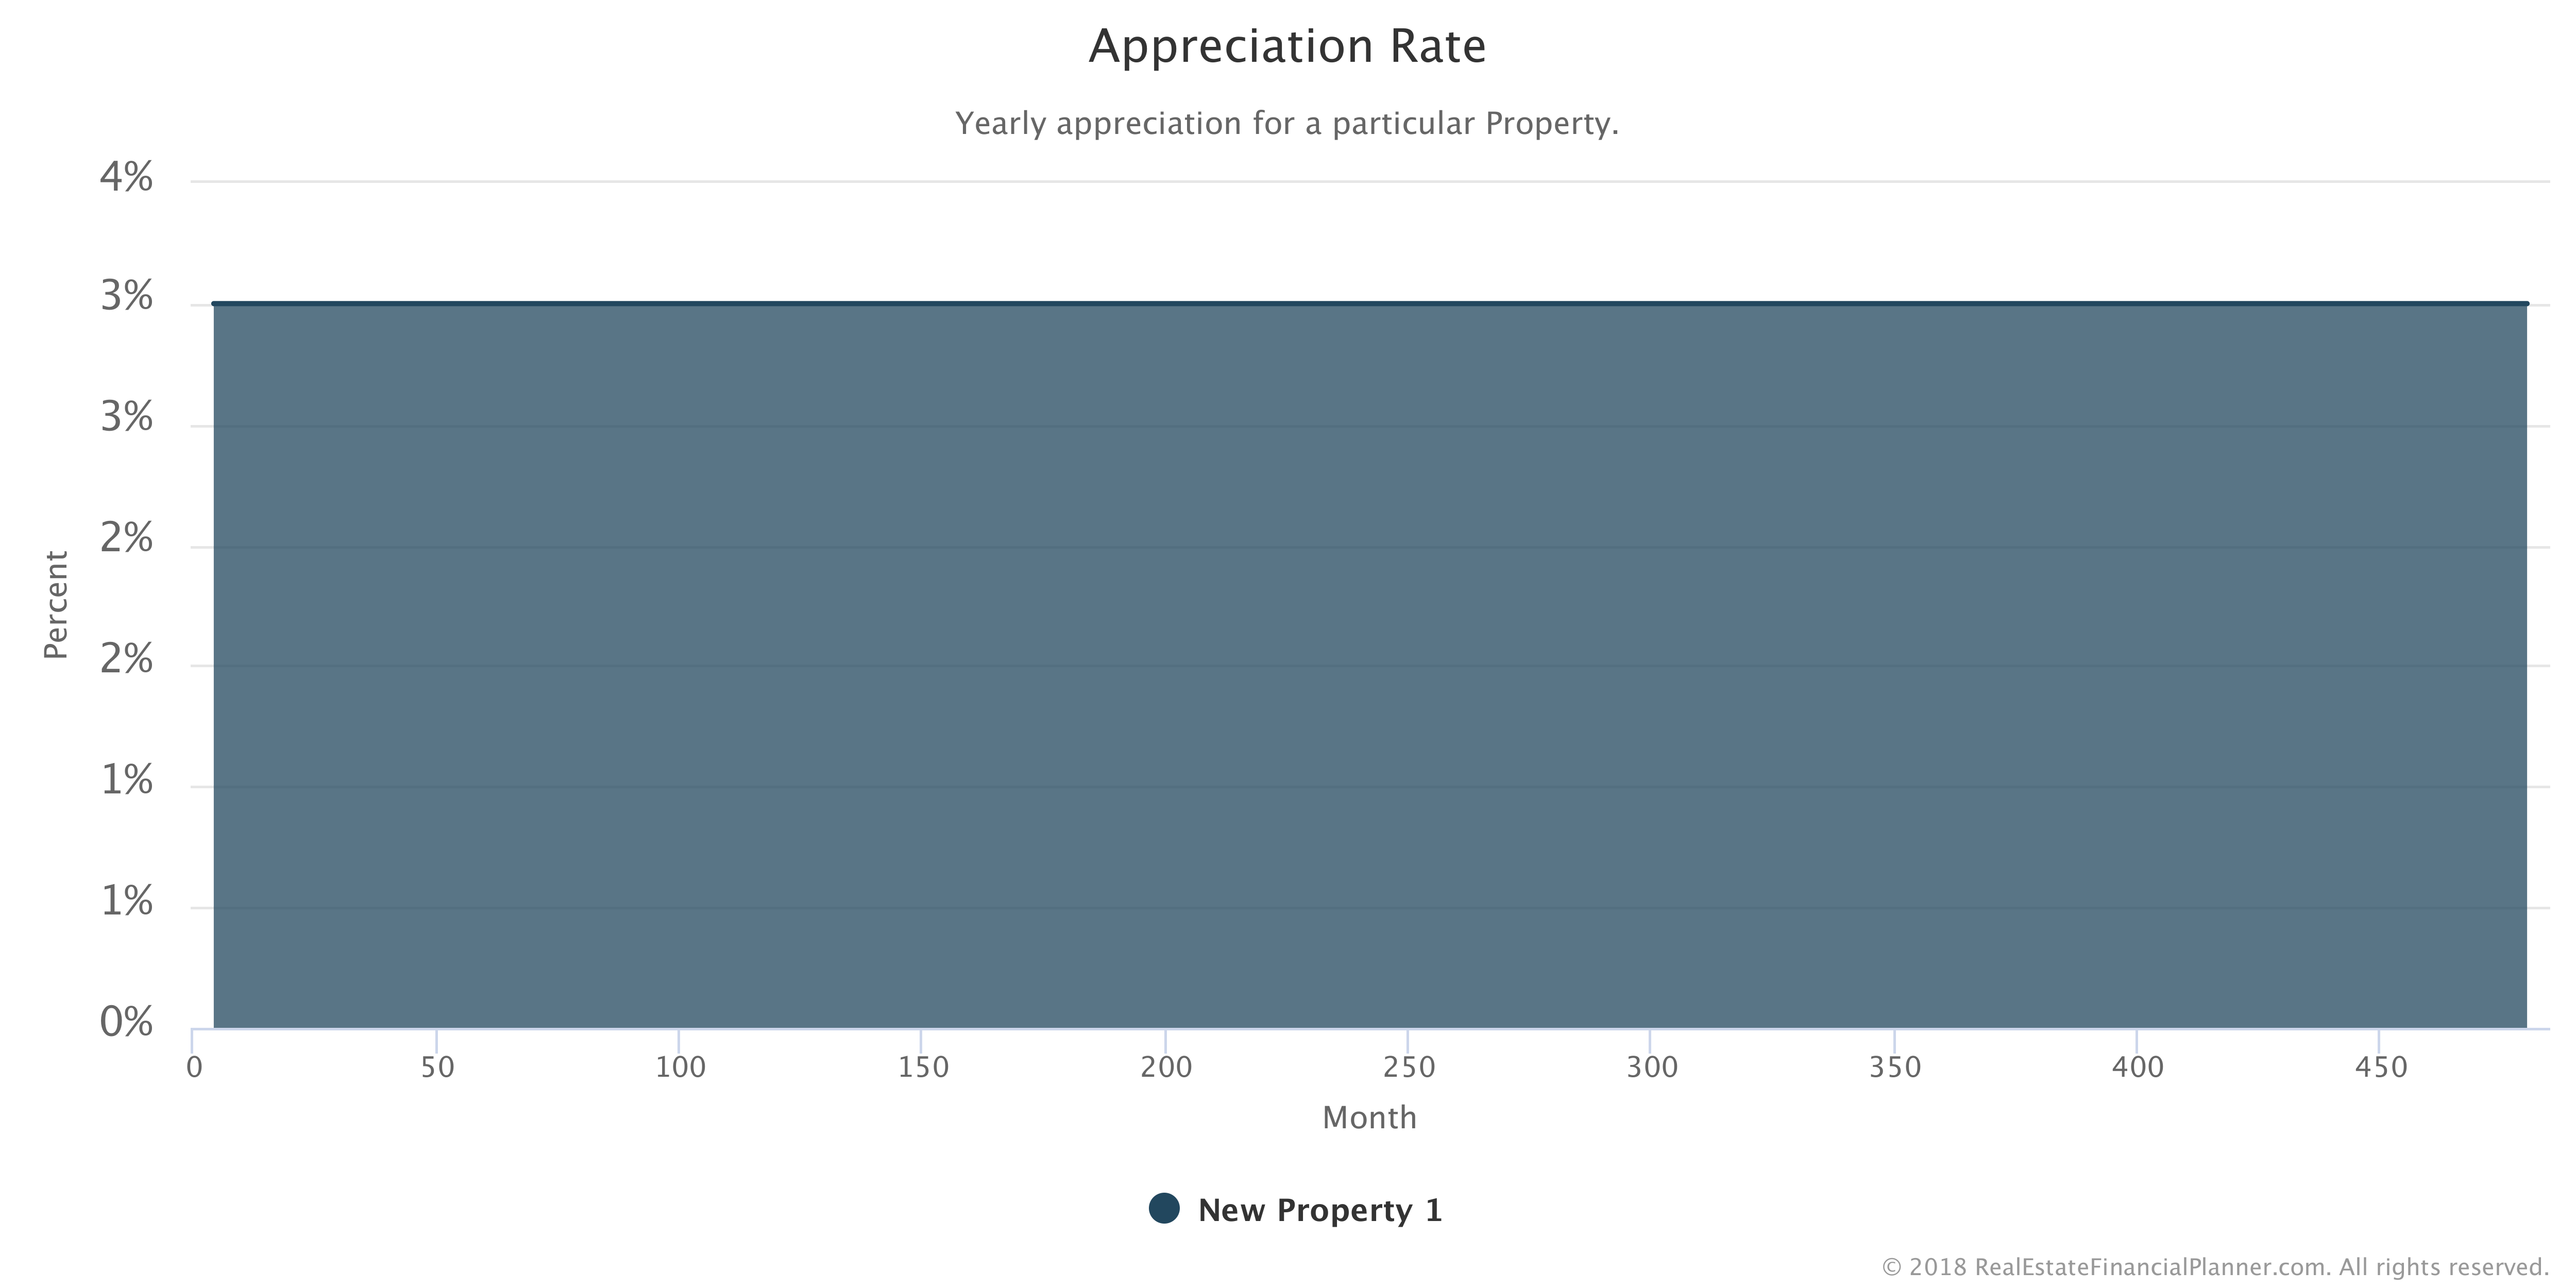
We can change the Appreciation Rate one or more times over the course of the Scenario to model various types of real estate markets.
For example, we might set the Appreciation Rate to be sharply negative for a few years using a Rule to Set Value on Property. This will cause the Property Value to decline each month. Then, when we want to model the market recovering, we might run another Rule to Set Value on Property that changes the Appreciation Rate back to a positive value to simulate a real estate market recovery.
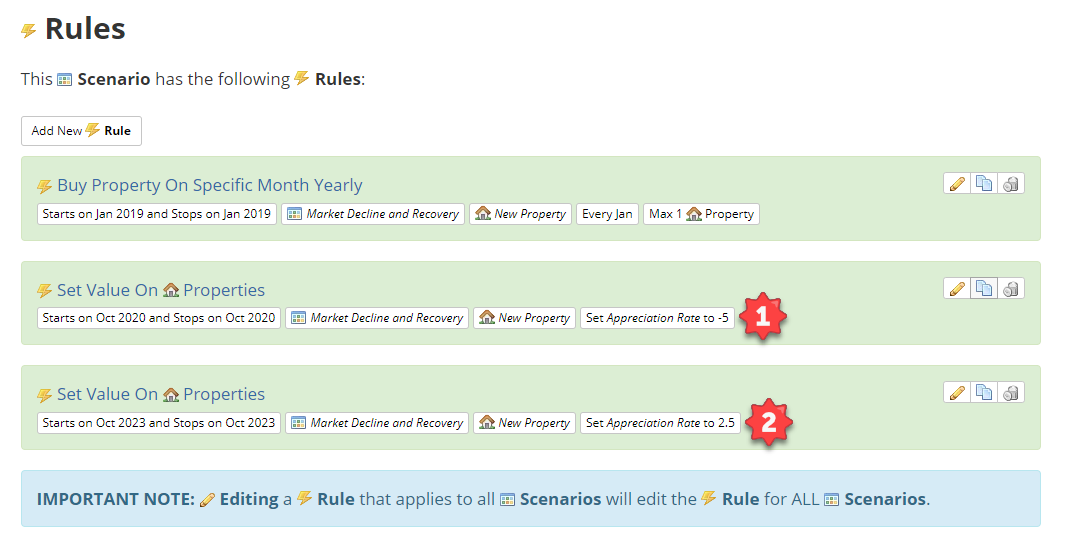
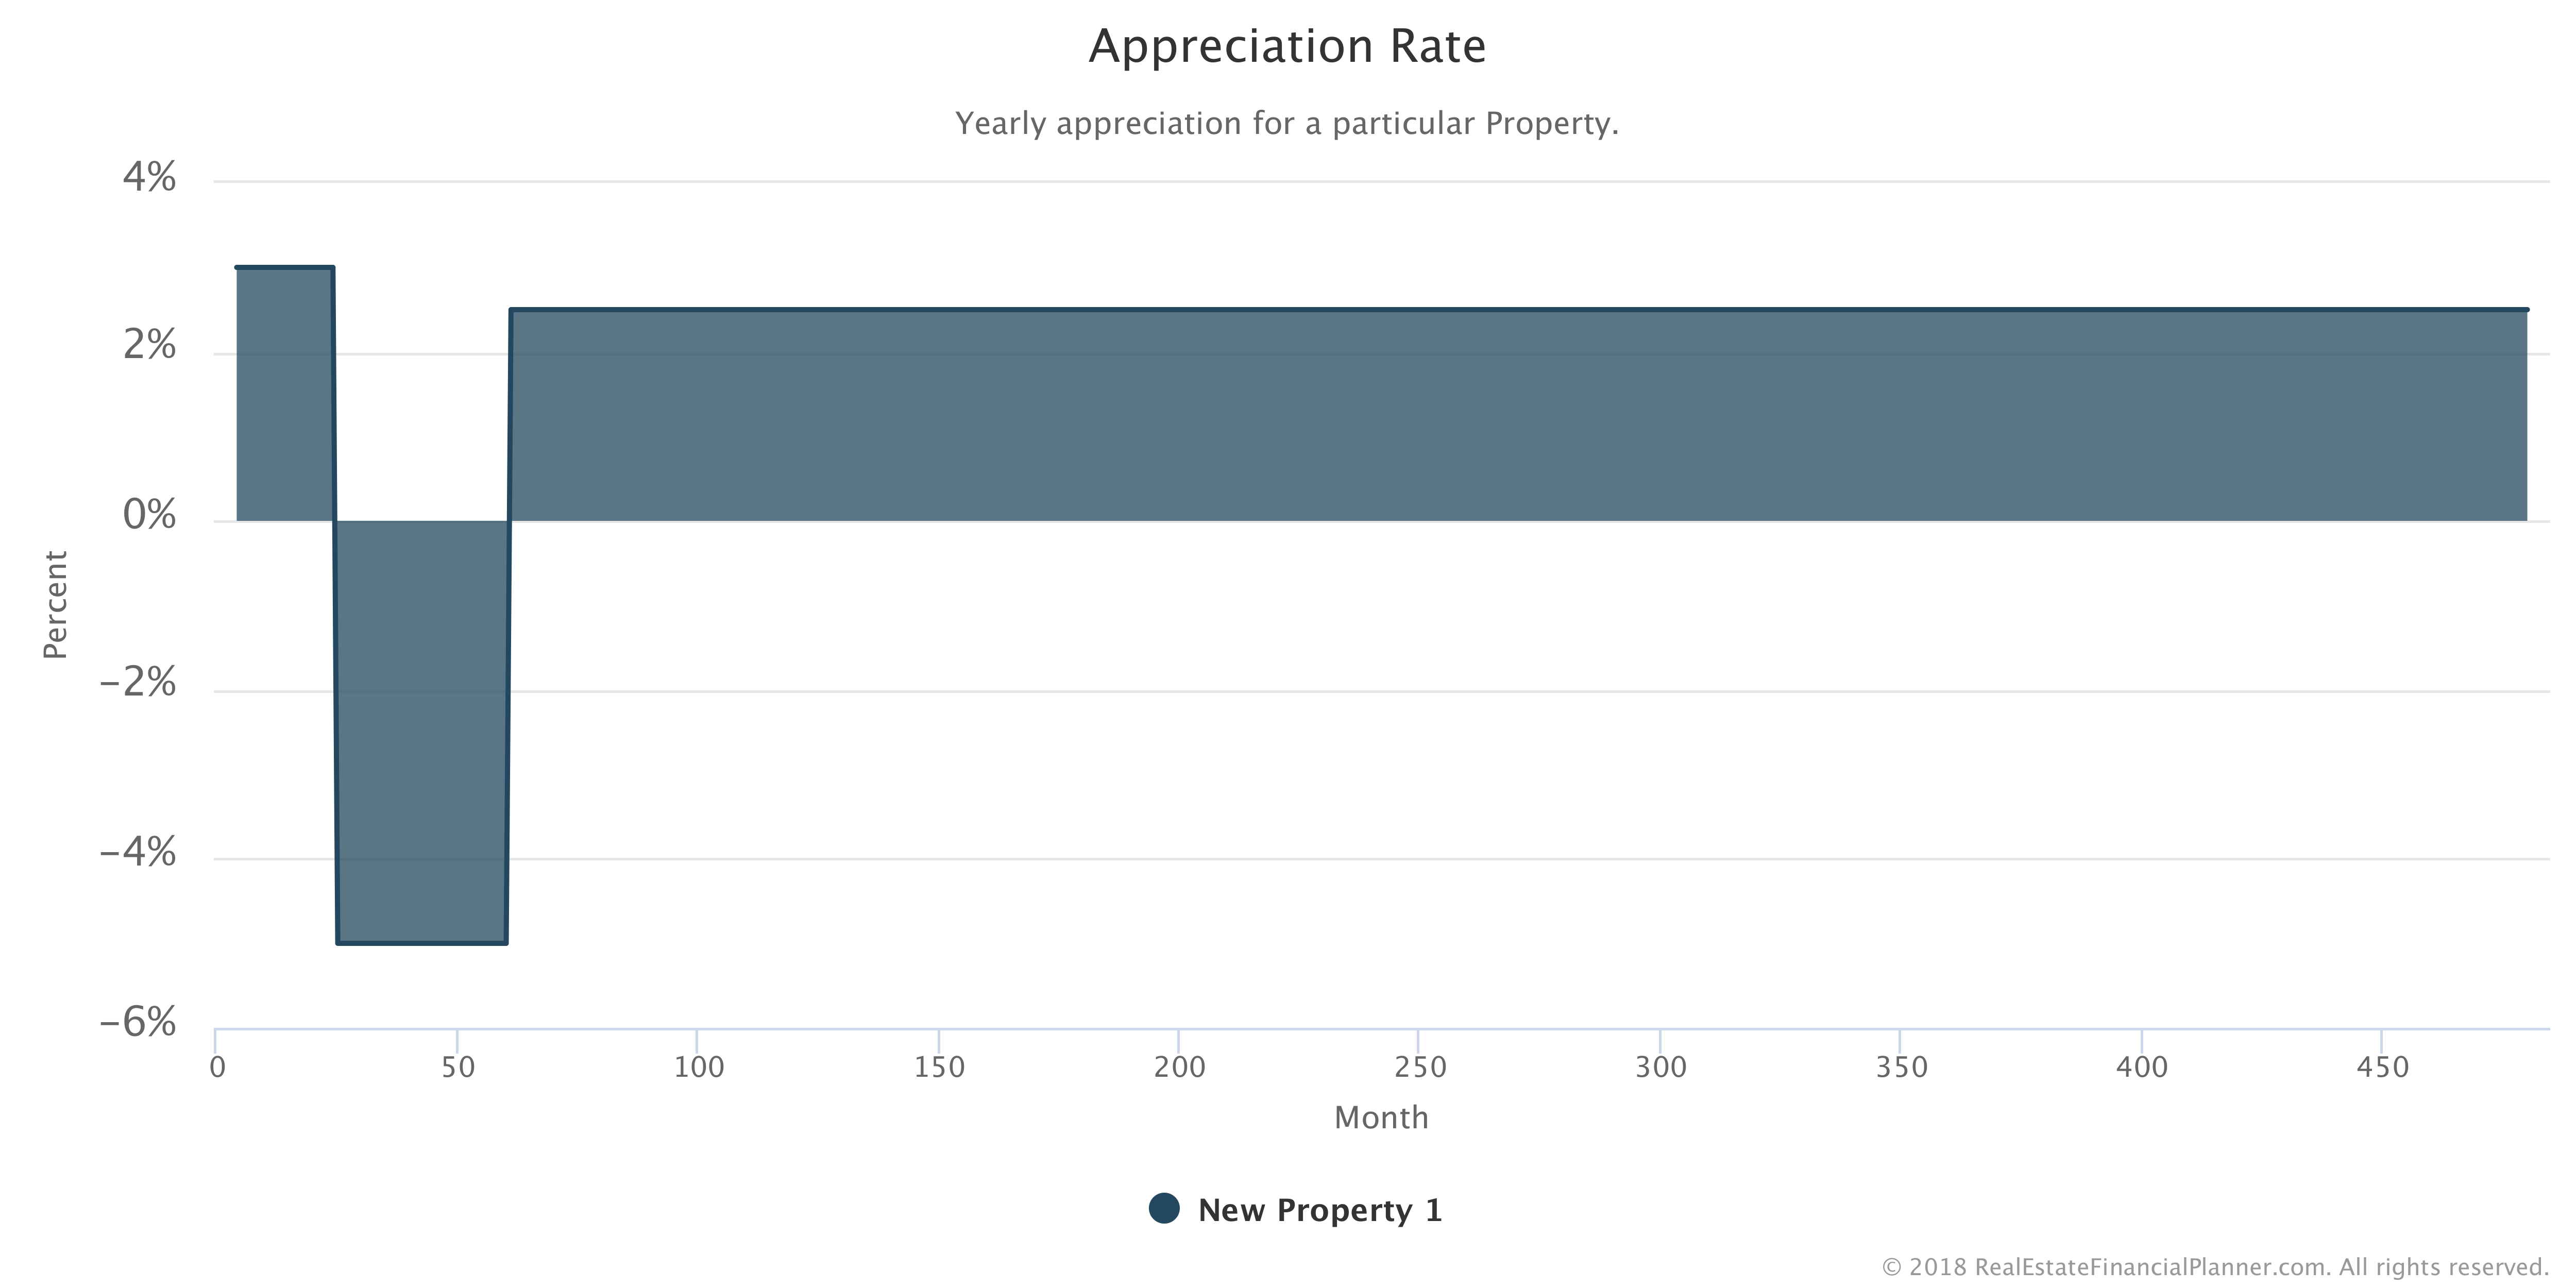
In the example Chart below, the Property started with a 3% per year Appreciation Rate. Then, a couple years into the Scenario, the Appreciation Rate drops to be -5% per year and the property value declines for a couple of years at that rate. Finally, a couple years later, we change the Appreciation Rate to 2.5% and allow the Property to recovery from a small, temporary market correction.
This is what the Rules to simulate this temporary decline and recovery in Appreciation Rate looks like.
If we look at the Chart of Appreciation Rate, this is what it would look like.
And here is what the Property Value would look like with this Appreciation Rate simulating a market decline and recovery.
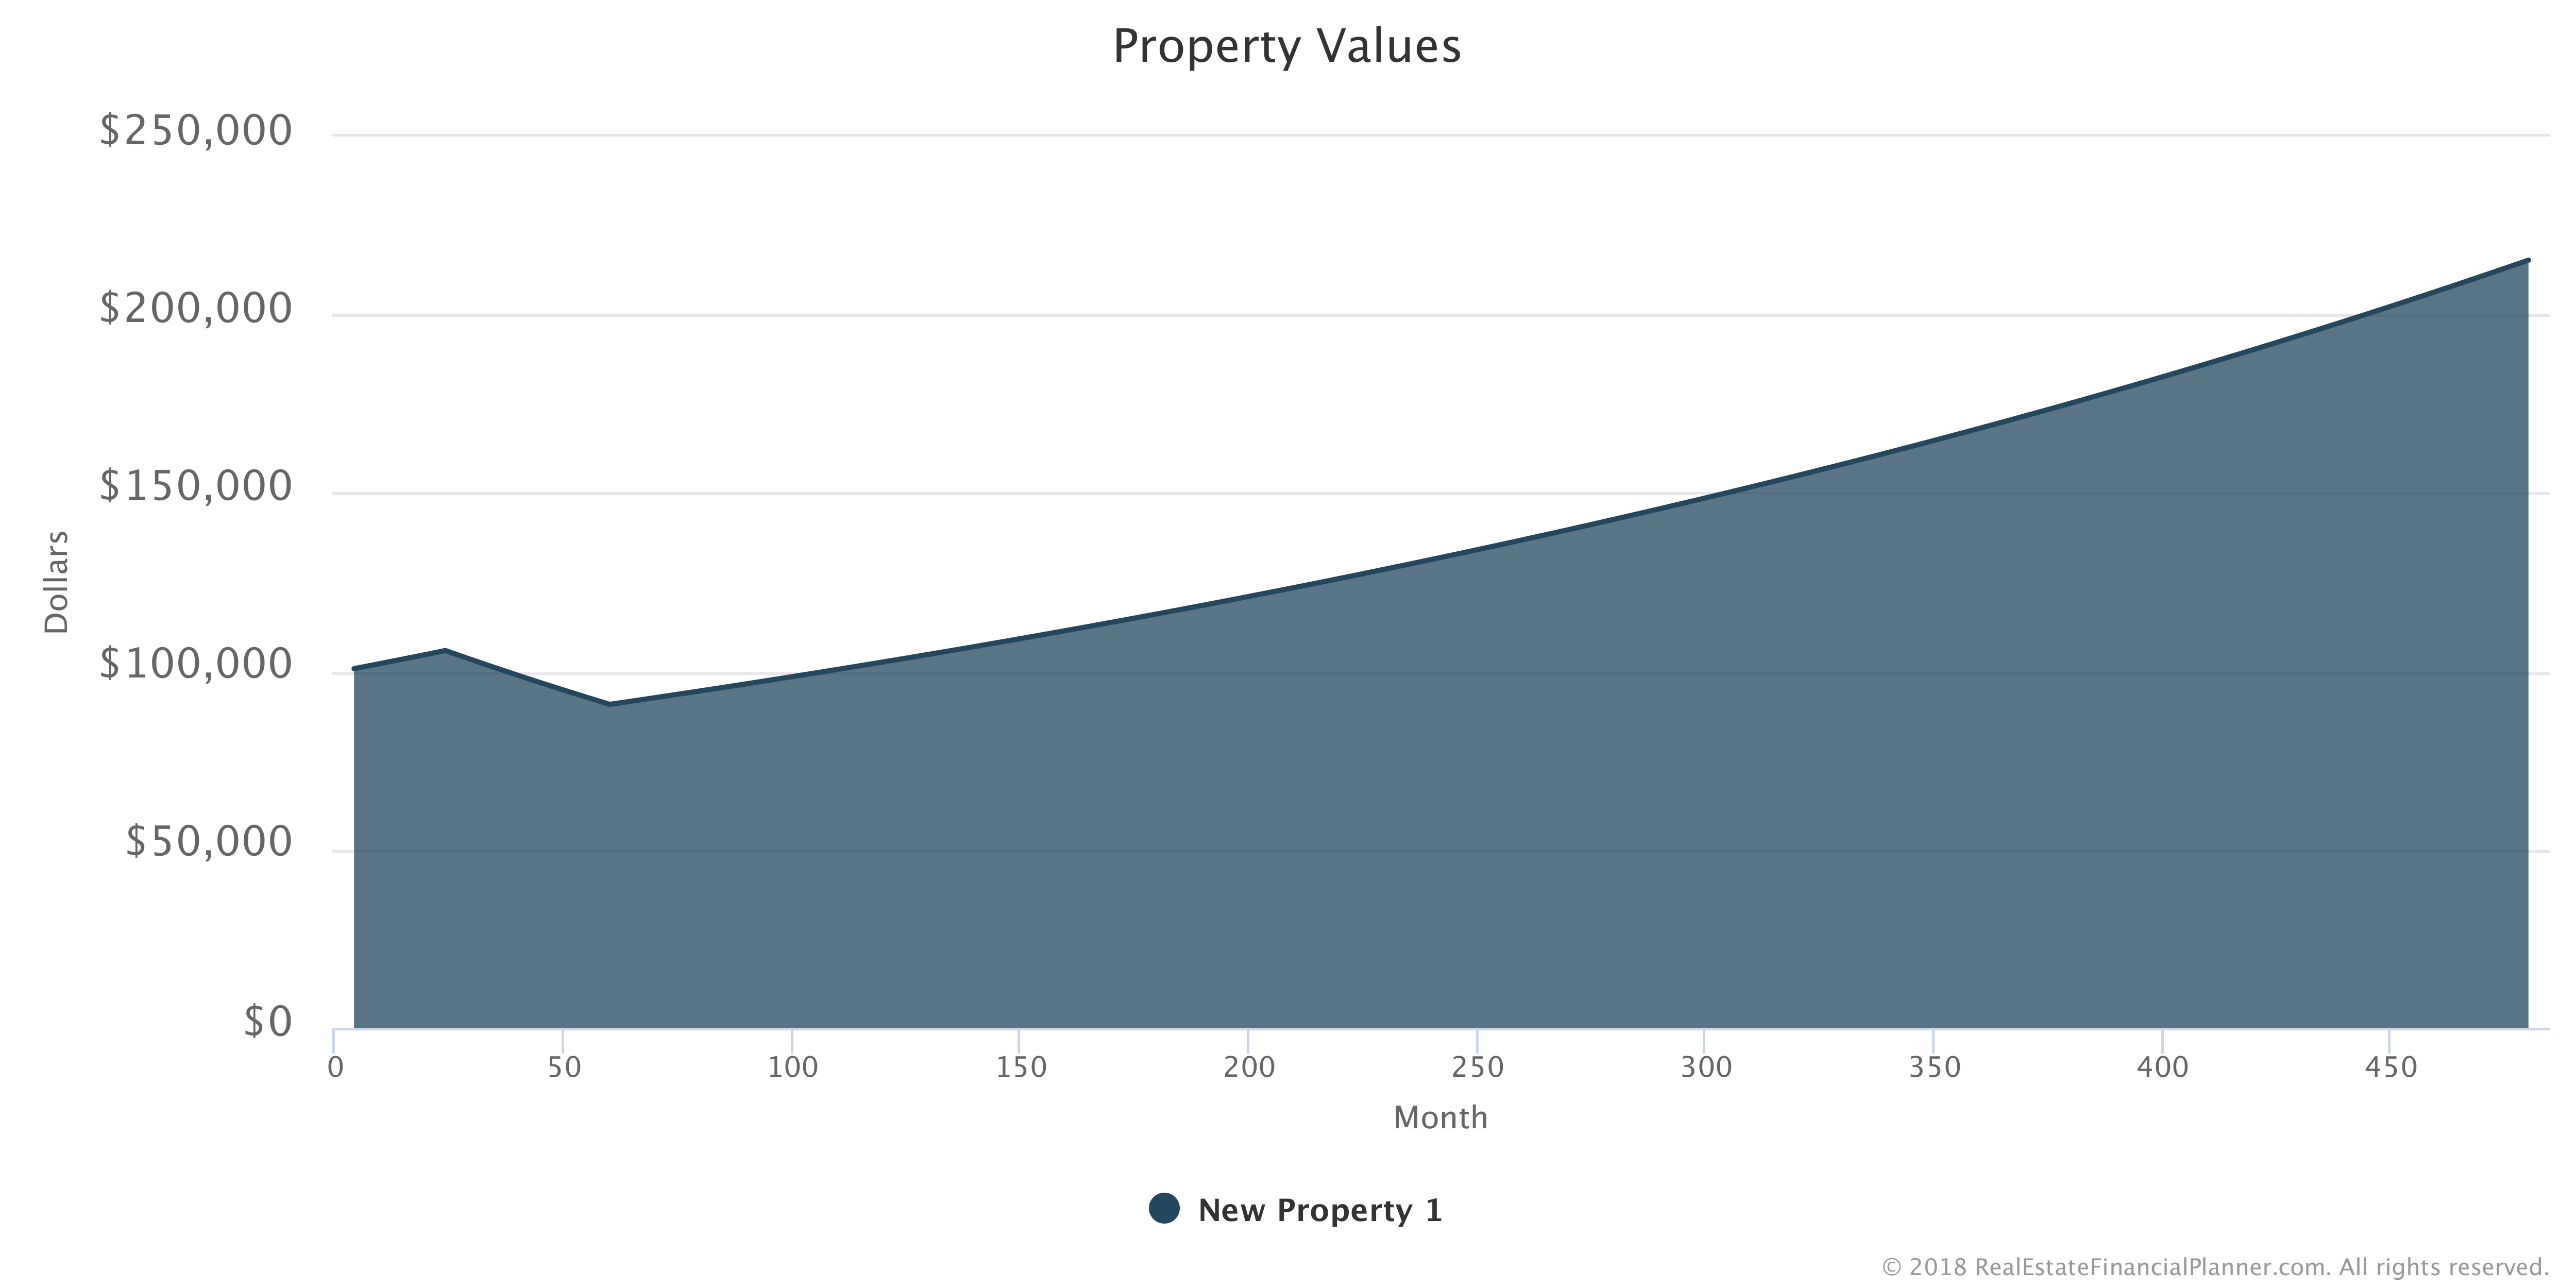
Here’s another example. In this example, we are setting the Appreciation Rate to be a random number between -10% per year and +16% with an average of about 3% per year. Again, this was done with the same Set Value on Property Rule but instead of setting it to a fixed value, we’re setting it to be random.
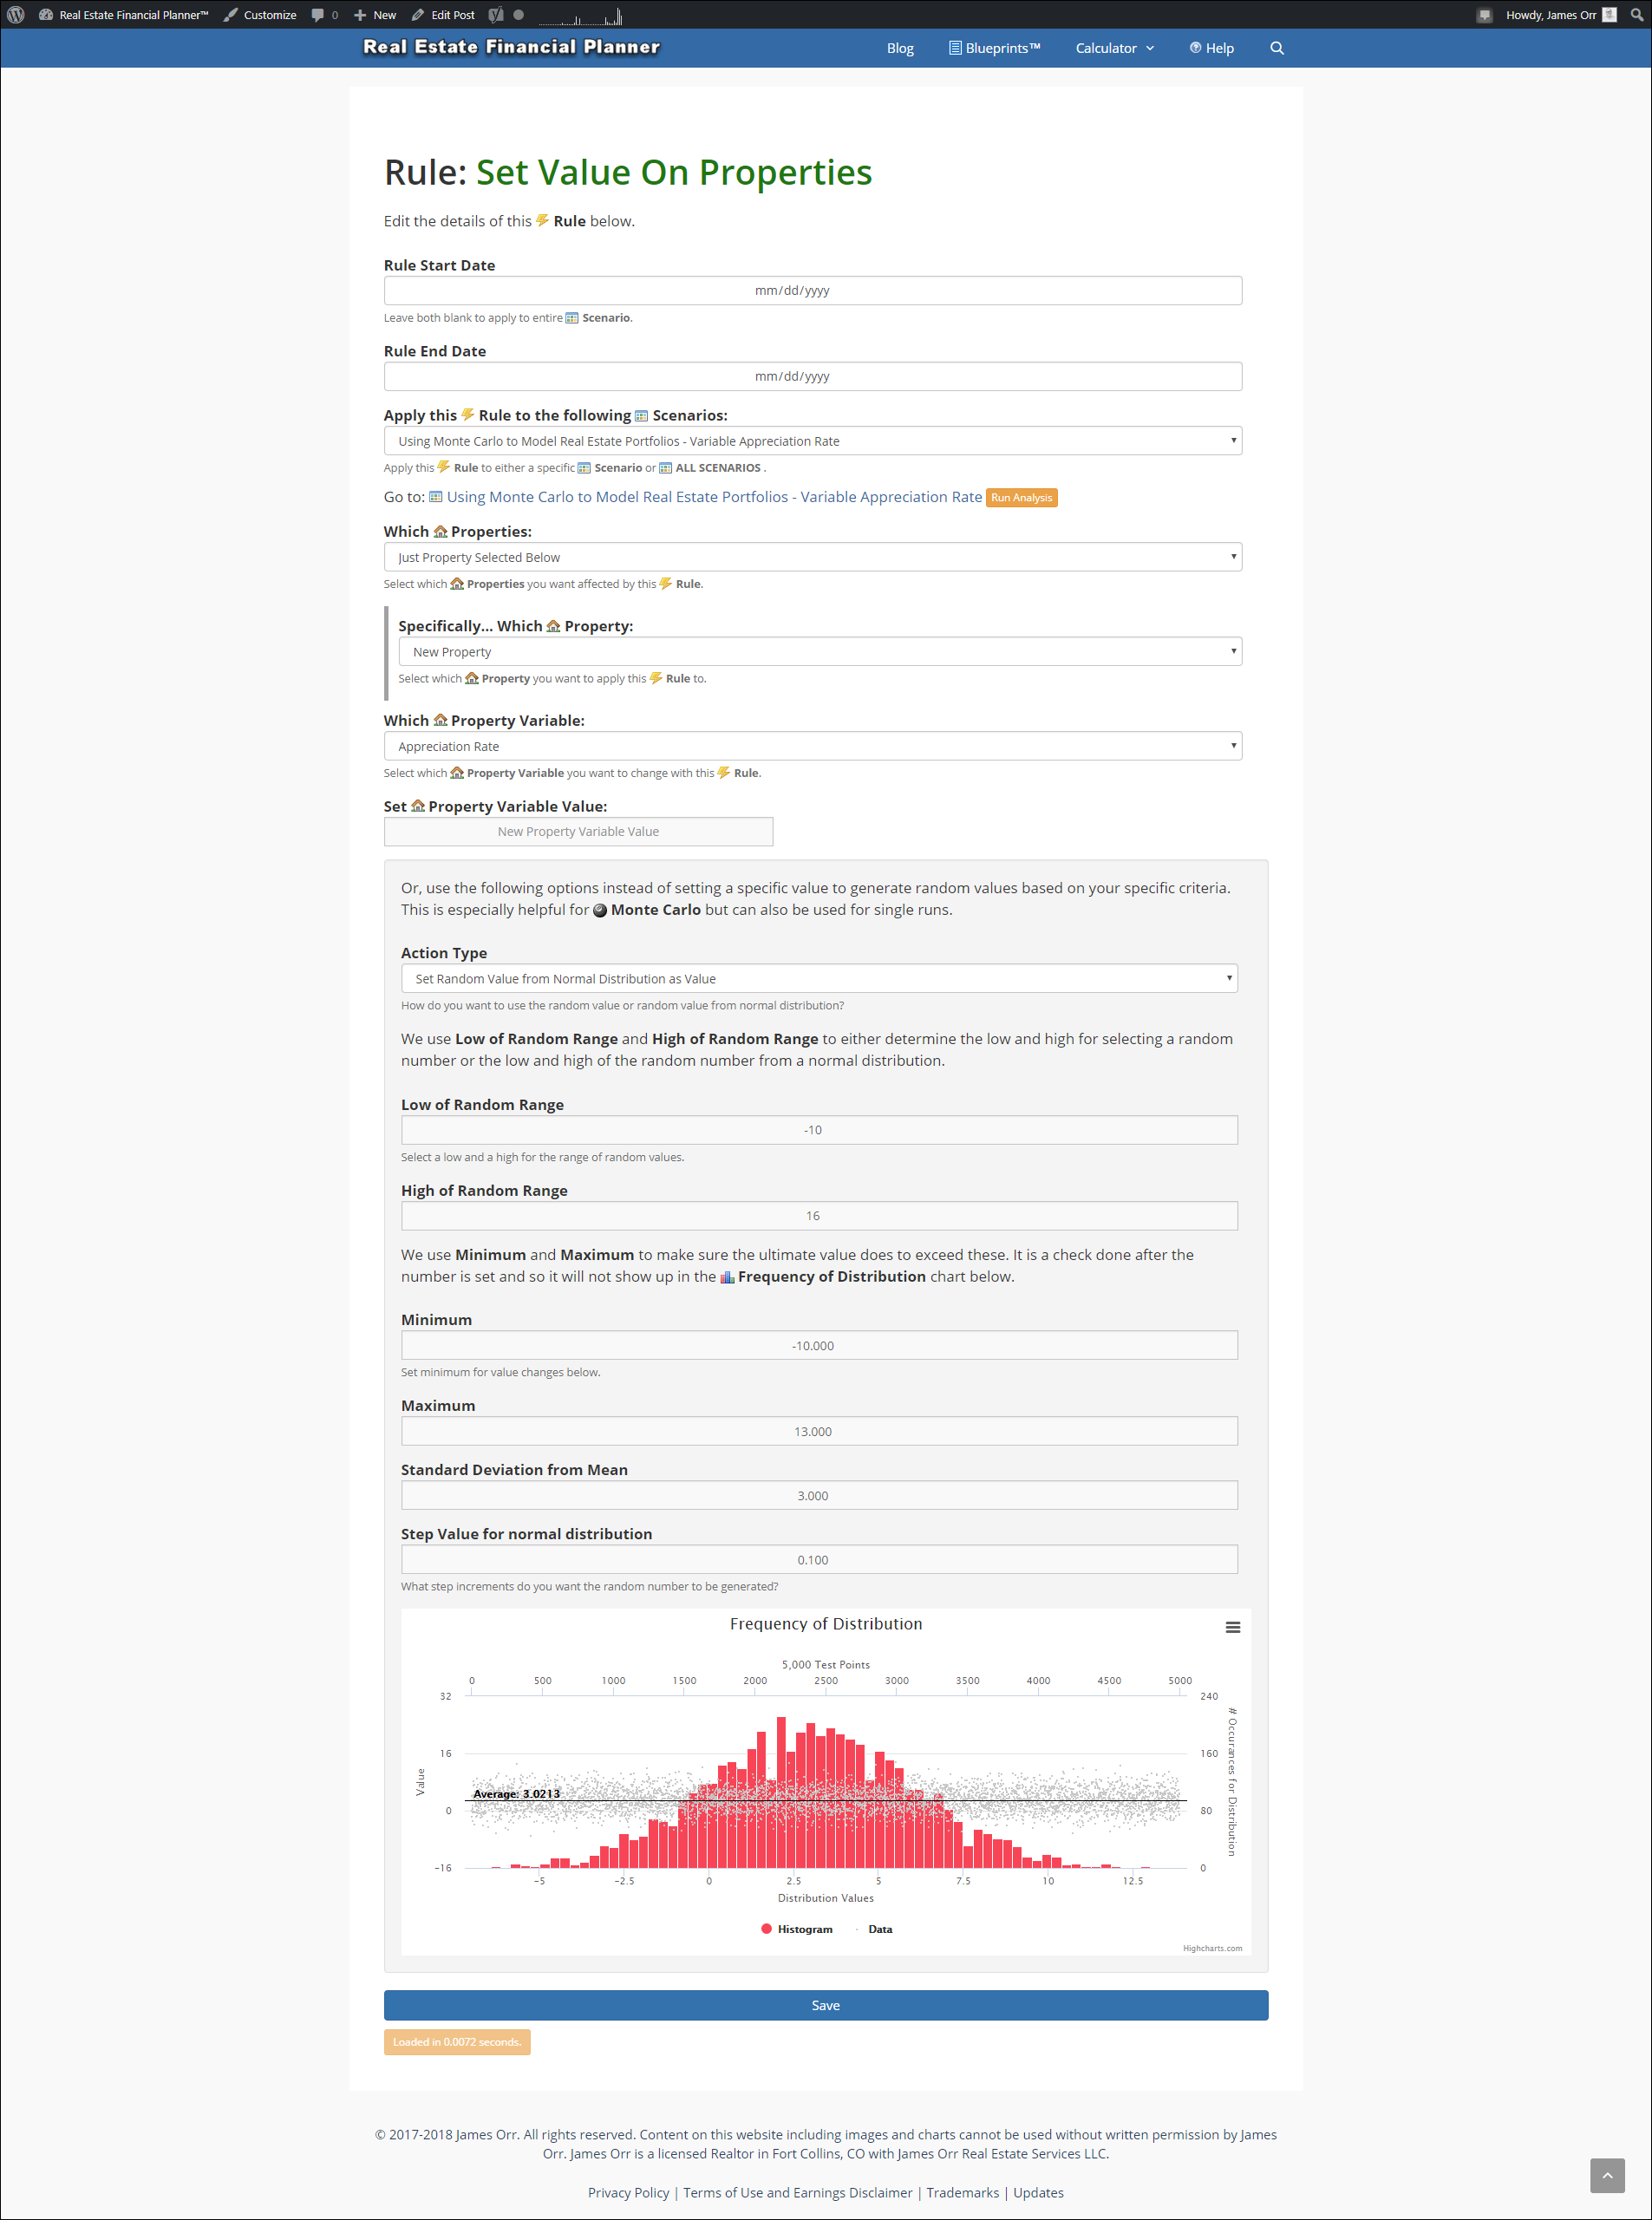
This Rule will now make the Appreciation Rate equal to a random number. Here’s what a Chart of Appreciation Rates based on a normal distribution curve with an average of 3% looks like.
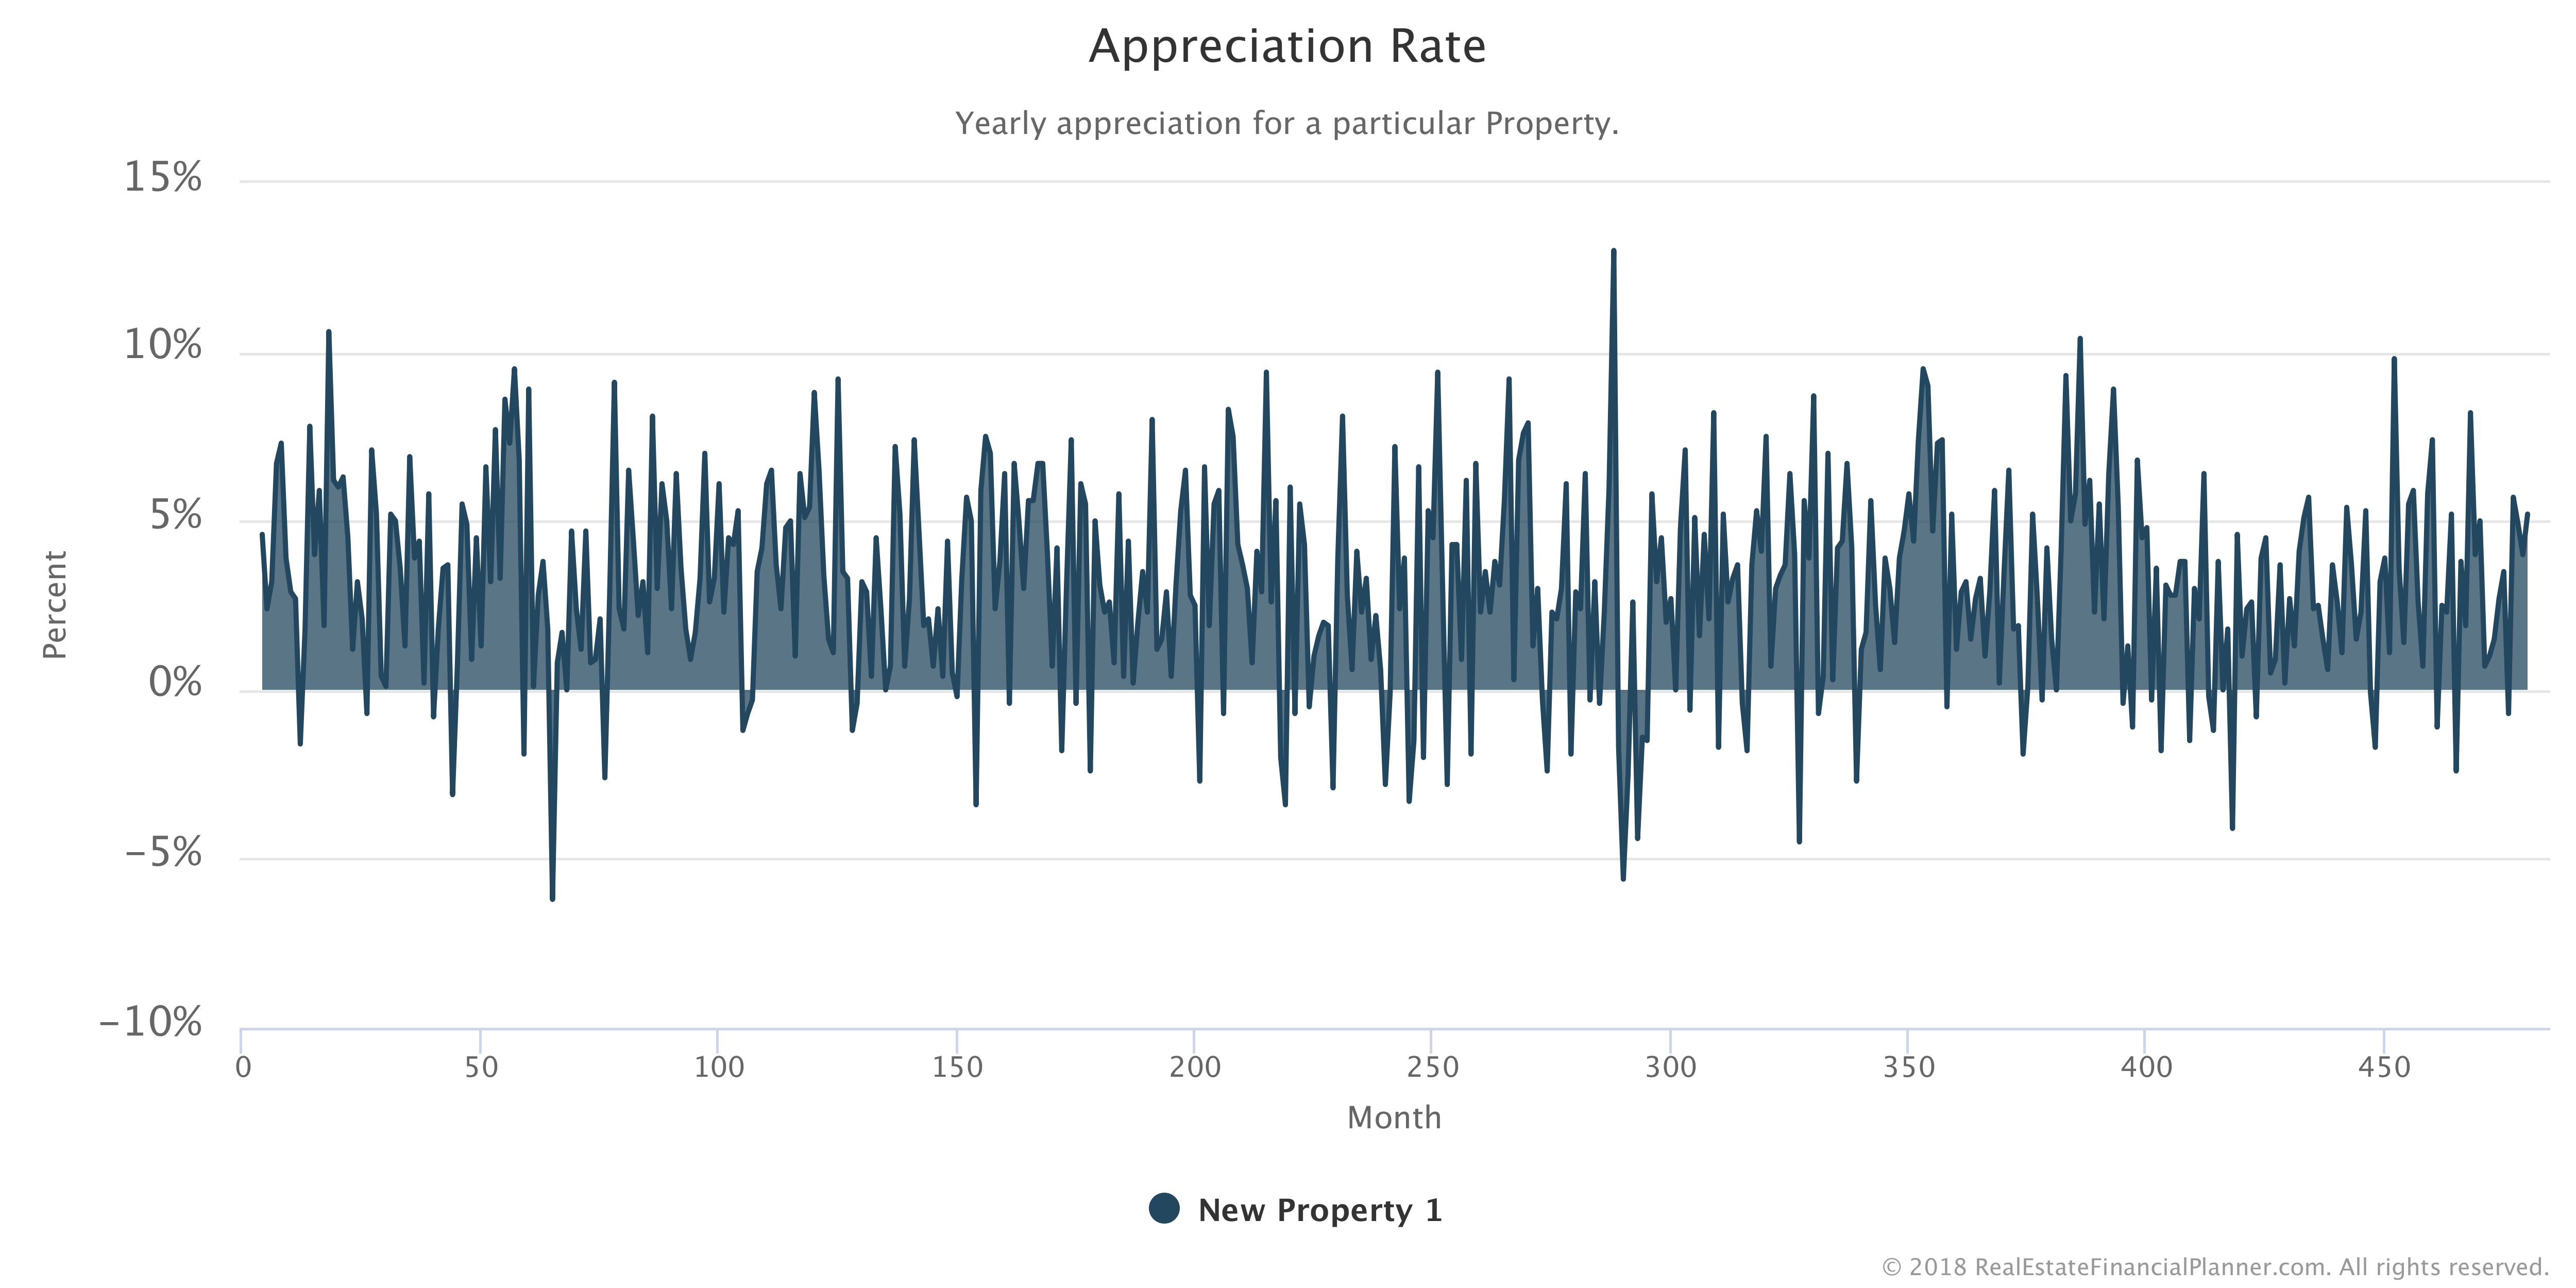
With this Appreciation Rate, the Property goes up in value about 3% per year, but much more erratically. This, in our opinion, better models reality.
Appreciation Rate is an important variable that we use to manipulate the value of Properties in our Scenarios.
Property Variables
Each Property
More posts: Property Chart Variable