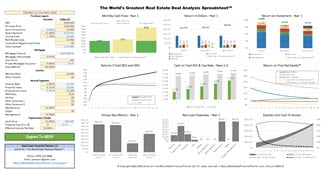
Investing in a rental property can be a great way to generate passive income and build long-term wealth. However, before making any decisions, it’s important to thoroughly analyze the potential cash flow and returns of the property. In this post, we’ll break down how to analyze a 20% down single-family home rental using some key metrics and calculations and The World’s Greatest Real Estate Deal Analysis Spreadsheet™ (a free download).
Understanding True Cash Flow™
When analyzing a rental property, it’s important to understand the True Cash Flow™. This includes the monthly cash flow from the property plus the tax benefits of owning the property, such as the Cash Flow from Depreciation™. By adding these two values together, you can determine the True Cash Flow™ of the property. It’s important to note that the Cash Flow from Depreciation™ is a non-cash expense that reduces your taxable income, and therefore, increases your cash flow.
Calculating Returns
To determine the returns on a rental property investment, you’ll need to consider several factors. These include Appreciation, cash flow, debt paydown, and Cash Flow from Depreciation™. By analyzing these values, you can determine the total return on investment for the property. Let’s break these down further.
Appreciation
Appreciation is the increase in value of the property over time. To calculate the annual appreciation rate, divide the increase in property value by the original property value and multiply by 100. It’s important to note that appreciation rates can vary widely depending on the location and market conditions.
Cash Flow
Cash flow is the amount of money left over after all expenses have been paid. To calculate the monthly cash flow, subtract the monthly mortgage payment, property taxes, insurance, maintenance, and property management fees from the monthly rental income. A positive cash flow is ideal, as it means you’re generating income from the property.
Debt Paydown
Debt paydown is the reduction of the mortgage balance over time. As you make mortgage payments, a portion of each payment goes towards paying off the principal balance of the loan. This reduction in debt increases your equity in the property and can contribute to your overall return on investment.
Cash Flow from Depreciation™
As mentioned earlier, the Cash Flow from Depreciation™ is a non-cash expense that reduces your taxable income. To calculate the Cash Flow from Depreciation™, multiply the annual depreciation expense by your marginal tax rate. This amount can then be added to your monthly cash flow to calculate the True Cash Flow™ of the property.
When analyzing a rental property, it’s important to consider different scenarios. For example, you’ll want to analyze the returns with and without reserves. You may also want to consider how the returns change with different levels of reserves, such as six months versus 12 months. Additionally, you’ll want to consider how the returns change over time and with different appreciation rates.
Reserves
Reserves are funds set aside for unforeseen expenses, such as repairs or vacancies. It’s important to factor in reserves when analyzing the returns on a rental property. You can calculate the returns with different levels of reserves by adjusting the amount set aside and the rate of return on those reserves.
Appreciation Rates
Appreciation rates can vary widely depending on the location and market conditions. When analyzing a rental property, it’s important to consider different appreciation rates to get a more complete picture of the potential returns. You can calculate the returns with different appreciation rates by adjusting the annual appreciation rate used in the calculations.
Other Key Metrics
In addition to analyzing cash flow and returns, there are other key metrics to consider when analyzing a rental property. These metrics can help you get a more complete picture of the potential returns and risks of the investment.
Gross Potential Income
Gross potential income is the total amount of rental income the property could generate if it were fully occupied and all rents were paid on time.
Gross Operating Income
Gross operating income is the amount of rental income the property generates after deducting vacancy and credit losses.
Operating Expenses
Operating expenses are the expenses incurred to operate and maintain the property, such as property taxes, insurance, maintenance, and property management fees.
Net Operating Income
Net operating income is the amount of income generated by the property after deducting operating expenses.
Equity and Cost to Access Equity
Equity is the difference between the property’s market value and the outstanding mortgage balance. The cost to access equity is the cost of refinancing or selling the property to access that equity. It’s important to consider both the equity and the cost to access it when analyzing a rental property.
Free Spreadsheet Download
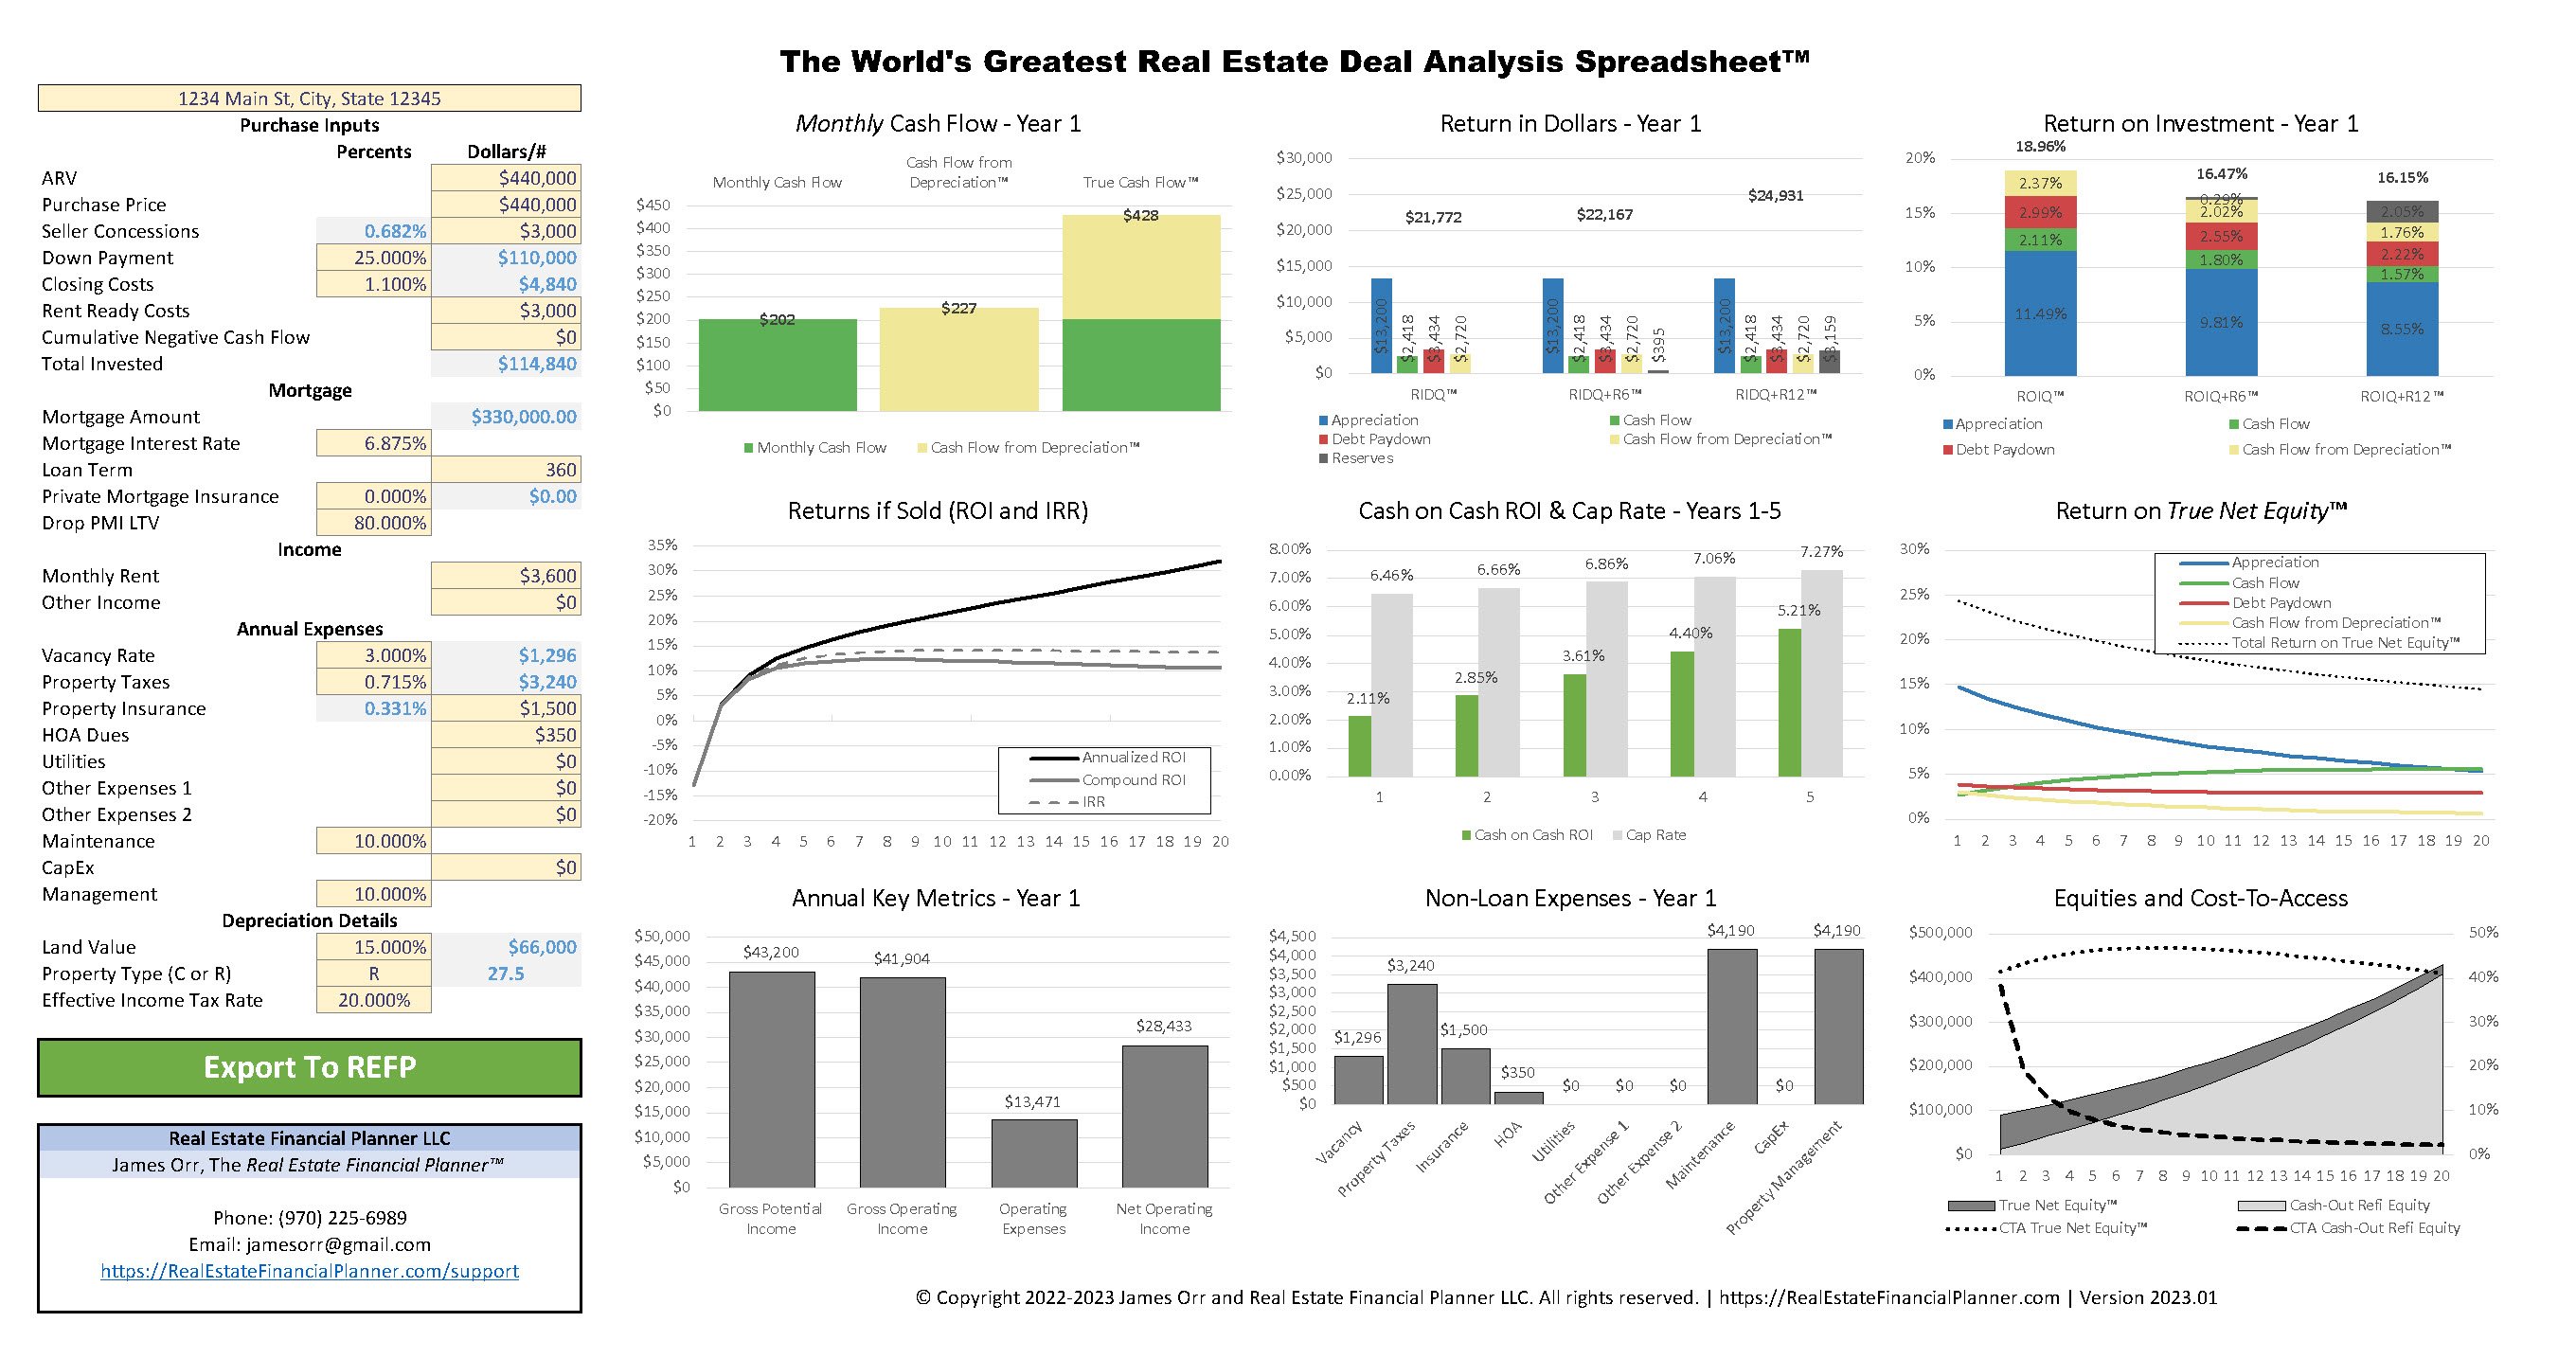
Download a free copy of The World’s Greatest Real Estate Deal Analysis Spreadsheet™ to do your own deal analysis.
Conclusion
Analyzing a rental property can be a complex process, but by understanding key metrics and calculations, you can make more informed investment decisions. By considering different scenarios and analyzing different metrics, you can get a more complete picture of the potential cash flow and returns of a rental property investment. Remember to factor in reserves and appreciate rates, and consider other key metrics such as gross potential income, gross operating income, operating expenses, net operating income, and equity and cost to access equity. With these tools and a thorough analysis, you can make a smart investment in a single-family rental property.