College or real estate investing? That’s a great question.
What if you earn $30,000 more per year after you get your degree than the person who doesn’t go to college and you decide to invest the full $30,000 per year extra?
We tackle the age-old question: Go to College or Skip It to Invest in Real Estate in this special class by James.
This class was taught on January 13, 2021 via webinar.
Tammy had sent over an article, Is This The End of College As We Know It, and James decided to do some math to see if the extra earning power of a college degree was worthwhile.
Assumed Cost of College
For this class, I looked up the cost to attend our local Colorado State University.
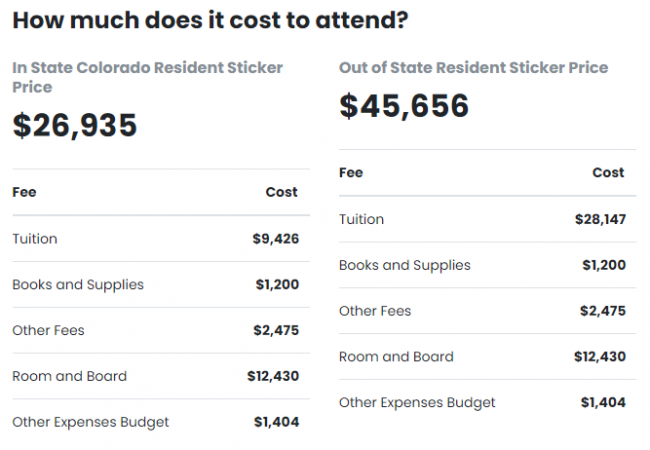
I ended up rounding down and estimating college was $25,000 per year including tuition, books, supplies, fees, room, board and other expenses.
Difference in Salary for College Grad Versus High School Grad
How much more does the college grad make than the high school grad?
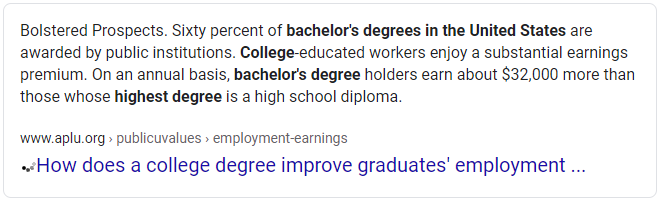
I ended up rounded down and estimated that the college grad earns $30,000 more per year than a high school graduate investing in real estate.
Furthermore, I assumed that the college grad invested the full $30,000 difference each year and both lived on a $50,000 per year income.
Setting Up The Comparison
For the comparison, here’s what I assumed is the same:
- Family has saved up $100K for either college or investing
- Both kids receive the full $100K upon leaving high school
- Both invest it in the stock market (or equivalent) and earn 8% (until they spend it)
- Financial Independence = Replace $50K/year Passive Income
- Cash Flow (after all expenses on rentals) +
- 4% Safe Withdrawal Rate of Money in Stocks
Plus, the properties are the same.
- This property is a Nomad™ property that you live in until you buy your next owner-occupant property. When you buy your next Nomad™ property, this one becomes a rental.
- This property uses dynamic rules to determine when we buy/sell it in the scenario.
- Account for down payment, income and expenses for this property: All-In-One Account
- $350,000 property value and purchase price and it goes up at a rate of 3% per year.
- 5% of purchase price for down payment.
- 1% of purchase price in closing costs at time of purchase.
- No seller concessions.
- 2.75% is the mortgage interest rate with a term of 360 month mortgage term.
- Private Mortgage Insurance (PMI) at a rate of 0.5% of the initial loan balance until the loan-to-value drops below 80%.
- $2,100 per month in rent but rent increases at a rate of 3% per year.
- 3% of the monthly income is the assumed vacancy rate.
- 10% of the monthly income is the assumed maintenance rate.
- 1% of the value of the property each year is the assumed property taxes rate. Based on the initial value of $350,000 that’s about $3,500 per year in property taxes at the start and it changes as the property value changes.
- 0.4% of the value of the property each year is the assumed property insurance rate. Based on the initial value of $350,000 that’s about $1,400 per year in insurance costs at the start and it changes as the property value changes.
- This is a residential property and 15% of purchase price is considered the value of the land (when doing our depreciation calculation).
- All properties are self-managed.
Is This An Amazing, Unrealistic Property?
Nope. Clients have bought several properties like this in the last year.
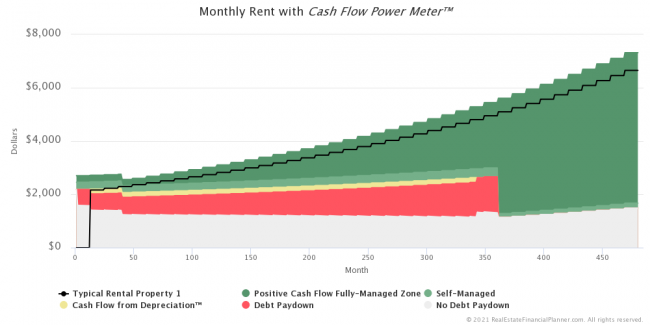
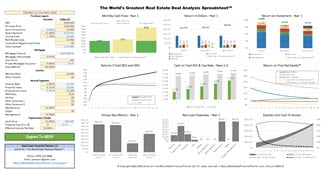
Here’s the Cash Flow Power Meter™ for it.

Over time, it looks like this:
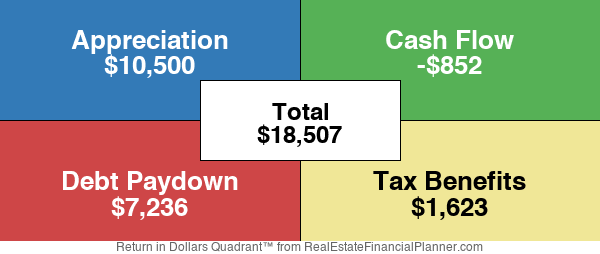
And, here’s the Return in Dollars Quadrant™ for the property.
Financing Tangent
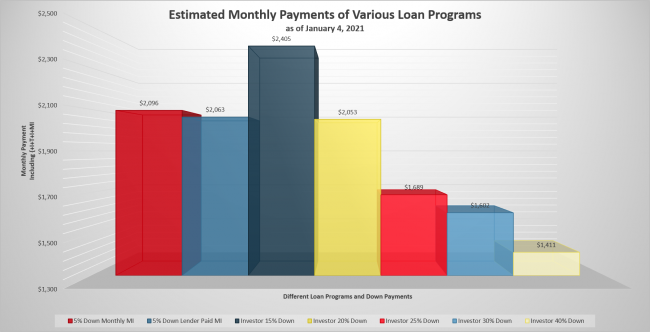
Then, in the class I went off on a side tangent about financing with an updated version of my loan type comparisons.
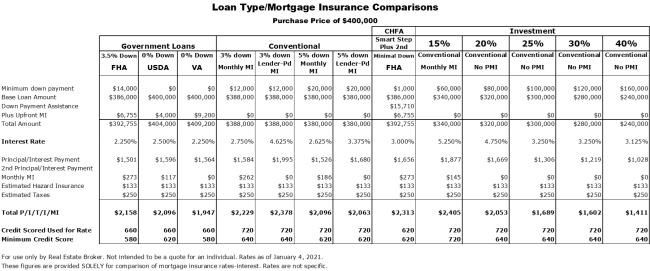
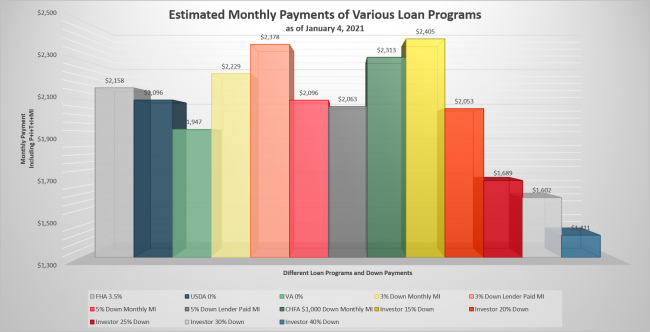
And, I show the estimated monthly payment for the table above in a variety of new forms.
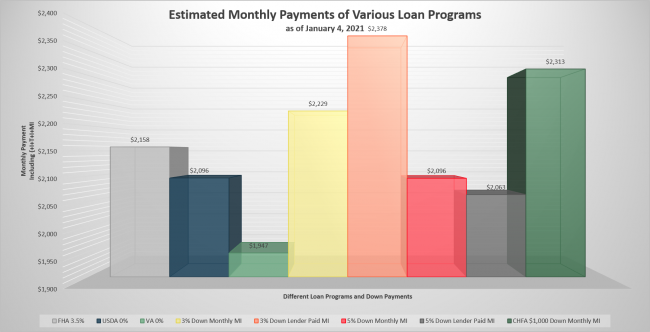
Or, just the owner-occupant loans:
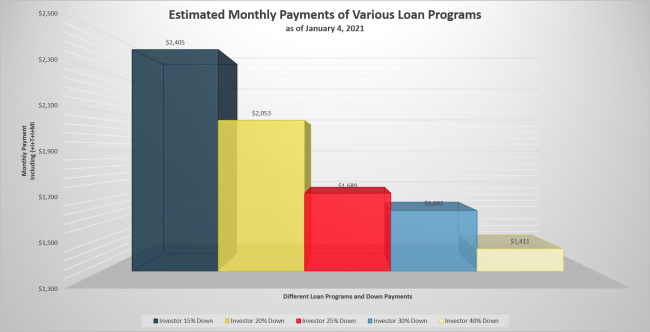
Or, just the non-owner-occupant (investor) loans:
Or, finally, a comparison of all the non-owner-occupant loans with just the 5% down owner-occupant options as well.
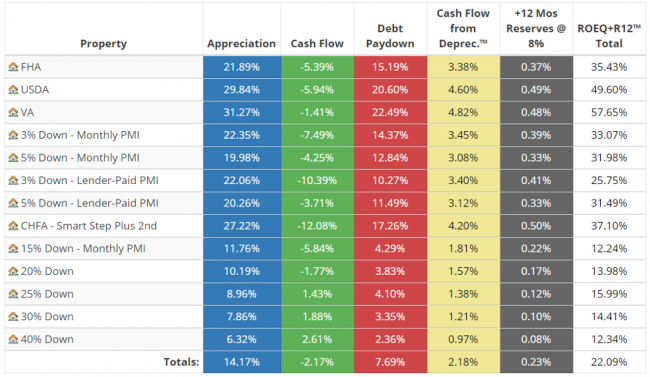
If we looked at each of these loan options (from the table above) in terms of the return quadrant’s components of return but in a table, here’s what we get.
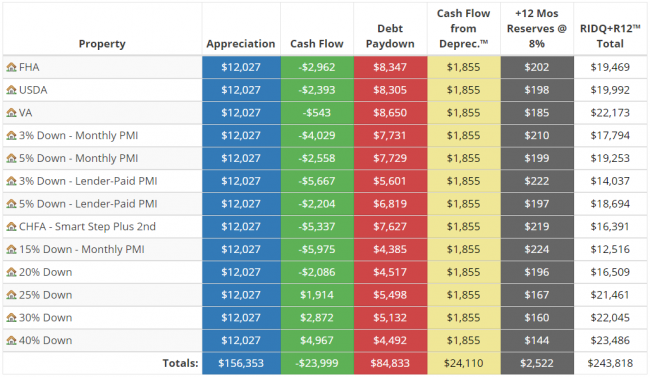
By the way, you can see this same information for your own portfolio (and even future purchases) by entering your own stuff in the Real Estate Financial Planner™ software.
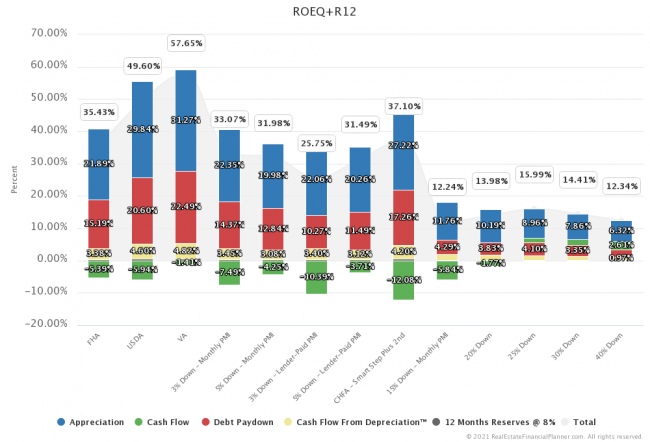
Continuing, if we take the same info in the Return in Dollars Plus Reserves™ table and created a chart of it, you get the following.
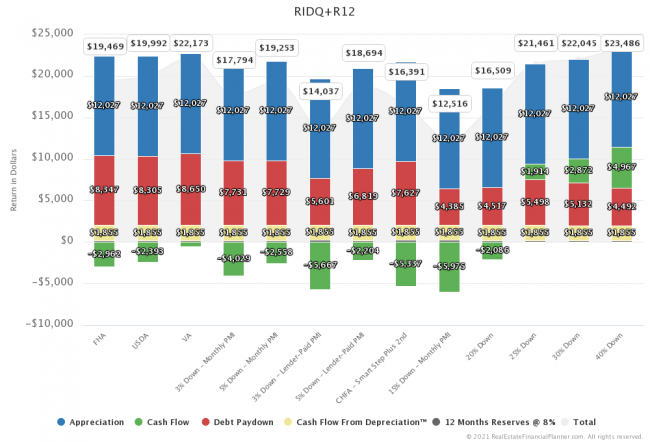
Since, we’re comparing different loans buying the same property, the appreciation and Cash Flow from Depreciation™ will remain unchanged. So, we can eliminate those two (and the total) from the chart to eliminate some noise.
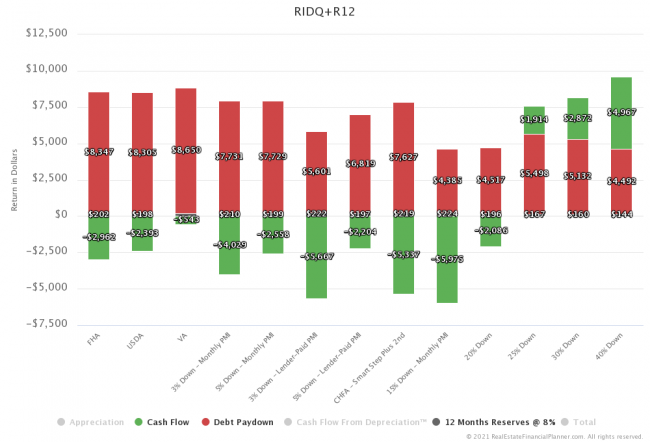
But, if we are varying the down payment, is it really appropriate to compare getting one cash flow with nothing down versus getting another cash flow with 40% down? Not really.
It would be better if we took the amount of return and divided by the amount we put down (or in this case the equity in the property) to get a feel for what our return on equity was. That’s this next table.
And, taking that table and showing it on a chart for easier comparison, we get the following Return on Equity Plus Reserves chart.
And, that was the end of my tangent on financing. Back to the focus of the presentation: real estate investing or college.
What’s Different
So, we’ve talked about what is the same between going to college and investing in real estate instead. What’s different?
For going to college, I assumed:
- College costs $25,000 per year – assume this includes room and board too
- Earns $80K per year after college – adjusts with inflation
- Saves/invests $30K of their $80K income per year
- Buys house to live in after college
- Higher income, likely higher income tax – may mean slightly worse standard of living
For investing in real estate instead of going to college, I assumed:
- No cost for college
- Earns $50K per year immediately – saves/invests $0 of $50K income per year
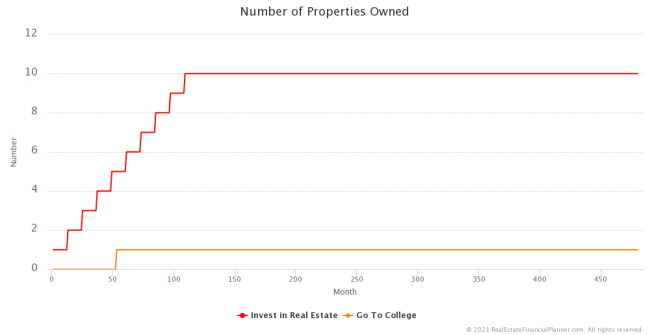
- Buys house to live in immediately as Nomad™ and keeps buying until they have 10 properties total (9 rentals and 1 to live in)
- Lower income (and depreciation), likely lower income tax – may mean slightly better standard of living
Comparison Charts
The following are some charts comparing the two  Scenarios
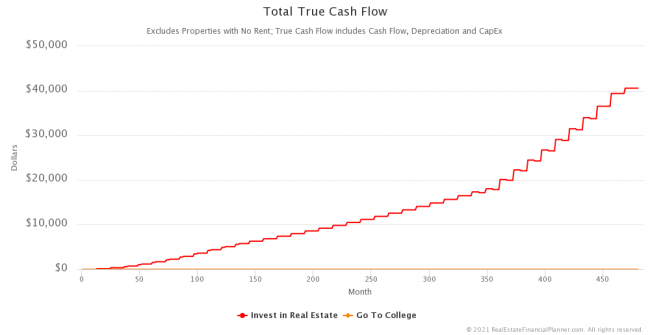
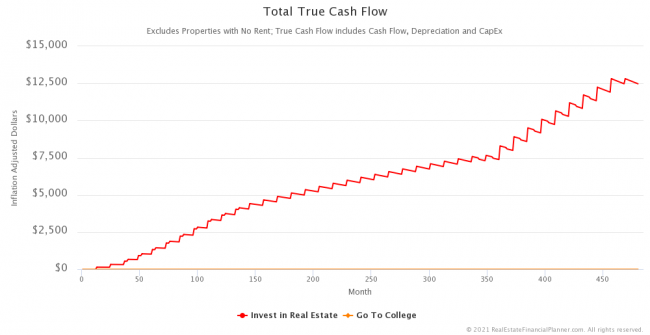
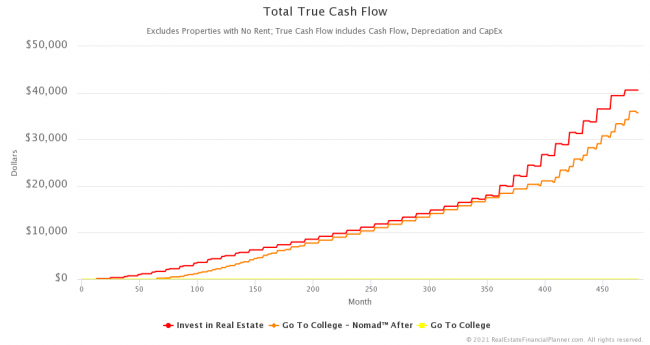
How much True Cash Flow™ does the real estate investor make? Here’s a chart.
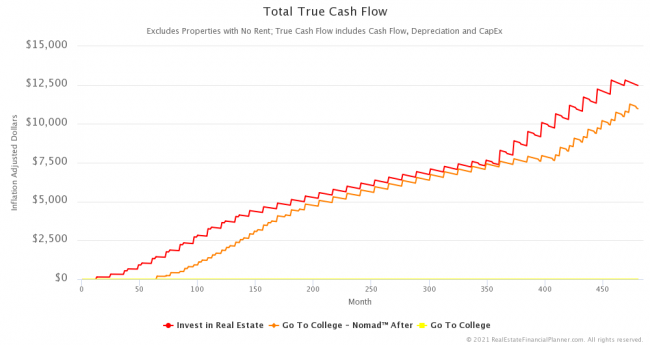
And, if you’re thinking in terms of today’s dollars (non-inflated), here’s the same True Cash Flow™ chart in inflation-adjusted dollars.
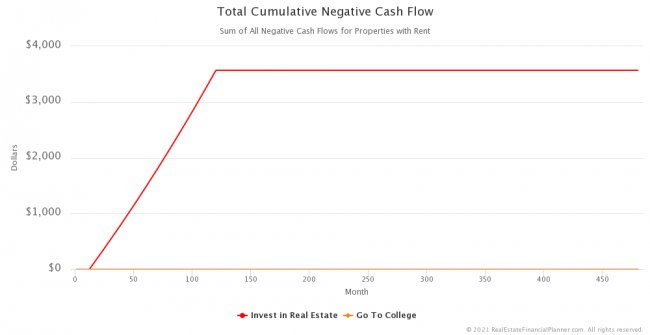
These are not the most amazing cash-flowing properites. How much negative cash flow did the real estate investor need to endure with this strategy? Here’s a chart.
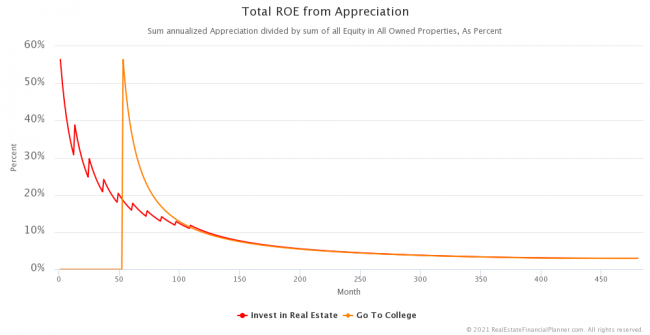
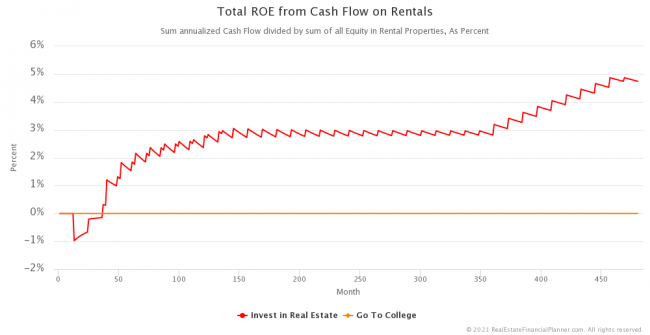
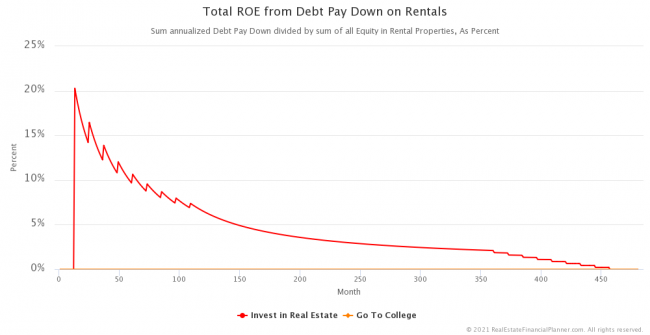
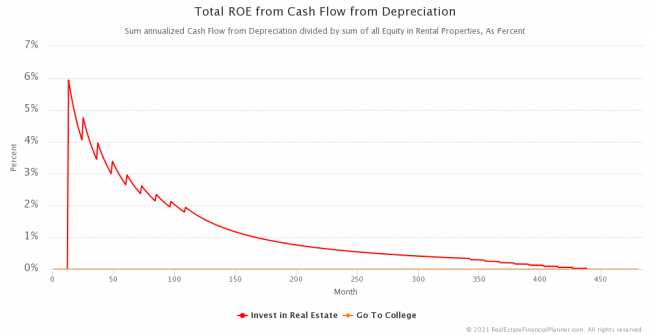
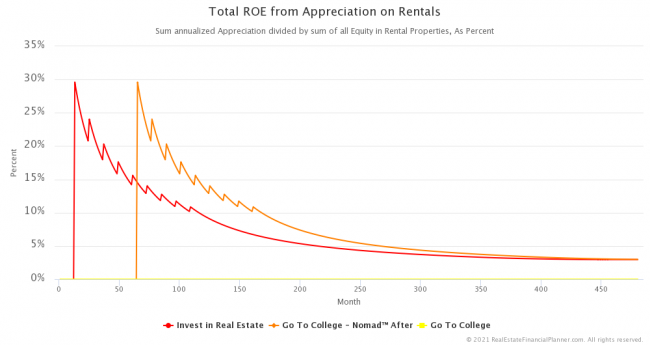
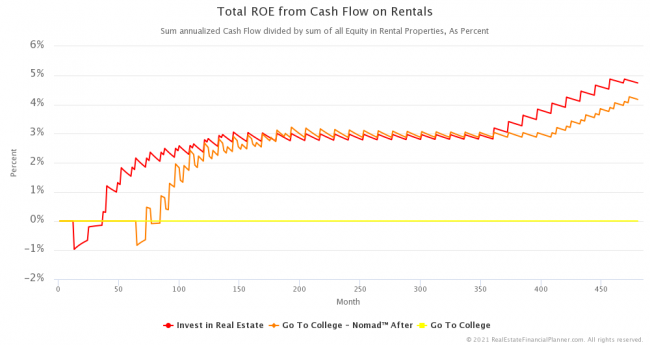
One of the benefits the real estate investor has over the college graduate is that they get to start earning high rates of return earlier by purchasing rental properties.
Here are a few examples of that with charts showing the Return on Equity for a variety of components.
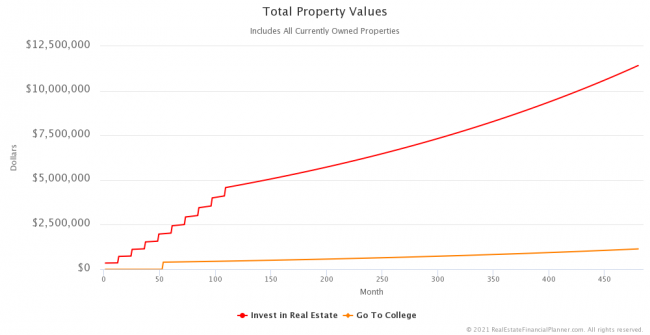
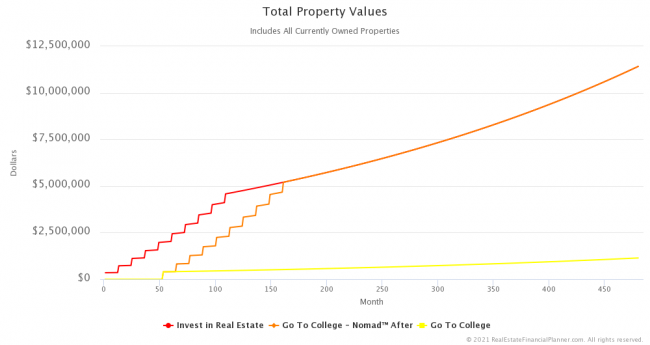
How much are all the properties the real estate investor is buying worth?
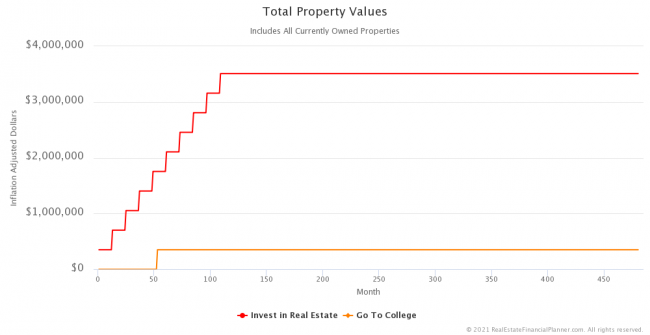
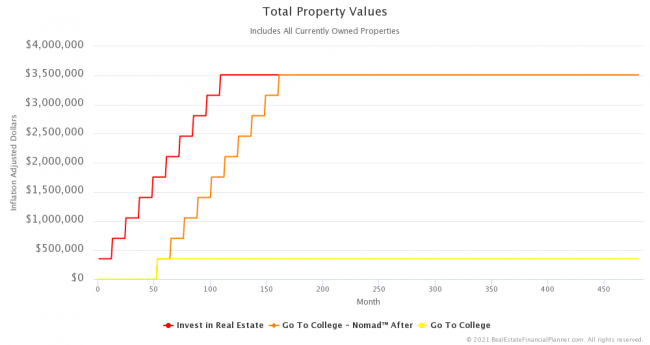
But those are inflated values. What if we adjust for inflation and show the property values in today’s dollars? Queue new chart.
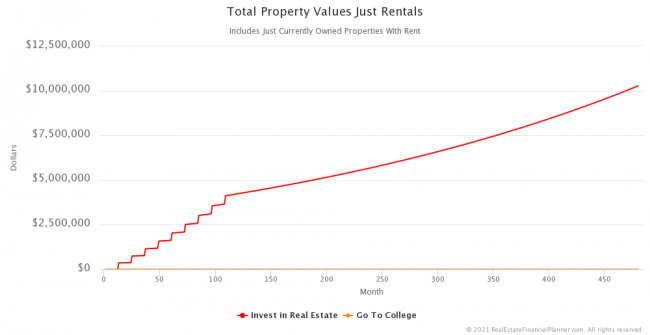
What if we exclude the properties they’re living in and just look at the value of the rentals?
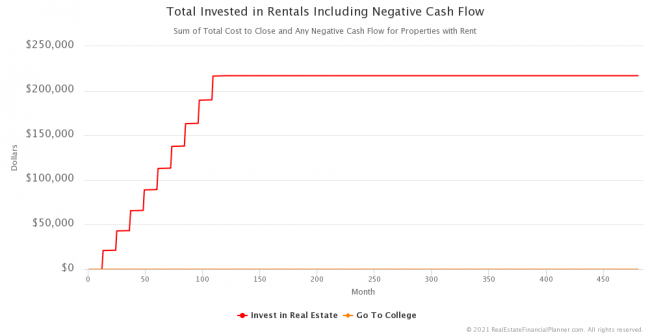
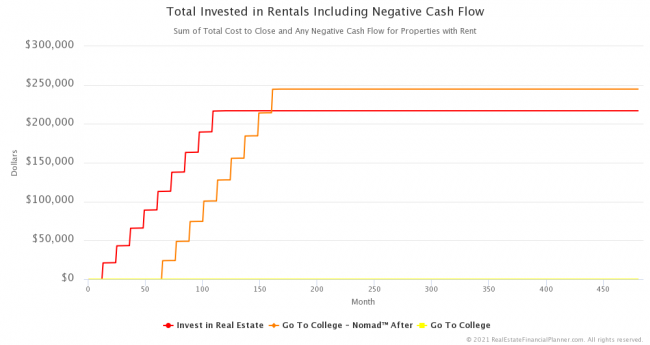
But how much did the real estate investor have to invest—including any negative cash flow—to acquire that many rentals?
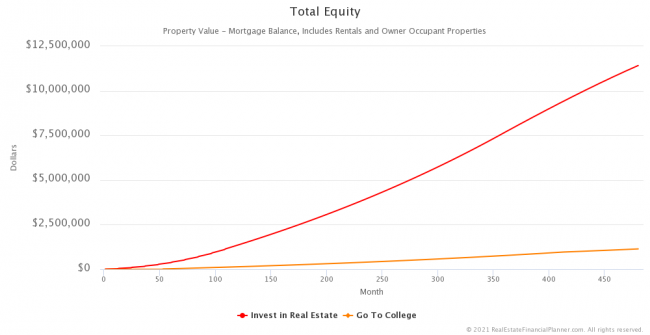
How much equity does each have in the properties they own (including rentals and owner-occupant properties)?
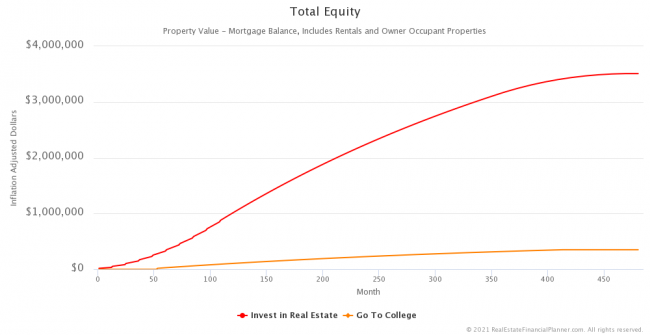
And, what about the same equity chart above, but adjusted for inflation back to today’s dollars?
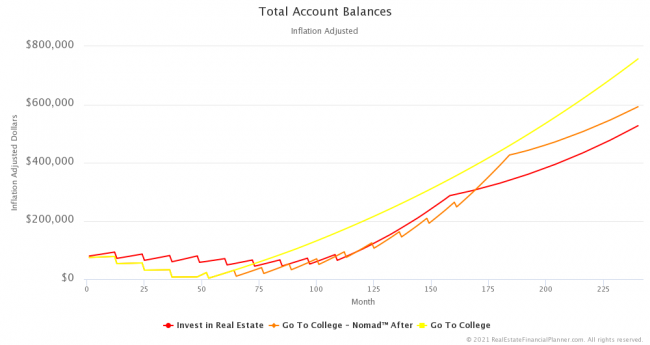
But, how much money do they have in their “bank account” or investment account?
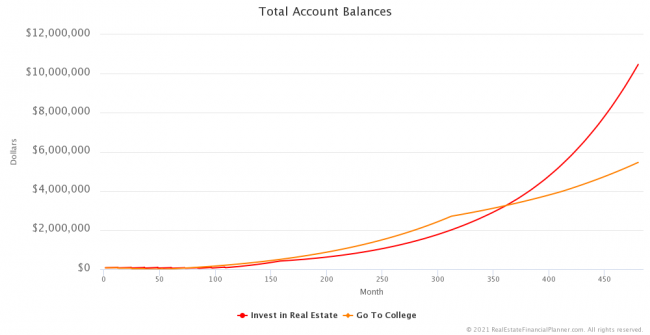
It is hard to see what is going on in the chart above early in the Scenario
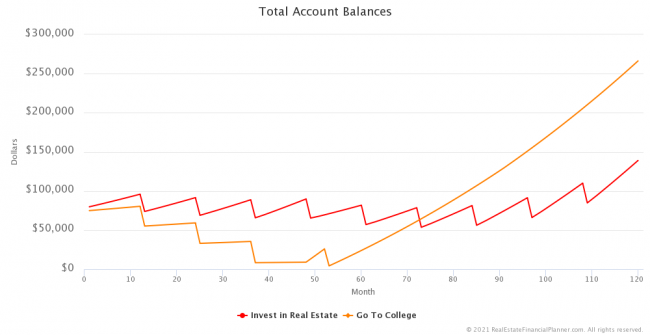
And, here’s the first 20 years.
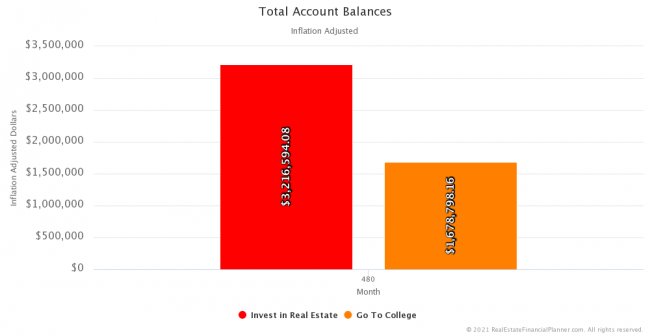
And here’s how the two compare when we just look at their ending account balance in year 40.
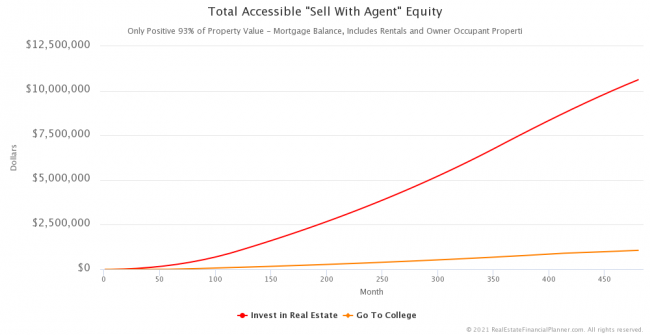
How about how much equity they have if they were to sell the properties with a real estate broker?
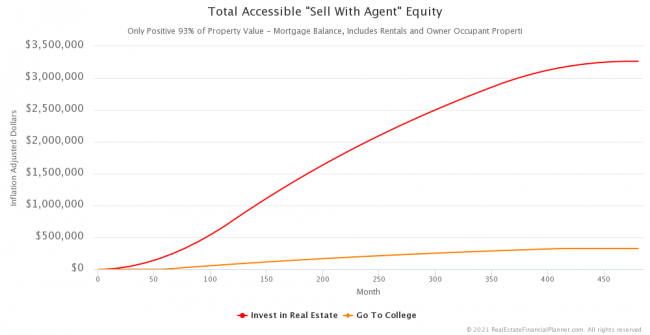
That’s in inflated dollars. How much “Sell With Agent” equity do they have if we adjust back for inflation to today’s dollars?
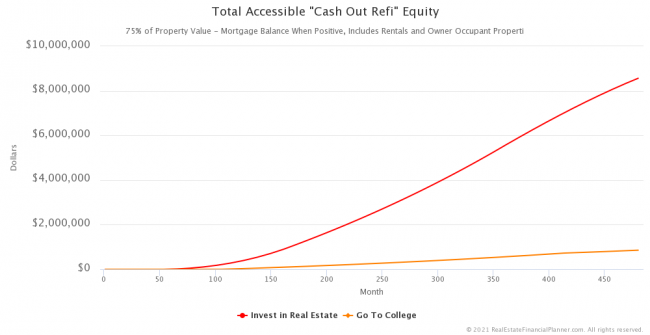
That was equity if they sold with an agent. How much equity do they have for cash flow refinances instead?
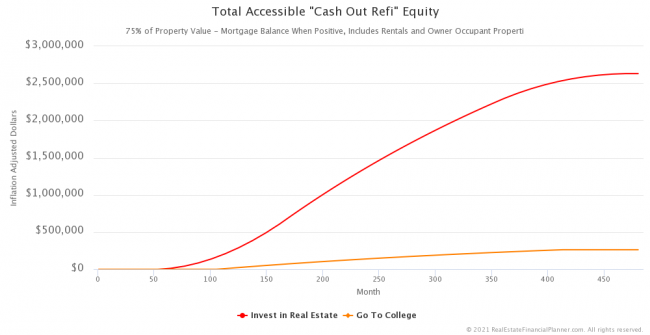
If we adjust for inflation?
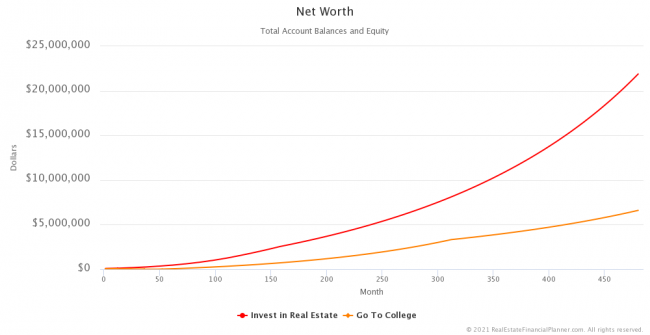
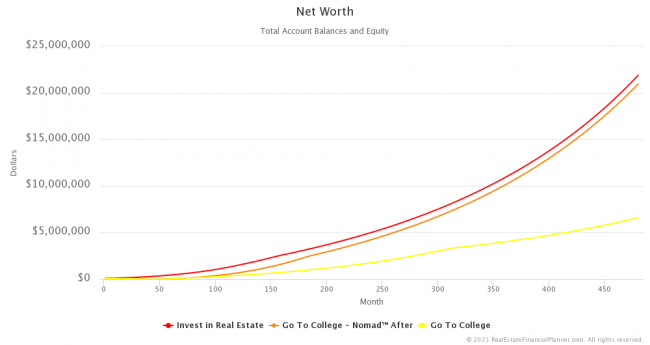
Net worth takes into account account balances and equity. Here’s the net worth comparison.
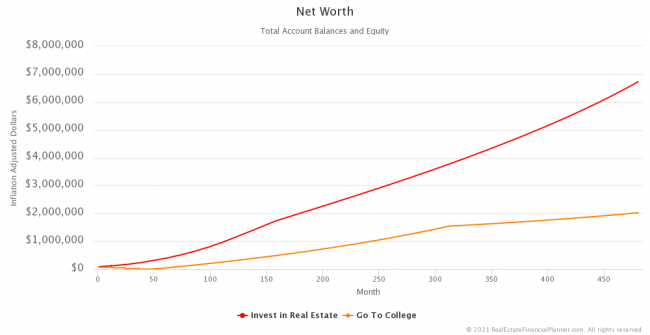
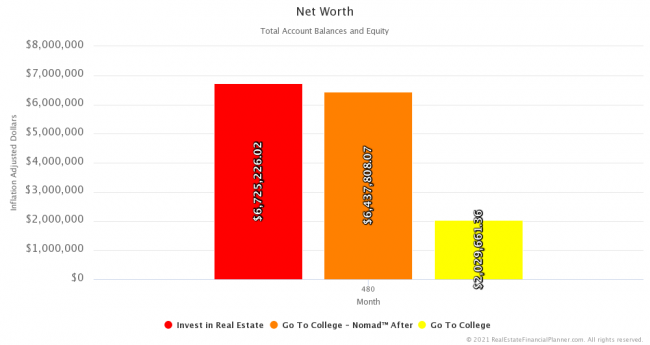
That was in inflated, future dollars. How about net worth in today’s dollars?
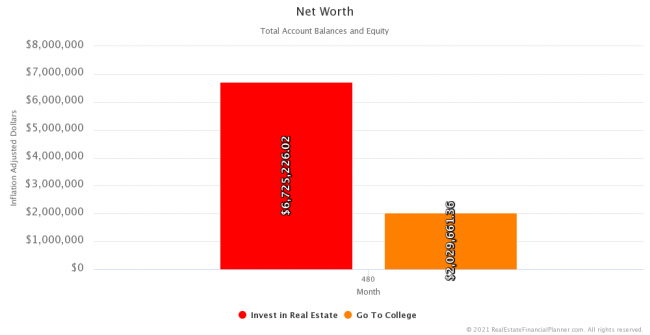
And, here’s an easier way to see how net worth compares in year 40, adjusted for inflation.
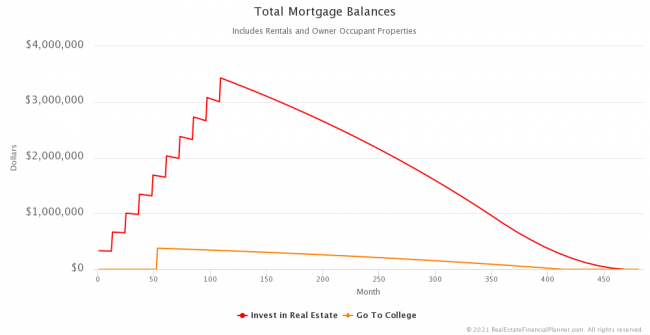
Sure, the real estate investor has some good net worth, but they had to take on some real estate debt to do it. How much was the total amount in mortgage balances?
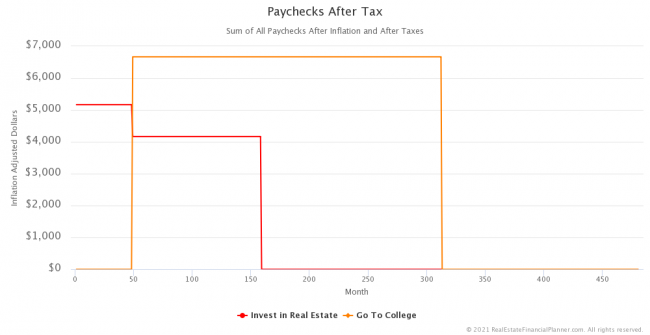
Next, let’s dig a bit into the income (paychecks) coming in at various points of time.
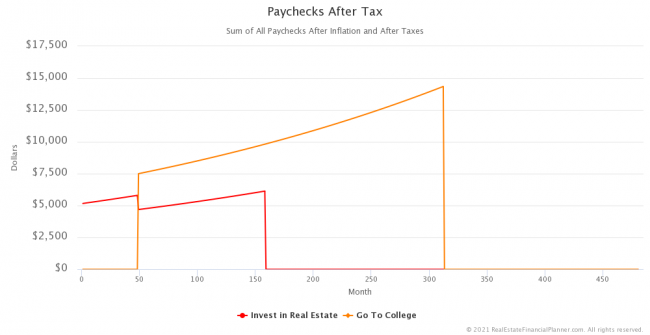
The chart above shows each getting cost-of-living adjustments for inflation. The chart below shows paychecks if we adjust back for inflation to today’s dollars.
How much is each saving? Let’s start first with the real estate investor skipping college.
And, here’s the college graduate’s savings rate.
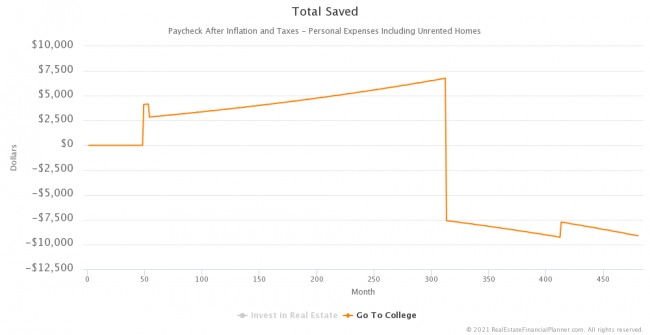
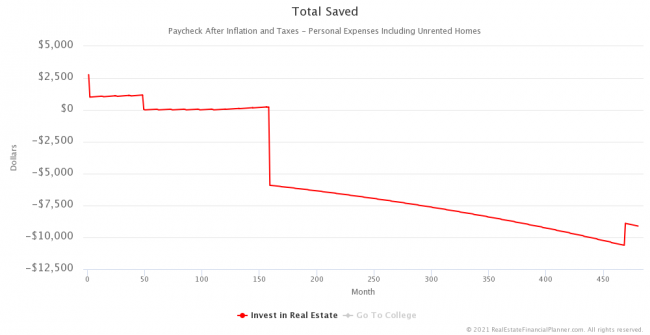
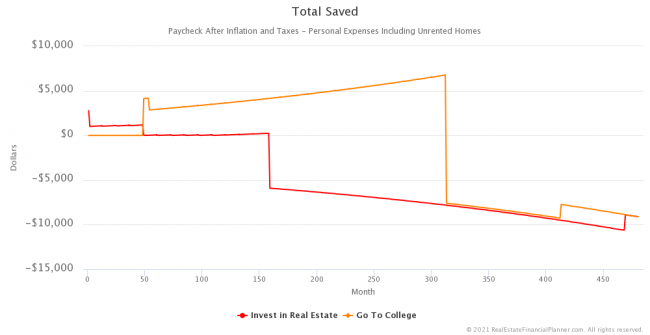
And, let’s look at the total amount saved for both on the same chart.
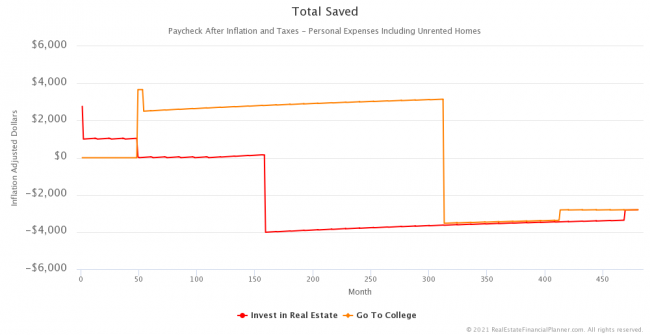
And, if we adjust the total amount saved for inflation and show it is inflation-adjusted dollars.
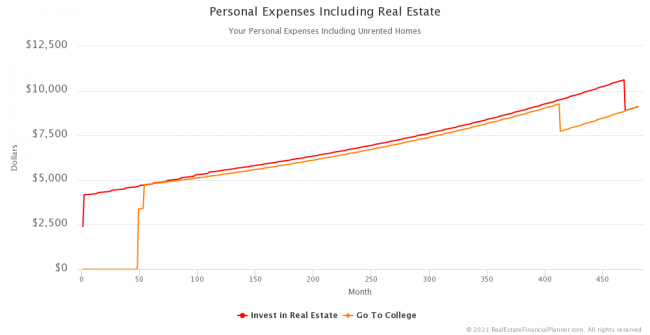
What about personal expenses?
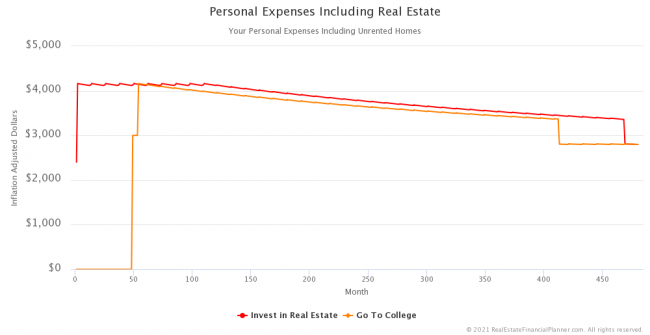
If we adjust personal expenses for inflation?
The Reveal
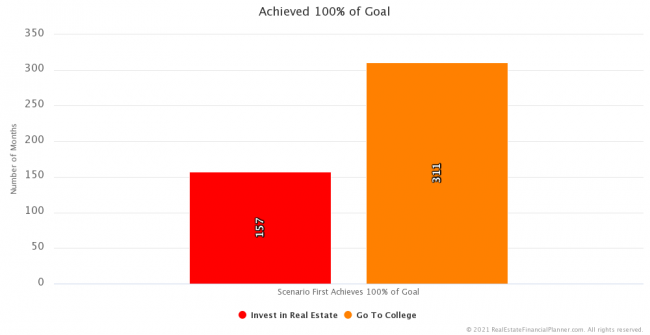
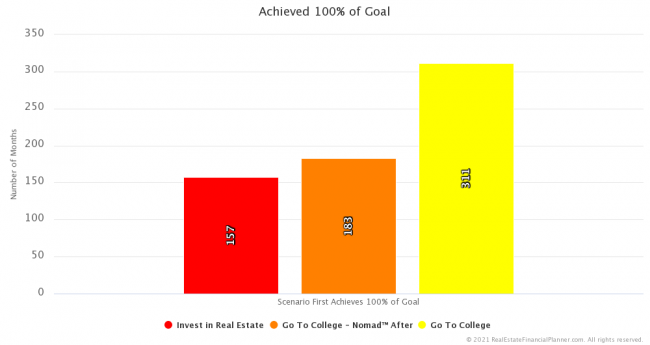
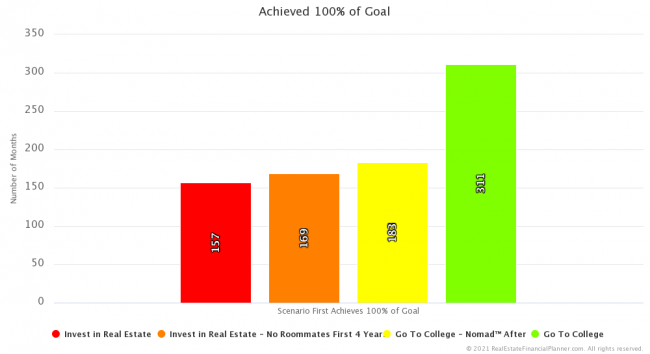
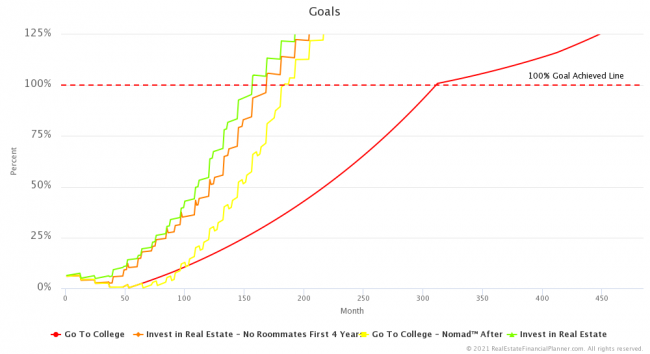
So, who achieves financial independence faster?
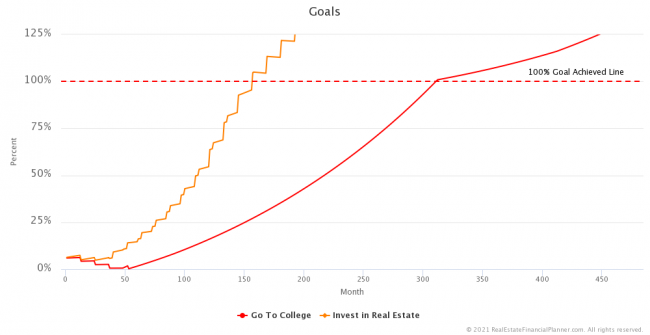
Looks like the real estate investor has a significantly faster pace to achieve financial independence.
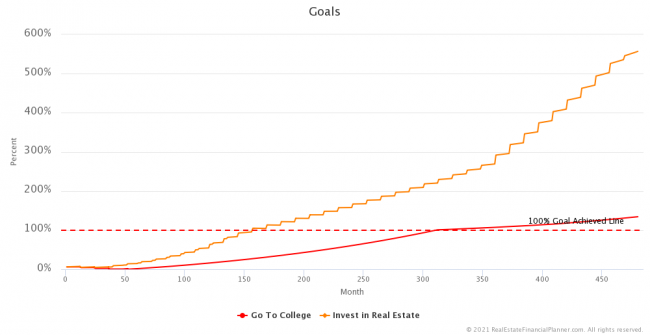
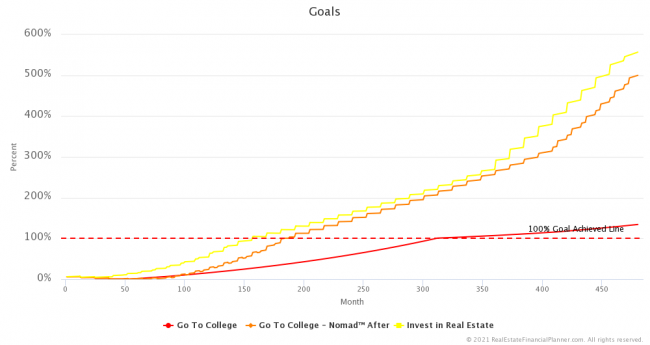
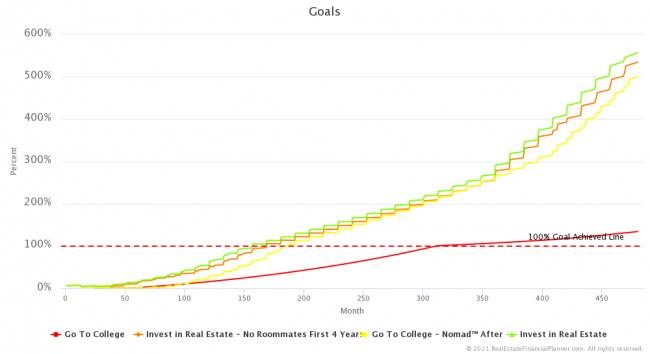
But, additionally, check out just how much more than their goal (dotted red line at 100%) they each achieved.
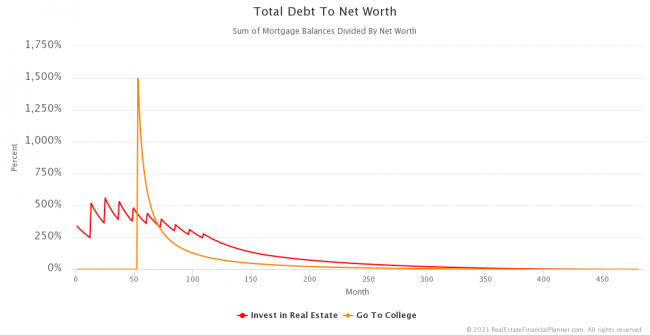
Comparing Risks of Each Plan
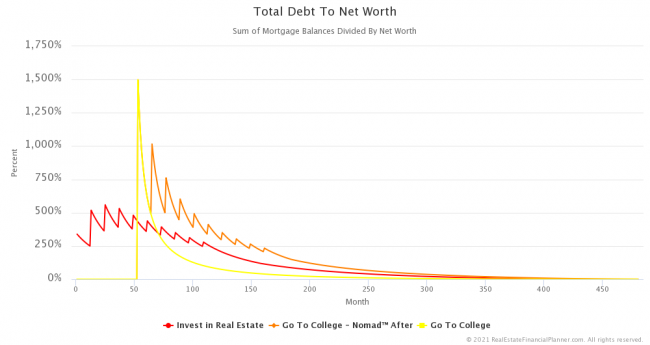
But, which is more risky? One way to measure risk is to look at how much total debt they have compared to their net worth.
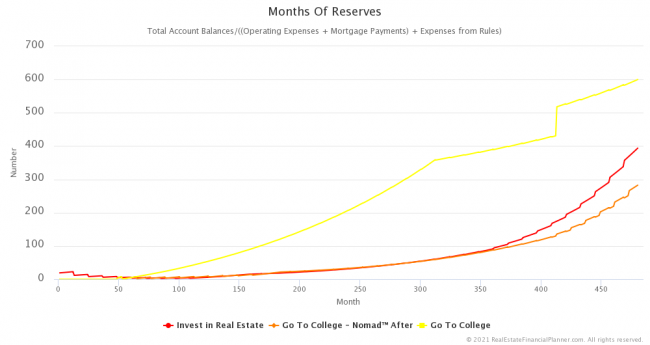
And, another way we look at risk is how many months of reserves they have.
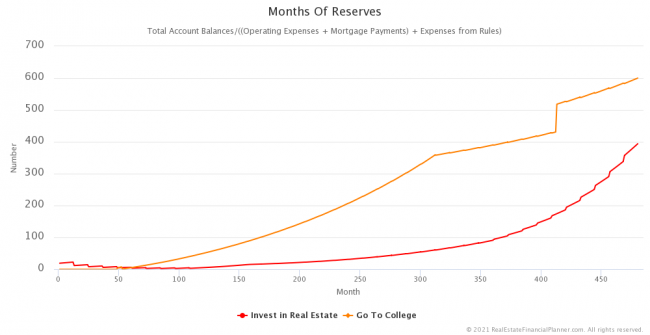
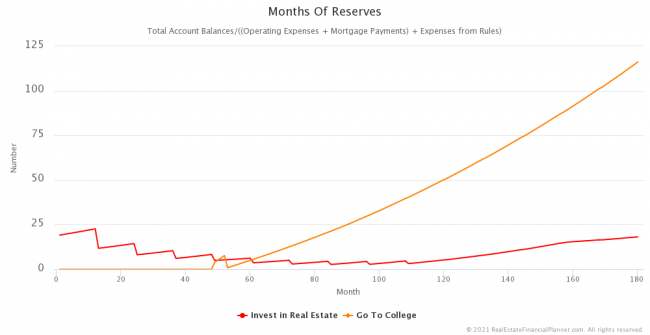
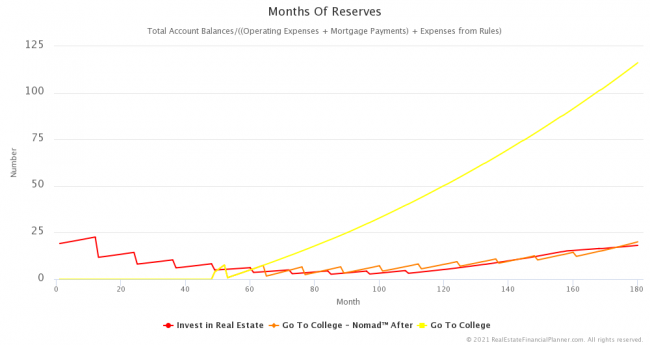
It might be hard to see the first 15 years or so in the chart above, so let’s zoom in and take a look at that period.
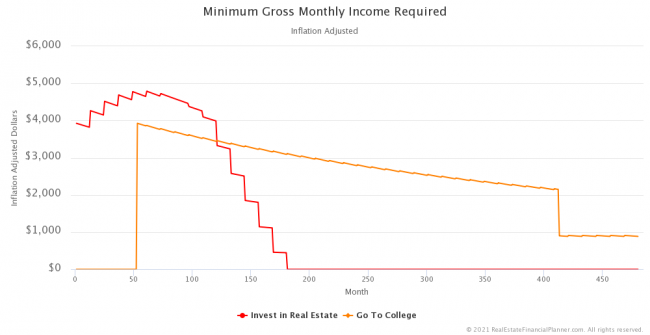
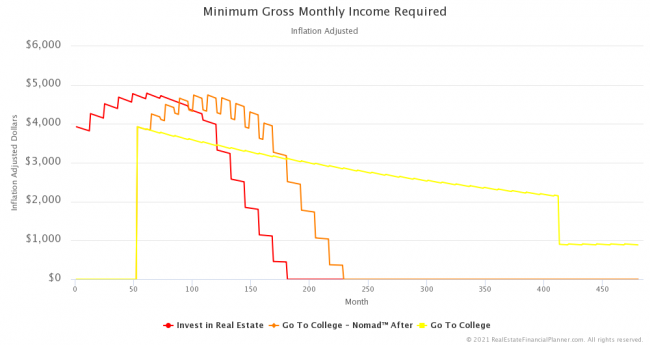
Can The Real Estate Investor Qualify For Mortgages?!
With an income of $50,000 per year, can the real estate investor qualify for ten 5% down payment loans? It is super close.
An Alternative Way Of Thinking About This
When you go to college, you invest $100K to earn $30K more per year in income.
When you skip college to invest in real estate, you invest $100K to earn the following with a property…
…but remember, you’re getting 4 of these properties!
So, you’re getting 4 times those numbers per year.
Nomad™ Unfair Advantage?
When we compared skipping college to invest in real estate to someone going to college, we assumed the real estate investor invested using the Nomad™ real estate investing strategy and the college graduate invested in a home to live in and then stocks.
Is the Nomad™ real estate investing strategy an unfair advantage? What if our college graduate Nomads™ after finishing college? Is that better?
They acquire 10 properties in both cases.
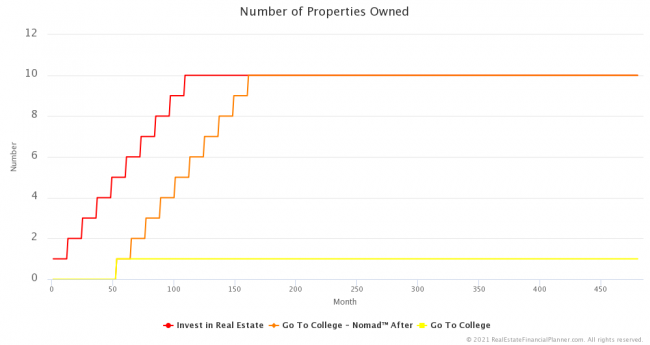
They get the same great returns from owning real estate, but the college graduate is staggered out by a little more than 4 years.
And they also enjoy similar True Cash Flow™, but also delayed by a few years.
If we adjust for inflation, Total True Cash Flow™ looks like this.
Eventually—since they’re buying the same properties—they have 10 properties worth the same exact amount in total.
If we adjust that chart for inflation, we see they eventually both own about $3.5 million in real estate.
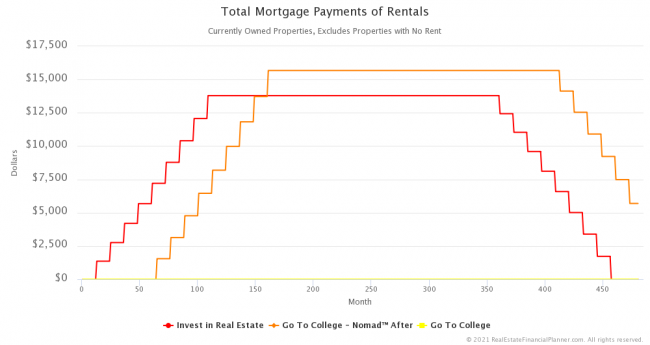
The college graduate ends up with high mortgage payments (because they waited and bought slightly more expensive properties).
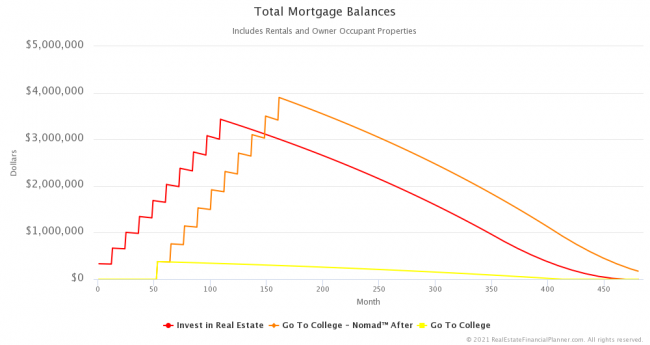
Here are the comparative mortgage balances.
How much did each need to invest—including negative cash flow—to acquire the 10 properties (9 rentals and the 1 owner-occupant)?
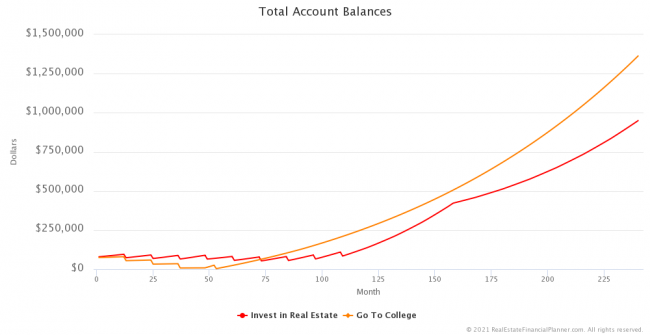
What about account balances?
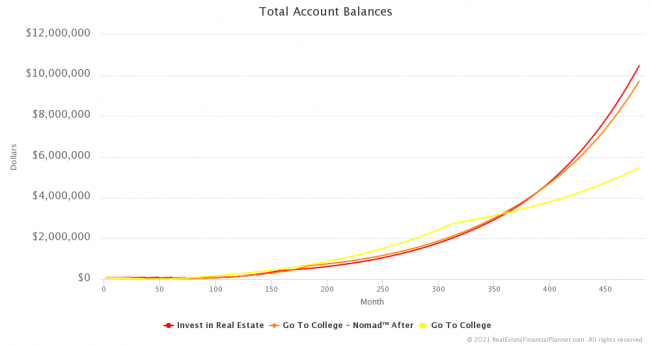
It is hard to see what is happening with the account balances early on, so here’s a zoom of the first 20 years.
How quickly do they achieve the goal of financial independence now that they’re both Nomading™?
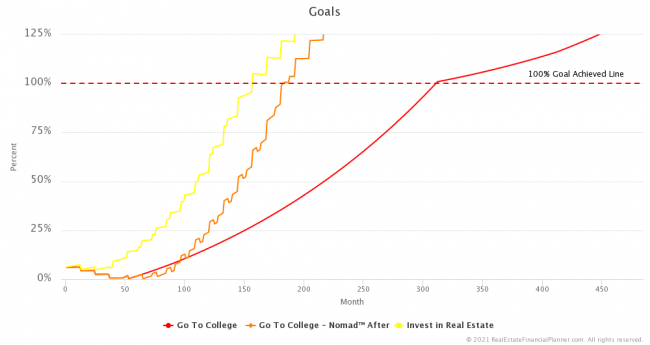
It helps a lot…
And, similarly they can now enjoy a higher standard of living as well.
And much better net worth, but still not quite as good as skipping college to invest in real estate.
Here’s a quick comparison of net worth, adjusted for inflation in year 40 between the three Scenarios
But how about risk? A little riskier for the college graduate?
If we zoom in to see the first 15 years, we can see more about what is happening with reserves.
Looking at the Total Debt to Net Worth chart to estimate a measure of risk, we can see that going to college keeps with a higher risk and for a longer period of time.
Can the college graduate afford the mortgages? Yes. Much easier than skipping college and investing in real estate.
Real Estate Investor – No Roommates
For our original assumptions, the real estate investor that skipped college got roommates for the first 4 years at $500 per roommmate per month ($1,000 per month total).
What if they don’t get roommates?
And they still enjoy a very high standard of living.
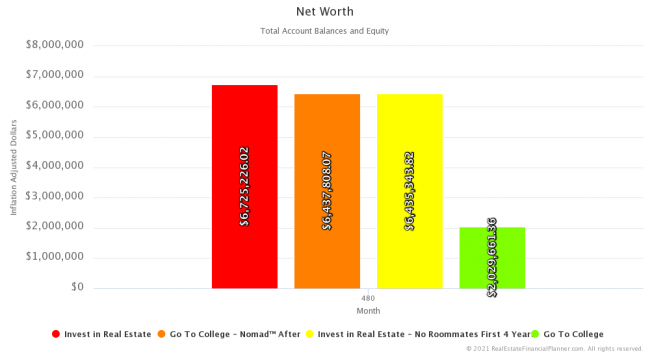
And, finally, comparing net worth for the 4 Scenarios
Not Discussed
While we did cover 4 Scenarios
For example, we did not discuss paying off properties early including selling properties and using the equity to pay off other propreties.
We did not discuss doing cash out refinances to retire early while we are waiting for the other properties to improve cash flow when we reach true financial independence.
Nor did we discuss coasting into retirement.
And, our assumptions were static. 3% appreciation, rent appreciation and 8% return in the stock market. We did not discuss modeling variability in returns. Nor did we do any  Monte Carlo
We did the basic Scenarios
If you decide this is your investing strategy, I’d strongly encourage you pursue these advanced options to better understand the pros and cons before implementing.
Change My Assumptions
As I mentioned in the class, you’re definitely going to want to change my assumptions and run these Scenarios
Rather than starting over from scratch entering in the details, copy any of my examples into your account and just modify.
Login to copy this Scenario. New? Register For Free
Scenario into my Real Estate Financial Planner™ Software
Go To College with 2  Accounts, 1
  Property, and 7
  Rules.
Or, read the detailed, computer-generated, narrated  Blueprint™
Login to copy this Scenario. New? Register For Free
Scenario into my Real Estate Financial Planner™ Software
Go To College - Nomad™ After with 2 Accounts, 1 Property, and 7 Rules.
Or, read the detailed, computer-generated, narrated Blueprint™
Login to copy this Scenario. New? Register For Free
Scenario into my Real Estate Financial Planner™ Software
Invest in Real Estate with 2 Accounts, 1 Property, and 4 Rules.
Or, read the detailed, computer-generated, narrated Blueprint™
Login to copy this Scenario. New? Register For Free
Scenario into my Real Estate Financial Planner™ Software
Invest in Real Estate - No Roommates First 4 Years with 2 Accounts, 1 Property, and 3 Rules.
Or, read the detailed, computer-generated, narrated Blueprint™
Real Estate Investing Classes
Interested in learning more about real estate investing? Check out the list of real estate investing classes.
Amazing analysis–thanks! I showed this to my son who is 18.
Thanks Daniel. Glad you enjoyed it; hope your son did too. Thank you!