Most real estate investors are leaving 75% of their returns on the table. They obsess over monthly cash flow while completely ignoring three other powerful wealth-building components that could be doubling or even tripling their investment returns. If you’re only looking at whether a property “cash flows,” you’re making the same costly mistake that keeps amateur investors from building serious wealth through real estate.
The Return on Investment Quadrant™ revolutionizes how savvy investors analyze deals by revealing all four primary components of real estate returns. This comprehensive framework shows you exactly how much money you’re making from appreciation, cash flow, tax benefits through depreciation, and mortgage principal paydown—all divided by your initial investment. When you understand and optimize all four quadrants, you transform from a cash flow chaser into a sophisticated investor who maximizes total returns.
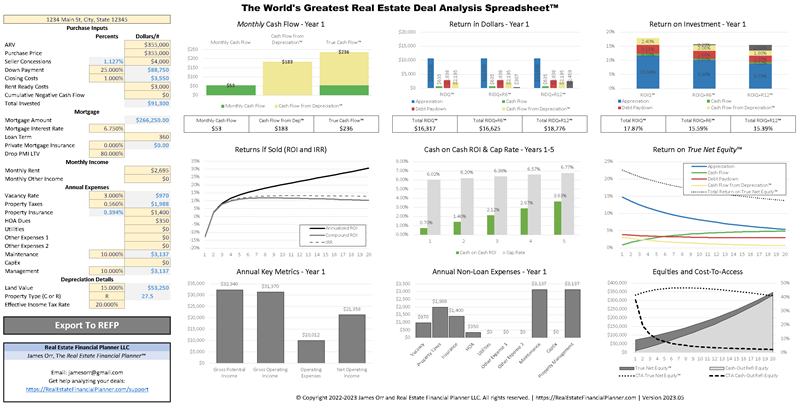
In this ultimate guide, you’ll discover how to calculate and optimize each component of the Return on Investment Quadrant™ using The World’s Greatest Real Estate Deal Analysis Spreadsheet™. You’ll learn advanced strategies for manipulating the quadrants to your advantage, see real-world examples of how different investment approaches affect your returns, and understand why this framework is essential for building long-term wealth through real estate.
Understanding the Return on Investment Quadrant™
The Return on Investment Quadrant™ represents the total return from your real estate investment divided into four distinct components, each calculated as a percentage of your initial investment (your total cost to close). This framework transforms complex real estate returns into a simple, visual system that instantly shows you where your profits are really coming from.

At its core, the Return on Investment Quadrant™ divides your total returns into four primary components that work together to build your wealth:
- Appreciation – The increase in your property’s value over time, whether through market forces or your own improvements
- Cash Flow – The monthly rental income that remains after paying all expenses, including mortgage, taxes, insurance, and maintenance
- Cash Flow from Depreciation™ – The tax benefits you receive from depreciation deductions, putting more money in your pocket each year
- Debt Paydown – The mortgage principal reduction that happens automatically as your tenants pay rent, building your equity month by month
Think of these four components as the four cylinders of your real estate wealth engine. When all four fire properly, your investment accelerates toward financial independence. When you only focus on one—typically cash flow—you’re running on one cylinder and wondering why other investors seem to build wealth so much faster.
The visual representation of the Return on Investment Quadrant™ displays these four components as equal quarters of a square, making it instantly clear how balanced or imbalanced your returns are. This visual approach helps you quickly identify which properties in your portfolio are truly high performers and which strategies produce the best total returns. The Real Estate Financial Planner™ automatically calculates your Return on Investment Quadrant™ at the bottom of each property’s assumptions page, eliminating complex manual calculations.
Breaking Down Each Quadrant Component
Appreciation
Appreciation represents the increase in your property’s market value over time, often the largest component of real estate returns over the long term. While you can’t control market appreciation, you can position yourself in growing markets and force appreciation through strategic improvements. Historical data shows real estate typically appreciates 3-5% annually, but this varies dramatically by location and property type.
Calculating appreciation return requires projecting future property values based on historical trends and market analysis. The World’s Greatest Real Estate Deal Analysis Spreadsheet™ allows you to model different appreciation scenarios, from conservative 2% annual growth to aggressive 7% projections. Smart investors focus on markets with strong job growth, population increases, and limited housing supply to maximize this quadrant.
The power of appreciation compounds over time, turning modest annual gains into substantial wealth. A $300,000 property appreciating at 4% annually becomes worth over $438,000 in ten years—that’s $138,000 in profit from appreciation alone. This return requires no additional work from you once you’ve selected the right property in the right market.
Cash Flow
Cash flow is the monthly income remaining after all operating expenses and debt service, providing immediate returns you can spend or reinvest. While many investors fixate solely on cash flow, it typically represents only 25% of total returns in a balanced investment. Accurate cash flow projections require realistic estimates for rent, vacancy, maintenance, property management, taxes, insurance, and mortgage payments.
The World’s Greatest Real Estate Deal Analysis Spreadsheet™ helps you model various cash flow scenarios, including different rent levels, expense ratios, and financing terms. Professional investors know that properties with marginal cash flow today can become cash flow monsters as rents increase and mortgages remain fixed. A property breaking even today might generate $500 monthly in five years as rents rise 3% annually.
Cash flow provides financial flexibility and helps you weather economic storms, but don’t let cash flow blindness prevent you from seeing deals with massive appreciation potential or tax benefits. The best investments optimize all four quadrants, not just the one that puts money in your pocket each month.
Cash Flow from Depreciation™
Cash Flow from Depreciation™ transforms a paper loss into real money in your bank account through reduced tax liability. The IRS allows you to depreciate residential rental properties over 27.5 years, creating substantial tax deductions that offset rental income and sometimes even W-2 income. This “phantom expense” doesn’t cost you anything out of pocket but significantly reduces your tax bill.
For a $300,000 property with $250,000 in depreciable basis, you’ll deduct approximately $9,090 annually. If you’re in the 24% tax bracket, that’s $2,182 in actual tax savings each year—money that flows directly to your bottom line. The World’s Greatest Real Estate Deal Analysis Spreadsheet™ calculates these tax benefits automatically, showing you how depreciation affects your true returns.
Advanced investors maximize this quadrant through cost segregation studies, which accelerate depreciation on certain property components. This strategy can double or triple your depreciation benefits in early years, dramatically improving your Return on Investment Quadrant™. Remember, depreciation recapture upon sale requires strategic planning, but the time value of money often makes aggressive depreciation worthwhile.
Debt Paydown
Debt paydown represents the silent wealth builder that many investors completely overlook when evaluating returns. Every month, your tenant’s rent payment reduces your mortgage principal, automatically increasing your equity position. This forced savings plan requires no additional investment from you yet steadily builds your net worth month after month.
On a $240,000 mortgage at 7% interest, your first year’s principal paydown equals approximately $2,411, increasing each year as more payment goes toward principal. By year ten, you’re reducing principal by over $5,000 annually. The World’s Greatest Real Estate Deal Analysis Spreadsheet™ tracks this wealth accumulation precisely, showing how debt paydown accelerates over time.
The beauty of debt paydown lies in its reliability and automation. Unlike appreciation that depends on market conditions or cash flow that varies with expenses, debt paydown happens like clockwork every single month. Over a 30-year mortgage, your tenants completely pay off your property, transferring hundreds of thousands in wealth to your net worth while you simply manage the investment.
Calculating Your Return on Investment Quadrant™
Calculating your Return on Investment Quadrant™ starts with determining your true initial investment—your total cost to close including down payment, closing costs, and any immediate repairs. This becomes your denominator for all return calculations. Many investors mistakenly use only their down payment, inflating their perceived returns and leading to poor investment decisions.
The World’s Greatest Real Estate Deal Analysis Spreadsheet™ automates these calculations, but understanding the math helps you make better decisions. For each quadrant: divide the annual dollar return by your initial investment, then multiply by 100 for a percentage. If appreciation adds $12,000 in value and you invested $60,000, that quadrant shows a 20% return.
Let’s walk through a real example: You purchase a $300,000 property with 20% down ($60,000) plus $5,000 in closing costs, making your total investment $65,000. Year one returns include: $12,000 appreciation (4%), $3,600 cash flow ($300/month), $2,182 tax savings from depreciation, and $2,411 in principal paydown. Your total return equals $20,193 or 31% on your $65,000 investment.
Common calculation mistakes include forgetting to account for all closing costs, using incorrect depreciation calculations, ignoring principal paydown, or comparing properties with different leverage amounts. Always use consistent assumptions and time periods when comparing investments. The Real Estate Financial Planner™ software automatically generates Return on Investment Quadrant™ reports for each scenario, eliminating calculation errors.
Finding your Return on Investment Quadrant™ in the Real Estate Financial Planner™ software is simple: navigate to any property in your account, scroll to the bottom of the assumptions page, and you’ll see your quadrant automatically calculated and displayed. The visual representation instantly shows which components drive your returns, helping you optimize future investments.
Advanced Strategies: Manipulating the Quadrants
Deal Alchemy™ teaches you how to manipulate each quadrant to maximize total returns, transforming marginal deals into wealth-building machines. By understanding how different strategies affect each component, you become a real estate scientist, precisely engineering optimal returns for your investment goals.
Consider how down payment variations dramatically shift your quadrants:
- 20% Down Payment – Maximizes leverage, boosting all percentage returns but requiring PMI
- 25% Down Payment – Eliminates PMI, improves cash flow, but reduces percentage returns through decreased leverage
- Interest Rate Buydowns – Spending $6,000 to reduce your rate by 0.5% might improve cash flow by $150 monthly while barely affecting other quadrants
- PMI Strategies for Nomads™ – Choosing lender-paid PMI with a higher rate versus borrower-paid monthly PMI versus single premium PMI creates vastly different quadrant outcomes
The World’s Greatest Real Estate Deal Analysis Spreadsheet™ lets you model these scenarios side-by-side, revealing counterintuitive insights. Sometimes accepting negative cash flow for two years while maximizing appreciation and tax benefits produces superior five-year returns. Other times, prioritizing immediate cash flow through higher down payments makes sense for investors needing monthly income.
Rent optimization showcases another powerful manipulation strategy. A 3% rent increase might transform a marginal deal into a home run, while accepting 3% below market rent to secure a high-quality, long-term tenant could optimize your total returns through reduced vacancy and maintenance. The quadrant framework quantifies these tradeoffs precisely.
Rolling upgrades into new construction purchases demonstrates advanced quadrant manipulation. By financing $10,000 in upgrades into your purchase price, you might force immediate appreciation while barely affecting your monthly payment. This strategy optimizes your appreciation quadrant while minimally impacting cash flow—a perfect example of Deal Alchemy™ in action.
Return on Investment Quadrant™ vs Return on Equity Quadrant™
While the Return on Investment Quadrant™ measures returns against your initial investment, the Return on Equity Quadrant™ calculates returns based on your current equity position. This distinction becomes crucial as your properties appreciate and mortgages pay down, fundamentally changing how you should evaluate holding versus selling decisions.
Your Return on Investment Quadrant™ remains relatively stable over time since your initial investment never changes. However, your Return on Equity Quadrant™ typically declines as equity grows, even though dollar returns might increase. A property returning 31% on your initial $65,000 investment might only return 8% on $250,000 in equity ten years later.
Both metrics serve essential purposes in portfolio management. Use Return on Investment Quadrant™ when evaluating new purchases or comparing initial performance. Switch to Return on Equity Quadrant™ when deciding whether to hold, sell, or refinance existing properties. The Real Estate Financial Planner™ calculates both automatically, giving you complete visibility into your portfolio’s performance.
Understanding this relationship prevents emotional attachment to properties that no longer serve your wealth-building goals. That first rental property might hold sentimental value, but if it’s returning only 5% on $300,000 in equity while new investments offer 25% returns on invested capital, the numbers clearly indicate it’s time to redeploy that equity.
Conclusion and Action Steps
The Return on Investment Quadrant™ transforms real estate investing from guesswork into science, revealing exactly how each investment component contributes to your wealth. By optimizing all four quadrants—not just cash flow—you’ll build wealth faster and more reliably than investors who remain blindly focused on monthly income alone.
Your next step is analyzing your current portfolio or next potential investment using this comprehensive framework. Access your Return on Investment Quadrant™ reports within the Real Estate Financial Planner™ software by navigating to any scenario and viewing the automated calculations. For deeper learning, explore “How to Achieve Financial Independence and Live Your Passion Regardless of Age or Income,” which expands on these concepts with detailed case studies.
Take action today by downloading The World’s Greatest Real Estate Deal Analysis Spreadsheet™ and running your own quadrant analysis. Watch the recorded classes on Deal Alchemy™ and Beyond Cash Flow to see live examples of quadrant manipulation. Most importantly, stop evaluating deals based solely on cash flow—embrace the full power of the Return on Investment Quadrant™ to accelerate your journey to financial independence through real estate.