Picture this: while you sleep, your tenants are quietly building your wealth. Not through appreciation or cash flow—those get all the glory—but through the silent wealth builder of real estate investing: debt paydown. Every month, like clockwork, your mortgage balance shrinks, your equity grows, and your net worth climbs. Yet most investors overlook this powerful return when analyzing deals.
Debt paydown represents one of the four critical returns in the Return Quadrants™ framework, sitting alongside appreciation, cash flow, and tax benefits. But unlike its flashier cousins that grab headlines with promises of instant riches or massive tax savings, debt paydown works steadily in the background, delivering consistent, predictable returns that compound over time.
What makes debt paydown unique? It’s the most certain return you’ll receive from rental property investing. While property values fluctuate and rental markets soften, your mortgage balance marches downward with mathematical precision. It’s not sexy, but it’s reliable—and reliability builds fortunes.
In this comprehensive guide, you’ll discover how to maximize debt paydown as part of your investment strategy, calculate its true impact on your returns, and leverage advanced strategies to accelerate your wealth building. Whether you’re analyzing your first rental property or optimizing a portfolio of dozens, understanding debt paydown transforms how you evaluate and manage real estate investments. And yes, we’ll show you exactly how to track all of this using The World’s Greatest Real Estate Deal Analysis Spreadsheet™.
Understanding Debt Paydown in the Return Quadrants™ Framework
Debt paydown, simply put, is the reduction of your mortgage principal balance over time. Every payment you make (or more accurately, your tenants make for you) includes both interest and principal. The principal portion directly reduces what you owe, building equity dollar for dollar. It’s forced savings at its finest—wealth building on autopilot.

Within the Return Quadrants™ framework, debt paydown occupies a unique position that reveals its true nature:
- Bottom Half Placement – Unlike appreciation and cash flow that sit in the speculative upper half, debt paydown lives in the lower half with tax benefits. This placement indicates its less-speculative, more-certain nature. Market crashes don’t affect your amortization schedule. Vacancy doesn’t stop principal reduction (though you’ll need to cover payments). The return is contractual, not conjectural.
- Left Side Position – Debt paydown joins appreciation on the “Cash Later” side of the quadrant. You can’t spend this return at the grocery store—it’s locked in your property as equity. Accessing it requires selling or refinancing, making it a long-term wealth builder rather than immediate income.
- Limited Return Ceiling – Here’s the crucial difference: while appreciation and cash flow are theoretically unlimited, debt paydown has a hard cap. Borrow $400,000, and your maximum lifetime debt paydown return is exactly $400,000. This limitation shapes how we think about leveraging this return.
Think of debt paydown as your financial defensive line. When markets tumble and cash flow dries up, debt paydown keeps working. Your tenants essentially buy the property for you, payment by payment, month by month. Over a 30-year mortgage, they’ll purchase the entire asset while you maintain ownership and all the benefits that come with it.
This “forced savings account” aspect makes debt paydown particularly powerful for investors who might otherwise struggle to save. You can’t skip it, can’t spend it impulsively, and can’t forget about it. It happens automatically, building substantial wealth for those patient enough to let time work its magic.
The Mathematics of Mortgage Amortization
Understanding amortization unlocks the true power of debt paydown. Most investors know their monthly payment, but few grasp how that payment splits between interest and principal—and how that split changes dramatically over time.
Amortization schedules front-load interest payments. On a typical 30-year mortgage at 7% interest, your first payment might include $2,333 in interest but only $367 toward principal. Fast forward to year 20, and that same payment sends $1,466 to principal with just $1,234 going to interest. The debt paydown accelerates exponentially.
Let’s examine how different loan terms affect your debt paydown returns:
- 30-Year Mortgages – The standard choice offers lower monthly payments but slower initial equity building. On a $400,000 loan at 7%, you’ll pay down just $5,015 in year one. By year 10, annual principal reduction hits $11,436. The acceleration continues until year 30 when you’re crushing nearly $35,000 in principal annually.
- 15-Year Mortgages – The aggressive investor’s choice front-loads equity building. That same $400,000 loan sees $19,759 in first-year principal reduction—nearly 4x the 30-year option. The trade-off? Monthly payments jump from $2,661 to $3,595, potentially crimping cash flow.
- Interest-Only Loans – The cash flow maximizer’s tool provides zero debt paydown. Your Return Quadrant™ shows a big fat zero in the debt paydown section. These make sense only in specific scenarios where cash flow or short-term appreciation strategies dominate.
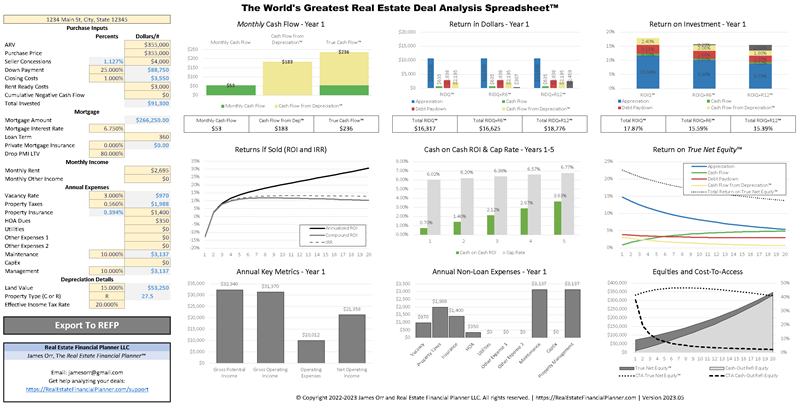
The World’s Greatest Real Estate Deal Analysis Spreadsheet™ transforms these abstract numbers into visual clarity. Input your loan terms, and instantly see amortization schedules, yearly principal reduction, and how debt paydown contributes to your total return. The spreadsheet calculates both Return on Investment Quadrant™ (ROI) and Return on Equity Quadrant™ (ROE), showing how debt paydown impacts each metric differently.
Here’s where it gets interesting: while your ROI from debt paydown remains constant (you invested $80,000, and debt paydown returns a fixed amount annually), your ROE from debt paydown actually decreases over time. Why? As your equity grows from both appreciation and debt paydown, the same dollar amount of principal reduction represents a smaller percentage return on your ever-growing equity stake.
This mathematical reality drives a crucial insight: properties with high leverage show impressive debt paydown returns on equity early in the holding period. As equity builds, those percentage returns diminish, potentially signaling when to refinance, sell, or adjust your strategy.
Strategies to Accelerate Debt Paydown
While standard amortization builds wealth steadily, strategic investors accelerate the process. But here’s the million-dollar question: should you? Let’s explore acceleration strategies and when they make sense.
- Extra Principal Payments – The simplest acceleration method involves adding extra principal to your regular payment. Even $200 monthly on a $400,000 loan saves $158,000 in interest and shortens your loan by 7.5 years. The key? Ensure your lender applies extra payments directly to principal, not future payments.
- Bi-Weekly Payment Strategies – Splitting your monthly payment in half and paying every two weeks creates 26 half-payments annually—equivalent to 13 full payments. This seemingly minor change shaves 5-7 years off a 30-year mortgage. Automated bi-weekly plans make this effortless.
- Shorter Loan Terms – Choosing a 15-year over 30-year mortgage represents the most aggressive acceleration. You’ll build equity faster and save hundreds of thousands in interest. The downside? Higher payments reduce cash flow and limit your ability to weather vacancies or market downturns.
- Strategic Refinancing – When rates drop significantly, refinancing to a lower rate while maintaining your original payment amount accelerates principal reduction. A 2% rate reduction might send an extra $400 monthly toward principal without increasing your out-of-pocket expense.
But wait—before you rush to pay off mortgages, consider the opportunity cost. That extra $200 monthly payment might generate better returns elsewhere:
- Buying Another Property – If that $200 helps you save for another down payment faster, you might multiply your returns across multiple properties rather than accelerating one loan.
- Cash Flow Reinvestment – Improving properties to increase rents often yields higher returns than extra mortgage payments.
- Reserve Building – Adequate reserves prevent forced sales during downturns, protecting all four return quadrants.
The World’s Greatest Real Estate Deal Analysis Spreadsheet™ includes opportunity cost calculators, comparing acceleration strategies against alternative investments. This data-driven approach replaces emotional decisions with mathematical clarity.
Debt Paydown vs. Other Investment Returns
Evaluating debt paydown requires context. How does this guaranteed return stack up against alternatives? The answer shapes your entire investment strategy.
Consider a 7% mortgage rate. Every dollar of principal reduction effectively earns 7% risk-free—you’re avoiding 7% interest charges. Compare this to alternative investments:
- Stock Market Returns – Historical averages suggest 10% annual returns, but with significant volatility. Your debt paydown “return” is guaranteed; market returns aren’t. Risk-adjusted, that 7% guaranteed return might outperform volatile market investments.
- Other Real Estate Investments – Could that extra payment money generate better returns in another property? If you’re seeing 15-20% cash-on-cash returns on new acquisitions, accelerating debt paydown looks less attractive.
- Cash Flow Reinvestment – Property improvements that boost rents $200 monthly create perpetual returns, often exceeding one-time debt reduction benefits.
The Return Quadrants™ framework illuminates how debt paydown complements speculative returns. When appreciation stalls and cash flow tightens, debt paydown keeps delivering. This diversification within a single asset provides stability that pure appreciation plays can’t match.
Smart investors balance all four quadrants rather than maximizing one. A property with moderate cash flow but strong debt paydown might outperform a high-cash-flow property with an interest-only loan when total returns are calculated. The Return Quadrants™ visualization makes these trade-offs crystal clear.
Remember: debt paydown returns are after-tax equivalents. You’re paying principal with after-tax dollars, but the “return” comes from interest saved—money you would have paid with after-tax dollars. This makes debt paydown more attractive than its nominal rate suggests, especially for high-income investors facing substantial tax burdens.
Advanced Debt Strategies
Sophisticated investors move beyond simple acceleration, employing advanced strategies that maximize wealth building across entire portfolios.
- Strategic Refinancing for Portfolio Growth – Instead of paying down one property aggressively, strategic refinancing extracts equity for additional purchases. This multiplies your debt paydown across multiple properties. A $400,000 property with $100,000 paid down might refinance to pull $80,000 for two more down payments, tripling your debt paydown potential.
- HELOC Optimization – Home Equity Lines of Credit provide flexible access to paid-down principal without traditional refinancing. Use HELOCs as temporary bridge financing for deals, then pay them off with permanent financing. This strategy maintains your favorable first mortgage while accessing equity efficiently.
- Portfolio Debt Architecture – With multiple properties, choosing between debt snowball (smallest balance first) and debt avalanche (highest rate first) impacts returns. The psychological wins from debt snowball might motivate continued investing, while debt avalanche maximizes mathematical returns.
- Tax Strategy Integration – Debt paydown doesn’t directly provide tax benefits, but it interacts with depreciation strategically. Properties with maxed-out depreciation benefits might warrant acceleration, while those with substantial depreciation might benefit from maintaining leverage.
The RIDQ+R™ (Return in Dollars + Reserves Quadrant™) framework adds sophistication by incorporating reserve requirements. That 7% “return” from debt paydown looks different when you’re maintaining 6-12 months of reserves earning 5% in money markets. Advanced investors calculate net returns after accounting for reserve drag.
Common Mistakes and Misconceptions
Even experienced investors stumble with debt paydown concepts. Avoiding these mistakes separates amateur hour from professional wealth building.
- Ignoring Debt Paydown in ROI Calculations – Focusing solely on cash flow and appreciation understates true returns by 20-30%. Include all four quadrants for accurate analysis.
- Over-Prioritizing Debt Paydown – Paying off 4% mortgages while passing up 15% cash-on-cash opportunities destroys wealth. Balance matters.
- Inflation Amnesia – Today’s $2,000 payment becomes easier over time as rents and incomes rise. Fixed-rate mortgages transfer inflation benefits from lenders to borrowers.
- Set-and-Forget Syndrome – Markets change, opportunities arise, and strategies need adjustment. Annual portfolio reviews should reassess debt paydown strategies.
Conclusion and Action Steps
Debt paydown might be real estate’s silent wealth builder, but its voice rings loud and clear in your net worth statement. While others chase appreciation headlines or cash flow dreams, you now understand how methodical principal reduction creates inevitable wealth. It’s not glamorous, but millionaires aren’t built on glamour—they’re built on mathematical certainty.
The Return Quadrants™ framework reveals debt paydown’s true role: the stable foundation supporting your entire investment strategy. When markets crash, tenants vanish, or tax laws change, debt paydown keeps grinding forward, building equity month after month, year after year.
Your next steps are clear:
- Download The World’s Greatest Real Estate Deal Analysis Spreadsheet™ – Start tracking debt paydown alongside your other returns. Visual clarity drives better decisions.
- Analyze Your Current Portfolio – Calculate actual debt paydown returns using the Return Quadrants™ framework. You might discover hidden wealth building you’ve been ignoring.
- Create Your Debt Strategy – Based on your goals, risk tolerance, and opportunity landscape, decide whether to accelerate, maintain, or leverage your debt paydown potential.
- Schedule Annual Reviews – Mark your calendar for yearly strategy assessments. As your portfolio grows and markets shift, your optimal approach evolves.
Remember: real estate wealth isn’t built on any single return quadrant—it’s built on understanding and optimizing all four. Debt paydown might work quietly, but its contribution speaks volumes. Let your tenants buy your properties while you sleep. That’s the power of understanding and maximizing debt paydown in your real estate investment journey.