When it comes to real estate investing, most investors obsess over percentages—cap rates, cash-on-cash returns, and IRRs dominate the conversation. But here’s the truth: you can’t pay your bills with percentages. You pay them with dollars. That’s why understanding the Return in Dollars Quadrant™ is crucial for making smarter investment decisions.
The Return in Dollars Quadrant™ is a revolutionary way to visualize and measure the actual dollar amount of returns from your real estate investments across four primary categories: Appreciation, Cash Flow, Cash Flow from Depreciation™, and Debt Paydown. Unlike traditional metrics that show percentages, this framework reveals the real money you’re making from each aspect of your investment.
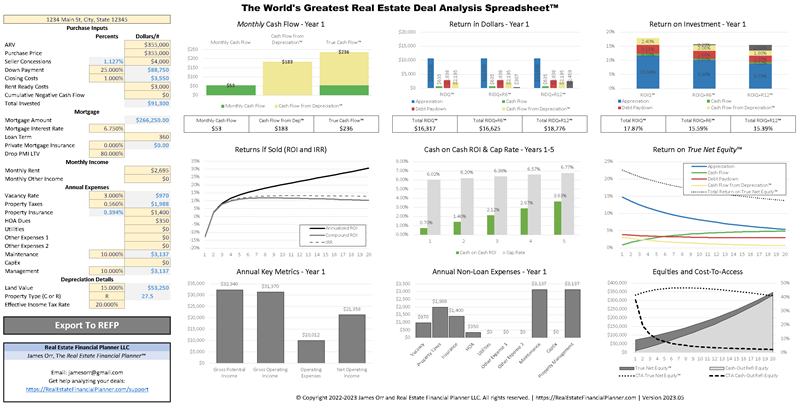
In this comprehensive guide, we’ll explore how to calculate, interpret, and maximize each quadrant of returns. You’ll learn why looking at all four return streams together gives you a complete picture of your investment’s performance and how The World’s Greatest Real Estate Deal Analysis Spreadsheet™ can automate these calculations for you. By the end, you’ll have a powerful new lens for evaluating real estate opportunities and optimizing your portfolio for maximum wealth building.
Understanding the Four Primary Returns
Real estate stands apart from other investments because it generates returns through multiple streams simultaneously. While stocks might offer dividends and appreciation, real estate provides four distinct ways to build wealth. Understanding each component is essential for maximizing your investment returns.

- Appreciation – This represents the increase in your property’s market value over time. While not realized until you sell or refinance, appreciation often constitutes the largest portion of long-term real estate returns. Market forces, location improvements, and property enhancements all contribute to appreciation. In strong markets, appreciation alone can create substantial wealth, though it shouldn’t be your only focus.
- Cash Flow – The monthly rental income remaining after all expenses represents your cash flow. This is the most visible return, hitting your bank account each month. Strong cash flow provides financial stability, helps weather market downturns, and can be reinvested to accelerate wealth building. Many investors prioritize cash flow, but it’s just one quarter of your total returns.
- Cash Flow from Depreciation™ – The IRS allows you to depreciate rental properties over 27.5 years, creating a paper loss that reduces your taxable income. This “phantom expense” puts real money in your pocket through tax savings. For investors in higher tax brackets, this quadrant can generate thousands of dollars annually without affecting your actual cash flow.
- Debt Paydown – Each mortgage payment increases your equity by reducing the principal balance. Your tenants essentially buy the property for you over time. This forced savings plan builds wealth automatically, regardless of market conditions. As your loan balance decreases, your net worth increases dollar for dollar.
The Return in Dollars Quadrant™ Visual Framework
The power of the Return in Dollars Quadrant™ lies in its visual simplicity. By arranging the four returns in a square grid, you instantly see how each component contributes to your total return. This visual framework transforms abstract percentages into concrete dollar amounts you can understand and compare.
The quadrant displays with Appreciation in the top left, Cash Flow in the top right, Cash Flow from Depreciation™ in the bottom left, and Debt Paydown in the bottom right. This arrangement isn’t arbitrary—it creates meaningful relationships between the quadrants. The top row represents more immediate returns (appreciation can be accessed through refinancing, cash flow arrives monthly), while the bottom row shows longer-term wealth building.
Consider a rental property generating $12,000 in appreciation, $4,800 in cash flow, $3,600 from depreciation tax benefits, and $3,000 in debt paydown annually. The quadrant would visually show these amounts in their respective positions, making it immediately clear that this property builds wealth primarily through appreciation while providing modest cash flow. This visual insight helps you understand whether this property aligns with your investment goals.
The quadrant format also facilitates easy comparison between properties. You can quickly identify which investments generate balanced returns versus those heavily weighted toward one quadrant. This visual comparison proves invaluable when deciding between investment opportunities or evaluating your portfolio’s overall performance.
Including Reserves in Your Analysis
Professional real estate investors know that reserves are non-negotiable. Yet most return calculations ignore this critical component, painting an unrealistic picture of investment performance. The Return in Dollars Quadrant™ offers a more sophisticated approach by incorporating reserves into your return analysis.
When you include reserves, you’re acknowledging the true cost of real estate ownership. Setting aside money for maintenance, repairs, and vacancies might feel like a drag on returns, but it’s essential for long-term success. The enhanced quadrant adds a fifth component showing the return earned on these reserve funds, typically through high-yield savings or money market accounts.
- Reserve Requirements – Most experts recommend reserves equal to 6-12 months of expenses per property. This money sits in accessible accounts, earning modest returns while providing crucial financial protection.
- Return on Reserves – While reserve funds earn lower returns than invested capital, they still generate income. A $10,000 reserve earning 4% annually adds $400 to your total returns—not massive, but not negligible either.
- True Return Picture – Including reserves in your quadrant analysis shows your actual returns after accounting for this necessary “insurance.” This more conservative approach helps you make realistic projections and avoid overestimating investment performance.
Calculating Your Return in Dollars Quadrant™
Calculating each component of the Return in Dollars Quadrant™ requires specific formulas and careful attention to detail. While The World’s Greatest Real Estate Deal Analysis Spreadsheet™ automates these calculations, understanding the underlying math helps you verify results and make informed decisions.
- Appreciation Calculation – Multiply your property’s current value by your expected annual appreciation rate. For a $300,000 property appreciating at 4%, that’s $12,000 annually. Remember, this is unrealized gain until you sell or refinance.
- Cash Flow Calculation – Sum your monthly net rental income (rent minus all expenses including mortgage payment) and multiply by 12. If you net $400 monthly, your annual cash flow equals $4,800. Be realistic about expenses—many investors underestimate costs and overstate cash flow.
- Cash Flow from Depreciation™ Calculation – Divide your property’s value (minus land value) by 27.5 years, then multiply by your marginal tax rate. A $250,000 building value generates $9,091 in annual depreciation. At a 30% tax rate, that saves you $2,727 in taxes annually.
- Debt Paydown Calculation – Review your loan amortization schedule to find the principal reduction over 12 months. This amount increases each year as more of your payment goes toward principal. A $240,000 loan at 6% might pay down $3,000 in principal the first year.
Let’s walk through a complete example. You purchase a $350,000 property with 20% down. Your loan amount is $280,000 at 6% interest. Monthly rent is $2,800, with total expenses (including mortgage) of $2,300, leaving $500 in monthly cash flow.
Your Return in Dollars Quadrant™ shows:
- Appreciation (3.5%): $12,250
- Cash Flow: $6,000
- Cash Flow from Depreciation™ (28% tax bracket): $2,764
- Debt Paydown (Year 1): $3,458
- Total Return in Dollars: $24,472
From Dollars to Percentages: ROI and ROE Quadrants
While the Return in Dollars Quadrant™ shows absolute returns, converting these to percentages reveals efficiency and enables comparison across different-sized investments. Two key percentage metrics emerge from the dollar quadrant: Return on Investment (ROI) and Return on Equity (ROE).
The Return on Investment Quadrant™ divides each dollar return by your initial investment. Using our example above with $70,000 down payment plus $10,000 in closing costs ($80,000 total investment), your ROI Quadrant shows:
- Appreciation ROI: 15.3%
- Cash Flow ROI: 7.5%
- Depreciation ROI: 3.5%
- Debt Paydown ROI: 4.3%
- Total ROI: 30.6%
The Return on Equity Quadrant™ becomes increasingly important over time as your equity grows. This metric divides returns by current equity rather than initial investment. As you pay down debt and the property appreciates, your equity increases while your cash flow might remain stable, causing ROE percentages to decline even as dollar returns increase. This natural progression helps you identify when to refinance or sell to redeploy equity more efficiently.
Using the Return in Dollars Quadrant™ Report
The Real Estate Financial Planner™ automatically generates comprehensive Return in Dollars Quadrant™ reports for each scenario you analyze. These reports transform raw calculations into actionable insights through professional charts and detailed tables.
The chart visualization uses a four-colored square with each quadrant’s dollar amount clearly displayed. The size of each quadrant can be proportionally scaled to represent its contribution to total returns, making it instantly clear which return streams dominate. This visual representation proves invaluable when presenting to partners, lenders, or simply understanding your own investments better.
The accompanying table provides year-by-year breakdowns of each return component. You’ll see how appreciation compounds, cash flow potentially increases with rent growth, depreciation remains steady (until year 27.5), and debt paydown accelerates over time. This temporal view reveals how your investment’s return profile evolves, helping you plan exit strategies or refinancing opportunities.
Access these reports directly from your scenario page after entering property assumptions. The system automatically updates calculations when you adjust inputs, allowing real-time analysis of different strategies. Export functions let you save reports for offline analysis or include them in investment packages.
Common Misconceptions About Real Estate Returns
Many real estate investors fall into mental traps that limit their success. Understanding these misconceptions helps you avoid costly mistakes and build wealth more effectively.
- “Cash Flow Is King” Fallacy – While positive cash flow is important, obsessing over it can lead you to pass up properties with superior total returns. A property with modest cash flow but strong appreciation and tax benefits often outperforms a high cash flow property in less desirable areas.
- Ignoring Depreciation Benefits – New investors frequently overlook depreciation’s value, seeing it as merely an accounting trick. In reality, the tax savings from depreciation can exceed your actual cash flow, especially for high-income investors.
- Appreciation Speculation – Conversely, banking entirely on appreciation without considering other returns is equally dangerous. Markets can stagnate or decline, leaving you with negative cash flow and no exit strategy. Balance across all quadrants provides stability.
Maximizing Each Quadrant
Strategic investors optimize each return stream through targeted techniques. Understanding how to enhance each quadrant helps you extract maximum value from every property.
- Boosting Appreciation – Force appreciation through strategic improvements, not just cosmetic updates. Add bedrooms, improve curb appeal, or upgrade to attract higher-quality tenants. Target properties in paths of progress where infrastructure improvements or demographic shifts drive values higher.
- Increasing Cash Flow – Implement annual rent increases aligned with market rates. Reduce expenses through preventive maintenance, energy efficiency upgrades, and careful vendor selection. Consider additional income streams like parking, storage, or laundry facilities.
- Maximizing Depreciation Benefits – Conduct cost segregation studies on larger properties to accelerate depreciation on components with shorter useful lives. Ensure you’re capturing all depreciable improvements. Work with tax professionals who understand real estate strategies.
- Accelerating Debt Paydown – While making extra principal payments directly increases this quadrant, carefully consider opportunity cost. That money might generate higher returns elsewhere. However, psychological benefits of faster debt reduction can be valuable for some investors.
Action Steps for Investors
Now that you understand the Return in Dollars Quadrant™, it’s time to apply this knowledge to your investment strategy. Start by analyzing your current properties using this framework—you might be surprised by what you discover.
First, calculate the Return in Dollars Quadrant™ for each property in your portfolio. Use The World’s Greatest Real Estate Deal Analysis Spreadsheet™ to automate calculations and generate professional reports. Compare results across properties to identify your strongest and weakest performers.
Next, use these insights to guide future acquisitions. When analyzing new opportunities, look beyond simple cash flow calculations. Consider how each property would contribute across all four quadrants. Set minimum thresholds for total dollar returns rather than focusing on single metrics.
Finally, develop a portfolio strategy that balances return types based on your life stage and goals. Younger investors might emphasize appreciation and debt paydown for long-term wealth building. Those near retirement might prioritize cash flow and depreciation benefits for current income and tax efficiency.
The Return in Dollars Quadrant™ transforms how you evaluate real estate investments by revealing the complete picture of your returns. By understanding and optimizing all four return streams—plus reserves when applicable—you’ll make more informed decisions and build wealth more effectively. Whether you’re analyzing your first rental property or managing a large portfolio, this framework provides the clarity needed to succeed in real estate investing.