Most real estate investors either completely ignore the Gross Rent Multiplier or use it so incorrectly that it costs them tens of thousands of dollars in overpaid properties and missed opportunities. This simple metric, when misunderstood, becomes a dangerous trap that lures investors into terrible deals or causes them to walk away from goldmines.
Imagine Sarah, a part-time investor who passed on a fourplex because the GRM seemed “too high” at 8.5. She’d read that anything above 8 was overpriced. Six months later, that property sold again—this time for $75,000 more. The neighborhood was rapidly appreciating, and comparable properties regularly traded at GRMs of 10 or higher. Sarah’s rigid understanding of GRM cost her a fortune.
Now consider another investor who made the opposite mistake. He bought a duplex solely because it had a “fantastic” GRM of 5.0, thinking he’d found the deal of the century. Only after closing did he discover why the GRM was so low: the property needed a new roof, had foundation issues, and suffered from years of deferred maintenance totaling $50,000.
These aren’t isolated incidents. They happen every day because investors treat GRM as either gospel or garbage, when the truth requires far more nuance. Understanding GRM properly transforms it from a dangerous oversimplification into a powerful screening tool that can save hours of analysis and prevent costly mistakes.
What Gross Rent Multiplier Actually Means
The Gross Rent Multiplier represents the relationship between a property’s purchase price and its annual gross rental income. The formula couldn’t be simpler:
GRM = Purchase Price ÷ Annual Gross Rental Income
A property selling for $240,000 that generates $2,000 monthly rent has a GRM of 10 ($240,000 ÷ $24,000 annual rent). But this simplicity masks important complexities that trip up even experienced investors.
The word “gross” is critical here. Unlike net-based metrics, GRM uses total rental income before any expense deductions. This means a property with $24,000 in annual rent has the same GRM numerator whether its expenses are $5,000 or $15,000 per year—a massive difference that GRM completely ignores.
The inverse relationship confuses many newcomers: lower GRMs generally indicate better cash flow potential, while higher GRMs suggest either overpricing or markets where appreciation matters more than immediate returns. A GRM of 5 means you’re paying 5 times the annual gross rent, while a GRM of 10 means paying 10 times—double the price relative to income.
How GRM Differs From Similar Metrics
Understanding GRM requires distinguishing it from other common real estate metrics:
- Cap Rate – Uses Net Operating Income (NOI) after expenses, providing a more complete return picture. While GRM ignores expenses entirely, cap rate factors in everything except mortgage payments.
- Cash-on-Cash Return – Measures actual cash returned on cash invested, including financing effects. A property with an attractive GRM might have terrible cash-on-cash returns with unfavorable financing.
- Price Per Unit – Common for multifamily properties but ignores income entirely. A $50,000-per-unit fourplex might be expensive or cheap depending on rental income.
- Price Per Square Foot – Focuses on physical property rather than income production. Useful for construction costs but nearly meaningless for investment analysis.
GRM’s Relationship to Other Key Metrics
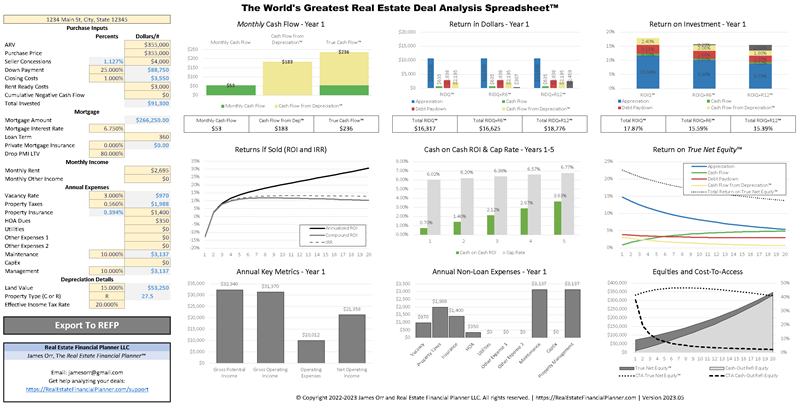
GRM connects directly to cap rates through the expense ratio. If you know a market’s typical expense ratios, you can estimate cap rates from GRM. For instance, with 40% expenses, a GRM of 10 roughly equals a 6% cap rate. This relationship appears in The World’s Greatest Real Estate Deal Analysis Spreadsheet™, which automatically shows how changing GRM assumptions affects projected returns.
However, GRM alone never tells the full story. Think of it as a first filter—like checking a car’s mileage before a test drive. Low mileage doesn’t guarantee a good car, but extremely high mileage warns you to look closer. Similarly, GRM provides a quick sanity check before diving into detailed analysis.
How to Calculate and Analyze GRM Accurately
Calculating GRM seems straightforward, but accuracy depends on using real numbers rather than wishful thinking. Here’s the systematic approach that prevents costly errors:
The Four-Step Calculation Process
- Step 1: Verify Actual Rents – Never use pro forma or “market rents” for existing properties. Sellers love to show what rents “could be” after improvements. Imagine David analyzing a triplex where the seller claimed $2,800 monthly income based on “market rents,” but actual lease agreements showed only $2,200. That $600 monthly difference equals a full point of GRM—the difference between a decent deal and overpaying by $72,000.
- Step 2: Annualize Properly – Account for vacancy patterns and seasonal fluctuations. A beach rental generating $3,000 monthly in summer but $1,000 in winter doesn’t produce $36,000 annually. Use actual twelve-month income history whenever possible.
- Step 3: Include All Income – Gross rent means all rental income: apartments, laundry facilities, parking spaces, storage units, and any other regular income streams. Missing $50 monthly from coin laundry might seem trivial, but over a year that’s $600—which at a 10 GRM affects value by $6,000.
- Step 4: Document Everything – Create an audit trail that lenders can follow. Screenshot rent rolls, save bank deposits, and organize lease agreements. This documentation proves your GRM calculation when seeking financing or selling later.
Reliable Data Sources for GRM Analysis
Getting accurate rental data requires knowing where to look and what to trust:
- Rent Rolls – The gold standard for existing properties, showing current tenants, lease terms, and payment history. Always match these against actual leases and bank deposits.
- Executed Leases – Legal documents showing agreed-upon rents. Check for concessions, move-in specials, or side agreements that might inflate apparent rents.
- Bank Deposits – When documentation seems questionable, ask for bank statements showing actual rent deposits. Sellers who balk at this request often have something to hide.
- Comparable Rentals – Only use market comparables for vacant units. Research current listings, not asking rents from six months ago. Remember that achieved rents typically fall 5-10% below asking prices.
Understanding Market-Specific GRM Ranges
GRM varies dramatically by property type and location. Typical ranges include:
- Single-family rentals: 8-12 (higher in appreciation markets)
- Duplexes and small multifamily: 6-10 (lower due to economies of scale)
- Larger apartments: 5-8 (more efficient operations)
Geographic variations matter enormously. Coastal California properties might trade at 15+ GRMs due to appreciation potential, while Midwest markets often see 6-8 GRMs reflecting cash flow focus. Neither is inherently “good” or “bad”—they reflect different investment strategies and market dynamics.
How GRM Impacts Property Valuations and Financing
Understanding GRM’s role in valuations and lending decisions can mean the difference between closed deals and rejected applications.
The Appraisal Connection
While appraisers primarily use comparable sales and income approaches for investment properties, they often check their conclusions against market GRMs. An appraisal showing values far outside typical GRM ranges raises red flags for lenders.
Imagine Marcus evaluating two duplexes in the same neighborhood. Both generate $2,000 monthly rent, but one lists at $200,000 (GRM 8.3) while another asks $260,000 (GRM 10.8). The GRM difference immediately highlights the need for deeper investigation. Perhaps the higher-GRM property has newer mechanicals, better tenants, or superior location—or maybe it’s simply overpriced.
Lending Implications
Different lender types use GRM differently:
- Portfolio Lenders – Local banks holding loans internally often establish maximum GRM thresholds. They might refuse properties above 10 GRM regardless of other factors, viewing them as too risky for their conservative portfolios.
- Commercial Lenders – Use GRM for initial screening before detailed underwriting. A property with GRM far above market norms might not receive full consideration even with strong fundamentals.
- Hard Money Lenders – May base maximum loan-to-value partially on GRM, offering lower LTVs for high-GRM properties they view as having less margin for error.
Investment Returns and Exit Strategy
Purchase GRM strongly influences eventual returns, but not always as expected. Low-GRM properties in declining areas might produce initial cash flow but suffer from appreciation losses and difficult exits. High-GRM properties in growing markets might break even monthly but deliver substantial appreciation.
Your exit strategy should align with purchase GRM. Buying at 12 GRM makes sense if comparable properties will likely trade at 14 GRM in five years. But buying at 6 GRM in a market trending toward 5 GRM requires exceptional cash flow to offset capital losses.
The Five Most Common and Costly GRM Mistakes
Even experienced investors fall into these GRM traps that can cost tens of thousands of dollars:
- Using Pro Forma Rents – The most dangerous mistake involves calculating GRM based on projected rather than actual income. Sellers love presenting “potential” rents after modest improvements. Always base GRM on current actual income, then separately analyze improvement potential.
- Ignoring Market Context – Comparing suburban to urban GRMs makes as much sense as comparing pickup trucks to sports cars. Each market has its own dynamics, expense ratios, and appreciation patterns that make cross-market GRM comparisons meaningless.
- Forgetting Expense Ratios – Low GRM means nothing if expenses consume most income. Properties with master-metered utilities, high insurance costs, or excessive maintenance needs can have attractive GRMs but terrible actual returns.
- Seasonal Miscalculation – Using peak season rents for annual calculations devastates returns. Student housing fully rented in September might sit empty all summer. Vacation rentals packed in July might generate nothing in November.
- Renovation Blindness – Not adjusting for deferred maintenance creates false bargains. That 5.5 GRM looks less attractive when you factor in the $40,000 needed for basic habitability.
A Cautionary Tale
Imagine Jennifer, excited about finding a triplex with a 5.5 GRM when similar properties traded at 8 GRM. The $165,000 purchase price for $30,000 annual rent seemed unbeatable. She calculated 12% cap rates and dreamed of cash flow riches.
Reality hit hard after closing. The roof leaked extensively ($15,000). Ancient galvanized plumbing required complete replacement ($12,000). Inadequate electrical service couldn’t support modern appliances ($8,000). Missing permits for bootlegged unit conversions meant expensive corrections ($5,000).
That “bargain” 5.5 GRM effectively became 8.8 GRM after $40,000 in necessary repairs—worse than simply buying a turnkey property at market rates. Proper inspection and analysis would have revealed these issues, but GRM blindness led to focusing on one attractive number while ignoring everything else.
Strategic Applications for Smarter Investing
Understanding GRM deeply enables strategic applications beyond basic property evaluation:
Portfolio Management Applications
- Acquisition Screening – Set market-appropriate GRM ceilings for initial property filtering. In 8-10 GRM markets, immediately discard 12+ GRM listings unless they offer exceptional value through other factors.
- Hold/Sell Analysis – Track GRM trends in your markets. When properties you bought at 7 GRM now trade at 10 GRM, consider whether continued appreciation likelihood justifies holding versus capturing gains.
- Refinance Triggers – Rising market GRMs often indicate increased property values perfect for refinancing. If you bought at 8 GRM and similar properties now trade at 11 GRM, you’ve likely gained substantial equity.
Market Analysis Techniques
Tracking neighborhood GRM trends reveals market shifts before they become obvious. Imagine noticing GRMs in an industrial area creeping from 6 to 7 to 8 over eighteen months. This compression often signals gentrification or economic improvement creating opportunity for early investors.
Conversely, GRM expansion might warn of overheating. When modest rentals start trading at 15+ GRMs based purely on appreciation speculation, smart investors often reduce exposure or shift to cash flow markets.
Integration with Comprehensive Analysis
GRM works best as one component of thorough analysis. The World’s Greatest Real Estate Deal Analysis Spreadsheet™ automatically calculates GRM alongside cap rates, cash-on-cash returns, and other crucial metrics. This integration prevents the tunnel vision that causes expensive mistakes.
Create personalized GRM targets based on your investment goals. Cash flow investors might set maximum GRMs of 8-10, while appreciation-focused investors could accept 12-15 GRMs in high-growth markets. The key is conscious decision-making rather than rigid rules.
Mastering GRM for Long-Term Success
Gross Rent Multiplier remains one of real estate’s most misunderstood metrics—simultaneously too simple and too complex for many investors to use effectively. The investors who succeed long-term understand that GRM provides valuable quick insights but never tells the complete story.
Never rely on GRM alone, but never ignore it either. Use it as intended: a rapid screening tool that identifies properties worth deeper analysis while flagging obvious problems. A surprisingly low GRM demands investigation into hidden issues, while an unusually high GRM requires justification through other value factors.
Start implementing these GRM insights immediately. Pull recent listings in your target market and calculate actual GRMs using verified rental income. Compare these to closed sales from recent months. Within hours, you’ll develop intuitive understanding of your market’s GRM patterns that guides future investment decisions.
Remember that building wealth through real estate requires informed analysis rather than simple rules of thumb. Master GRM as one tool among many, and you’ll avoid the costly mistakes that derail amateur investors while identifying opportunities others miss. The path to real estate success isn’t about finding magical formulas—it’s about understanding the numbers deeply enough to make confident, profitable decisions.