Most real estate investors are hemorrhaging thousands of dollars on every deal because they’re using price per square foot wrong—or worse, ignoring it entirely. This seemingly simple metric holds the power to transform mediocre portfolios into wealth-building machines, yet the majority of investors treat it like a throwaway number on listing sheets.
Imagine Sarah, a part-time investor who passed on a $180,000 triplex because its $125 per square foot seemed high compared to nearby single-family homes at $110 per square foot. Six months later, she watched another investor flip that same property for a $60,000 profit. What did Sarah miss? She failed to understand that price per square foot isn’t just a number—it’s a powerful lens that reveals hidden opportunities and exposes overpriced traps when used correctly.
This guide will transform how you analyze real estate deals. You’ll learn to wield price per square foot like a seasoned pro, spotting opportunities others miss and avoiding the costly mistakes that sink portfolios. Whether you’re evaluating your first duplex or your fiftieth fourplex, mastering this metric will fundamentally change how you see every deal.
What Price Per Square Foot Really Means
At its core, price per square foot represents the total purchase price divided by the gross living area (GLA). Simple math, complex implications. That $180,000 triplex with 1,440 square feet of living space? That’s $125 per square foot. But here’s where most investors stumble: they don’t understand what actually counts as living space.
Gross living area includes only finished, above-grade space that’s heated and cooled. That means:
- Basements Don’t Count – Even if finished, they’re below grade
- Garages Are Excluded – Not living space, regardless of size
- Attics Need Specific Requirements – Must have proper ceiling height and access
- Enclosed Porches Vary – Depends on heating/cooling and local standards
This distinction becomes critical when comparing properties. A 2,000 square foot house with a 600 square foot finished basement actually has only 1,400 square feet of GLA. Price that property at $210,000, and you’re looking at $150 per square foot—not the $105 per square foot an inexperienced investor might calculate.
How It Differs From Related Metrics
Price per square foot sits within a family of valuation metrics, each serving different purposes:
- Price Per Unit – Divides total price by number of rental units. Essential for multifamily properties where unit count drives income more than square footage. A fourplex at $400,000 equals $100,000 per unit.
- Price Per Bedroom – Common in student housing and room rental markets. Less reliable for general investing because bedroom counts can be manipulated.
- Cost Per Rentable Square Foot – Factors in only income-producing space. Crucial for mixed-use properties where retail and residential space have different values.
Understanding these distinctions prevents costly comparison errors. Using price per unit for single-family homes makes no sense, just as price per square foot can mislead when evaluating a portfolio of studio apartments versus three-bedroom units.
Relationship to Other Key Metrics
Price per square foot doesn’t exist in isolation—it connects directly to other critical investment metrics. Most importantly, it correlates with rent per square foot, creating what I call the “value spread.” Properties with below-market price per square foot but above-market rent per square foot potential represent the holy grail of real estate investing.
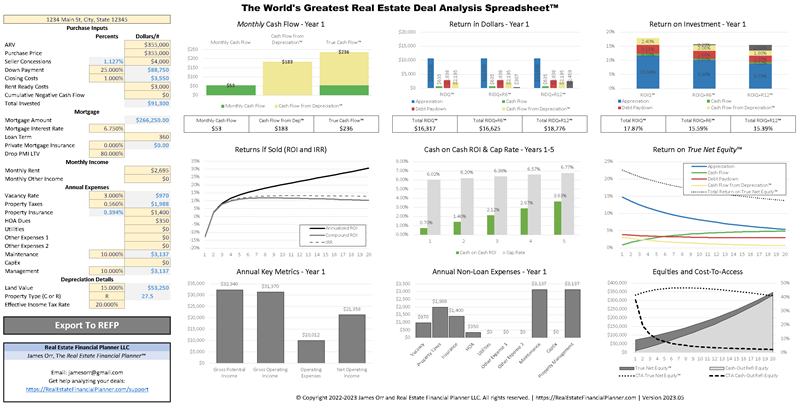
When integrated into The World’s Greatest Real Estate Deal Analysis Spreadsheet™, price per square foot becomes a screening filter that automatically flags properties deserving deeper analysis. It feeds directly into comparative market analysis (CMA), influences cash-on-cash return projections, and helps predict future appreciation potential. Smart investors use it as their first-pass filter before diving into detailed financial analysis.
Accurate Calculation Methodology
Calculating price per square foot seems straightforward until you realize that everyone measures differently. Here’s the professional approach that ensures accurate, consistent analysis:
Step 1: Verify Square Footage
Never trust listing data blindly. Real estate agents, sellers, and even tax records make mistakes. Verify square footage through:
- Recent Appraisals – Most accurate source, professionally measured
- Tax Records – Generally reliable but can be outdated
- Building Permits – Essential for identifying additions
- Professional Measurement – Worth the $200-300 cost for close deals
Imagine Marcus, who almost overpaid $30,000 for a duplex because the listing showed 2,200 square feet when tax records revealed only 1,850 square feet. That verification changed the price per square foot from an attractive $95 to an overpriced $113.
Step 2: Determine What Counts
Different property types have different rules:
- Single-Family Homes – Only above-grade living space
- Duplexes/Triplexes/Fourplexes – Combined living space of all units
- Mixed-Use Properties – Separate calculations for residential and commercial space
- Condos – Interior space only, no common areas
Step 3: Account for Functional Obsolescence
Raw square footage tells only part of the story. Adjustments are necessary for:
- Unusual Layouts – Shotgun houses, excessive hallways, or poor flow reduce effective value by 5-10%
- Outdated Systems – Properties needing major updates warrant 10-15% discounts
- Deferred Maintenance – Visible neglect justifies 10-20% reductions
- Superior Features – Updated kitchens, extra bathrooms, or premium finishes command 5-10% premiums
Essential Data Sources
Building reliable price per square foot analysis requires multiple data sources:
- County Tax Assessor – Free public records providing basic square footage and recent sales data. Usually accurate within 5% for standard properties.
- MLS Records – More detailed information including interior photos, detailed measurements, and agent notes. Requires agent relationship or access.
- Recent Appraisals – Gold standard for accuracy. Always request copies when available from sellers or banks.
- Building Permits – Critical for identifying unpermitted additions that could affect value and financing.
Analysis Framework
Creating meaningful price per square foot comparisons requires systematic analysis:
- Collect Comparable Sales – Gather 10-15 similar property sales within a 0.5-mile radius from the last six months
- Apply Time Adjustments – Add 0.5-1% per month for market appreciation in normal markets
- Adjust for Property Type – Use single-family as baseline, reduce 10-15% for duplexes, 15-20% for triplexes/fourplexes
- Factor Property Condition – Great condition commands 5-10% premium, poor condition warrants 10-20% discount
- Create Price Bands – Identify the range where 80% of adjusted comparables fall
This framework transforms raw data into actionable intelligence. Properties priced below the lower band represent potential opportunities; those above the upper band need exceptional features to justify their pricing.
Impact on Valuations and Financing
Price per square foot directly influences how lenders, appraisers, and insurers view your investment. Understanding these connections can mean the difference between smooth closings and deal-killing surprises.
Property Valuation Applications
Professional appraisers weight price per square foot heavily in their analysis, typically considering it alongside the sales comparison and income approaches. They use it to:
- Verify Reasonableness – Flagging properties priced significantly above neighborhood norms
- Make Adjustments – Adding or subtracting value based on square footage differences
- Support Conclusions – Using price per square foot brackets to justify final valuations
For investors, this creates predictable patterns. Properties priced within 10% of neighborhood price per square foot averages rarely face appraisal issues. Those priced 20% or more above average face significant appraisal risk unless they offer exceptional features or income potential.
Imagine Jennifer analyzing a 1,400 square foot duplex listed at $168,000 ($120 per square foot) in a neighborhood where renovated duplexes typically sell for $145 per square foot. The immediate $35,000 profit potential jumps off the page—but only if she knows to look for it.
Financing Implications
Lenders scrutinize price per square foot during underwriting:
- Loan-to-Value Calculations – Properties priced above neighborhood averages may require larger down payments
- Appraisal Risk – Lenders often order second appraisals for outlier properties
- Insurance Valuations – Replacement cost calculations use local construction costs per square foot, typically $100-150 for standard construction
Smart investors use this knowledge strategically. When buying below market price per square foot, they can often negotiate better loan terms by demonstrating the built-in equity. When selling, pricing within acceptable ranges ensures smooth buyer financing.
Investment Return Optimization
The relationship between price per square foot and rent per square foot creates a powerful evaluation tool. Properties with:
- Below-Average Price, Above-Average Rent – Immediate cash flow winners
- Above-Average Price, Above-Average Rent – Appreciation plays requiring careful analysis
- Below-Average Price, Below-Average Rent – Value-add opportunities
- Above-Average Price, Below-Average Rent – Usually poor investments unless exceptional appreciation is expected
Portfolio optimization involves balancing these categories. Conservative investors might focus on the first category, while those with renovation experience might target the third.
Common Mistakes That Cost Investors Money
Even experienced investors fall into these price per square foot traps:
The Five Deadly Sins of Price Per Square Foot Analysis
- Comparing Apples to Oranges – Single-family homes and multifamily properties have fundamentally different price per square foot ranges. A duplex at $120 per square foot might be a steal, while a single-family home at the same price could be overpriced.
- Ignoring Lot Value – A 1,200 square foot house on a half-acre lot commands different pricing than the same house on a standard 6,000 square foot lot. Always separate land and building value for accurate analysis.
- Forgetting Economies of Scale – Smaller properties naturally have higher price per square foot due to fixed costs. Kitchens and bathrooms cost nearly the same whether the house is 800 or 1,600 square feet.
- Overlooking Income Potential – A property with high price per square foot but exceptional rental income can outperform a “cheaper” property with poor income potential. Always evaluate both metrics together.
- Using Outdated Comparables – Markets change quickly. Comparables older than six months need significant adjustments, sometimes 10% or more in rapidly appreciating markets.
Real-World Mistake Example
Imagine Robert, who bought a 900 square foot house for $135,000 ($150 per square foot) thinking he got a deal because larger homes nearby sold for $165 per square foot. He failed to recognize that small homes always command premium pricing per square foot due to fixed costs and lot value.
The neighborhood’s pricing actually looked like this:
- 800-1,000 sq ft homes – $145-155 per square foot
- 1,200-1,500 sq ft homes – $125-135 per square foot
- 1,800-2,200 sq ft homes – $110-120 per square foot
Robert didn’t get a deal—he paid market price. Understanding these size-based pricing tiers would have saved him from this costly misconception.
Strategic Applications for Portfolio Growth
Mastering price per square foot analysis opens doors to advanced investment strategies that transform average returns into exceptional ones.
Advanced Investment Strategies
- Value-Add Identification – Properties with low price per square foot due to cosmetic issues offer the highest returns. Target properties priced 20-30% below neighborhood averages that need only paint, flooring, and landscaping.
- Market Timing Indicators – Track neighborhood price per square foot trends monthly. Rising trends signal seller’s markets ideal for exits; flat or declining trends indicate buyer’s markets perfect for acquisition.
- Negotiation Leverage – Document price per square foot disparities to justify offers. Showing sellers that their property is priced 15% above comparable sales provides concrete justification for lower offers.
- Portfolio Optimization – Maintain acquisition targets 15-20% below market price per square foot for buy-and-hold properties. This margin provides both cash flow cushion and appreciation potential.
Integration with Investment Systems
Professional investors integrate price per square foot analysis into their systems:
- Automated Screening – Set up MLS alerts for properties priced below specific price per square foot thresholds
- Database Development – Build neighborhood-specific price per square foot databases updated monthly
- Spreadsheet Integration – Incorporate into The World’s Greatest Real Estate Deal Analysis Spreadsheet™ as a primary screening metric
- Trend Tracking – Monitor quarterly changes to identify emerging opportunities or exit timing
Exit Strategy Enhancement
Price per square foot analysis dramatically improves exit planning:
- Appreciation Tracking – Properties in neighborhoods with 5%+ annual price per square foot growth offer superior long-term returns
- Renovation Planning – Understanding price per square foot ceilings prevents over-improvement
- Sale Timing – List properties when improvements push them 5-10% above neighborhood averages but before hitting resistance levels
- Portfolio Pruning – Sell properties in neighborhoods with stagnant price per square foot growth to reinvest in appreciating areas
Imagine Lisa, who tracked her fourplex neighborhood’s price per square foot rising from $85 to $105 over three years. When her renovations pushed her property to $115 per square foot—10% above the new average—she sold for maximum profit before hitting the pricing ceiling.
Mastering the Metric
Price per square foot is a powerful tool when used correctly but dangerous when misapplied. The investors who master this metric don’t just find better deals—they see the market through a completely different lens than their competition.
Your action items:
- Analyze Your Current Portfolio – Calculate the price per square foot for every property you own and compare to current market values
- Build Comparison Databases – Create spreadsheets tracking price per square foot for your target neighborhoods, updated monthly
- Integrate Into Deal Analysis – Never evaluate another property without calculating and comparing price per square foot metrics
Remember Sarah from our introduction? After learning these principles, she now quickly identifies opportunities others miss. That $125 per square foot triplex that seemed expensive? She would now recognize it as 15% below the $145 per square foot average for renovated multifamily properties in that neighborhood—a $30,000 opportunity hiding in plain sight.
The path to real estate wealth isn’t paved with complex financial engineering or insider secrets. It’s built on mastering fundamental metrics like price per square foot and applying them with discipline and intelligence. Start implementing these strategies today, and watch how differently you see every deal that crosses your desk.
Your competition is still guessing. You now have the knowledge to calculate, compare, and capitalize on price per square foot intelligence. The question isn’t whether you’ll find better deals—it’s how many you’ll find before others catch on.