What if your biggest tax deduction could generate immediate monthly cash flow? While most real estate investors chase appreciation and rental income, savvy investors understand that depreciation—often overlooked as just a “paper loss”—can put thousands of dollars in your pocket every single month.
Cash Flow from Depreciation™ represents one of the four fundamental returns in the Return Quadrants™ framework, and it’s arguably the most predictable and immediate cash-generating benefit of real estate investing. Unlike waiting for property values to rise or tenants to pay down your mortgage, depreciation delivers tangible financial benefits from day one.
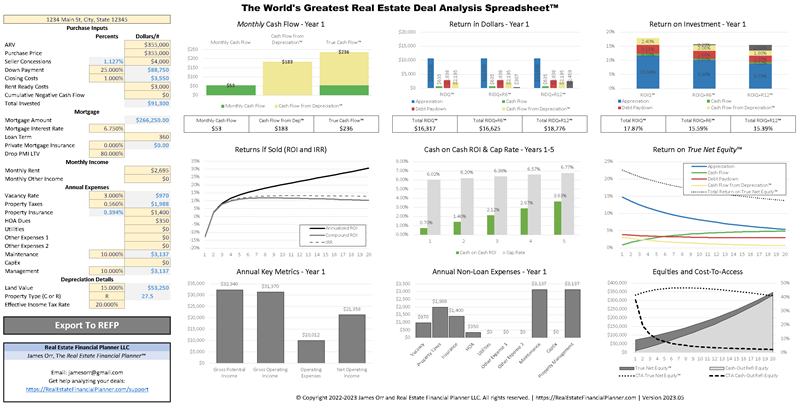
In this comprehensive guide, you’ll discover how to transform this powerful tax benefit into actual spendable cash flow. We’ll explore the mathematics behind depreciation, reveal advanced strategies to maximize your benefits, and show you exactly how to analyze these opportunities using The World’s Greatest Real Estate Deal Analysis Spreadsheet™.
Whether you’re evaluating your first rental property or optimizing a portfolio of investments, understanding Cash Flow from Depreciation™ is crucial for maximizing your real estate returns and achieving financial independence faster.
Understanding Depreciation Within the Return Quadrants™ Framework

To truly appreciate the power of depreciation, you must first understand how it fits within the complete picture of real estate returns. The Return Quadrants™ framework identifies four distinct areas where rental properties generate wealth:
- Appreciation – The tendency for property values to increase over time through market forces
- Cash Flow – Net rental income after all operating expenses and debt service
- Debt Paydown – Principal reduction on your mortgage, building equity with each payment
- Depreciation – Tax benefits that reduce your taxable income and create cash flow
What makes depreciation unique among these four quadrants? While appreciation and cash flow are speculative—subject to market conditions, tenant quality, and economic cycles—depreciation falls into what we call the “less-speculative, more-certain” category of returns. Along with debt paydown, depreciation provides predictable, contractual benefits that don’t fluctuate with market conditions.
Perhaps more importantly, depreciation sits firmly in the “Cash Now” side of the Return Quadrants™. Unlike appreciation and debt paydown, which lock up your returns as equity until you sell or refinance, depreciation generates immediate monthly cash flow through reduced tax obligations. This makes it particularly valuable for investors seeking financial independence or looking to replace their W-2 income.
The beauty of Cash Flow from Depreciation™ lies in its reliability. Once you purchase a property, your depreciation benefit is locked in for the next 27.5 years (for residential) or 39 years (for commercial). Market crashes won’t reduce it. Vacancy won’t eliminate it. As long as the tax code remains intact, this benefit flows to you year after year, providing a stable foundation for your investment returns.
The Mathematics of Cash Flow from Depreciation™
Understanding the math behind depreciation transforms abstract tax concepts into concrete cash flow projections. Let’s break down exactly how this works and why it matters for your bottom line.
First, it’s essential to distinguish between two key concepts:
- Gross Depreciation – The total amount you can deduct from your taxable income
- Cash Flow from Depreciation™ – The actual cash savings resulting from your tax deduction
Calculating Gross Depreciation starts with determining your depreciable basis. This includes the purchase price of the property minus the land value (land doesn’t depreciate), plus any closing costs and immediate improvements. For a typical residential rental property, you’ll divide this basis by 27.5 years.
For example, suppose you purchase a $400,000 property where the land is valued at $80,000. Your depreciable basis would be $320,000. Divided by 27.5 years, this gives you an annual Gross Depreciation of $11,636.
But here’s where it gets interesting. To convert Gross Depreciation into Cash Flow from Depreciation™, multiply by your marginal tax rate. If you’re in the 32% tax bracket, that $11,636 deduction saves you $3,723 in taxes annually—or $310 per month in additional cash flow.
The World’s Greatest Real Estate Deal Analysis Spreadsheet™ automates these calculations, but understanding the fundamentals helps you make better investment decisions. Consider how this impacts your deal analysis:
A property that breaks even on traditional cash flow (rent minus expenses equals zero) actually generates $310 monthly in Cash Flow from Depreciation™. Suddenly, that “break-even” deal looks much more attractive. This hidden cash flow can mean the difference between a good investment and a great one.
How Depreciation Creates Immediate Cash Flow
The magic of depreciation lies in its ability to create cash flow where none existed before. Unlike paper gains from appreciation or locked-up equity from debt paydown, Cash Flow from Depreciation™ puts money in your pocket every month.
Here’s how it works in practice. When you own rental property, the IRS allows you to adjust your W-2 withholdings to account for your expected depreciation deduction. Instead of waiting for a large tax refund, you can reduce your monthly tax withholding and increase your take-home pay immediately. This transforms an annual tax benefit into monthly cash flow.
Let’s compare depreciation to the other Return Quadrants™ to understand its unique advantages:
- Unlike Appreciation – You don’t wait years hoping for market values to rise. Depreciation delivers from day one, regardless of market conditions.
- Unlike Debt Paydown – While principal reduction builds wealth, it doesn’t help pay your bills today. Depreciation creates spendable cash immediately.
- Enhances Traditional Cash Flow – Depreciation can turn marginally profitable or even negative cash flow properties into solid investments.
Consider this real-world scenario: You purchase a rental property that generates $200 monthly in traditional cash flow. With $11,636 in annual depreciation and a 28% tax rate, you add $271 monthly in Cash Flow from Depreciation™. Your total monthly benefit jumps from $200 to $471—a 135% increase in cash flow!
The compounding effect across multiple properties becomes even more powerful. Five similar properties would generate $1,355 monthly in tax savings alone. This additional cash flow can fund your lifestyle, help you qualify for more loans, or accelerate your acquisition of additional properties.
For high-income earners, the benefits multiply. A couple earning $400,000 annually might face a 35% marginal tax rate. That same $11,636 depreciation now generates $339 monthly per property. With strategic planning, depreciation can offset much of your W-2 tax burden while building long-term wealth.
Advanced Depreciation Strategies
While straight-line depreciation over 27.5 years provides substantial benefits, advanced strategies can dramatically accelerate your tax savings and cash flow. These techniques, properly implemented in The World’s Greatest Real Estate Deal Analysis Spreadsheet™, can double or triple your first-year depreciation benefits.
- Cost Segregation Studies – This strategy involves hiring specialists to identify components of your property that qualify for shorter depreciation schedules. Instead of depreciating everything over 27.5 years, you might depreciate appliances over 5 years, carpeting over 7 years, and landscaping over 15 years.
- Bonus Depreciation – Recent tax law changes allow you to depreciate certain qualifying improvements 100% in the first year. While this provision phases out over time, it currently provides massive first-year deductions for strategic investors.
- Strategic Improvement Timing – By timing major renovations and improvements strategically, you can create depreciation “events” that boost your tax benefits in high-income years.
- Component Depreciation – Even without a formal cost segregation study, you can separately depreciate major components like HVAC systems, roofs, and appliances when you replace them.
These strategies significantly impact your Return Quadrants™ analysis. A cost segregation study might move 30% of your property’s basis into shorter depreciation periods. On a $400,000 property, this could generate an additional $20,000-30,000 in first-year depreciation, creating immediate Cash Flow from Depreciation™ of $6,000-10,000.
However, acceleration strategies require careful planning. Taking massive depreciation in year one means less depreciation in future years. The World’s Greatest Real Estate Deal Analysis Spreadsheet™ helps you model these scenarios to optimize your long-term cash flow and tax position.
Depreciation’s Role in Deal Analysis
When evaluating potential investments, incorporating Cash Flow from Depreciation™ into your analysis can completely change your perspective on deals. The Return Quadrants™ framework provides three key lenses for this analysis:
- Return in Dollars Quadrant™ (RIDQ™) – Shows the raw dollar benefit from depreciation alongside appreciation, cash flow, and debt paydown. This helps you understand the total return from each property.
- Return on Investment Quadrant™ (ROIQ™) – Calculates your depreciation benefit as a percentage of your initial investment. This reveals how efficiently your down payment generates tax savings.
- Return on Equity Quadrant™ (ROEQ™) – Measures depreciation returns against your current equity, helping you decide whether to hold, sell, or refinance properties.
The importance of depreciation becomes even clearer when you include reserves in your analysis (RIDQ+R™). While maintaining 6-12 months of expenses in reserves creates a drag on returns, Cash Flow from Depreciation™ helps offset this impact, making responsible investing more profitable.
Consider two seemingly identical properties:
Property A: $250,000 purchase price, $300 monthly traditional cash flow Property B: $350,000 purchase price, $300 monthly traditional cash flow
Without considering depreciation, Property A seems superior. But Property B generates an additional $2,424 annually in Cash Flow from Depreciation™ (assuming 28% tax rate). This extra $202 monthly nearly equalizes the total returns while providing better appreciation potential.
The World’s Greatest Real Estate Deal Analysis Spreadsheet™ automatically calculates these nuanced comparisons, ensuring you never overlook the depreciation advantage in your investment decisions.
Common Depreciation Mistakes and Misconceptions
Even experienced investors make critical errors with depreciation that cost thousands in lost cash flow. Understanding these pitfalls helps you maximize your returns:
- Not Claiming Depreciation – Some investors skip depreciation to avoid recapture tax later. This is a costly mistake—the IRS assumes you took depreciation whether you claimed it or not. You’ll pay recapture tax regardless, so always claim your deduction.
- Ignoring Depreciation in Deal Analysis – Analyzing properties based solely on traditional cash flow misses 20-40% of your total return. Always include Cash Flow from Depreciation™ in your investment calculations.
- Miscalculating Depreciable Basis – Forgetting to include closing costs, initial repairs, or improperly allocating land value reduces your depreciation benefit. Every $10,000 in missed basis costs you $364 annually (at 27.5 years).
- Poor Documentation Practices – Without proper records, you can’t defend your depreciation claims or accurately calculate recapture upon sale. Maintain detailed documentation from day one.
- Misunderstanding Recapture Implications – While depreciation recapture is real, it’s taxed at a maximum of 25%—often less than your current marginal rate. Plus, strategies like 1031 exchanges can defer recapture indefinitely.
Action Steps and Implementation
Knowledge without action generates no cash flow. Here’s your roadmap to implementing Cash Flow from Depreciation™ in your investment strategy:
- Download The World’s Greatest Real Estate Deal Analysis Spreadsheet™ to accurately model depreciation benefits for every potential investment.
- Calculate Cash Flow from Depreciation™ for your current properties. You might discover thousands in annual benefits you’re not optimizing.
- Review your complete Return Quadrants™ for each property. Identify which quadrants drive your returns and optimize accordingly.
- Adjust your W-2 withholdings to receive depreciation benefits monthly rather than waiting for an annual refund.
- Consult with tax professionals about advanced strategies like cost segregation, especially for properties over $300,000.
- Re-evaluate previously rejected deals incorporating Cash Flow from Depreciation™. Properties you passed on might actually be profitable investments.
Remember, depreciation represents guaranteed cash flow for 27.5 years on every residential rental property. While others chase speculative returns, you can build wealth on the foundation of predictable, immediate tax benefits. Master Cash Flow from Depreciation™, and you’ll discover why experienced investors often value this “boring” tax benefit above flashier returns.
The path to financial independence through real estate isn’t just about finding great deals—it’s about understanding and optimizing all four Return Quadrants™. Depreciation might be the most overlooked, but for smart investors, it’s often the most valuable. Start calculating your Cash Flow from Depreciation™ today, and watch your monthly cash flow soar.