Most real estate investors can tell you their monthly mortgage payment down to the penny, yet they couldn’t explain how much of that payment actually builds equity versus disappears as interest—a blind spot that costs them thousands in missed opportunities and poor refinancing decisions.
Imagine Sarah, who owned three rental properties but never looked beyond her monthly payment amount. When rates dropped in 2021, she missed the optimal refinancing window because she didn’t understand how far into her amortization schedule she was. By the time she figured it out, rates had risen again, costing her $42,000 in unnecessary interest over the remaining life of her loans.
This knowledge gap separates sophisticated real estate investors from those who merely collect rent. Understanding amortization schedules isn’t just about knowing where your money goes each month—it’s about leveraging that knowledge to accelerate wealth building, optimize refinancing decisions, and maximize returns on every property in your portfolio.
In this comprehensive guide, you’ll learn how to read, analyze, and leverage amortization schedules to make better investment decisions, avoid costly mistakes, and build wealth faster through strategic debt management.
What Is an Amortization Schedule?
An amortization schedule is the complete breakdown of every payment over the life of your loan, showing exactly how each dollar gets allocated. Think of it as the GPS for your mortgage—it shows you where you are, where you’re going, and exactly how you’ll get there.
Every payment in your amortization schedule consists of four potential components:
- Principal – The amount that actually reduces your loan balance and builds equity
- Interest – The cost of borrowing money, fully deductible for investment properties
- Escrow/Impounds – Property taxes and insurance, if your lender collects these
- PMI – Private mortgage insurance for loans exceeding 80% loan-to-value
The critical insight most investors miss? The ratio between principal and interest changes dramatically over time. In the early years, you’re essentially renting money from the bank. By the end, you’re rapidly building equity with each payment.
How Amortization Differs from Related Terms
Understanding amortization requires distinguishing it from similar-sounding concepts:
- Amortization vs. Depreciation – Amortization reduces your debt and builds real equity. Depreciation is an accounting concept that reduces taxable income but doesn’t affect your loan balance.
- Amortization vs. Payment Schedule – A payment schedule simply tells you when to pay and how much. An amortization schedule reveals what happens to each dollar within that payment.
- Fully Amortizing vs. Interest-Only Loans – Fully amortizing loans pay off completely over the term. Interest-only loans require a balloon payment or refinance at the end, with no principal reduction during the interest-only period.
Connection to Your Overall Investment Analysis
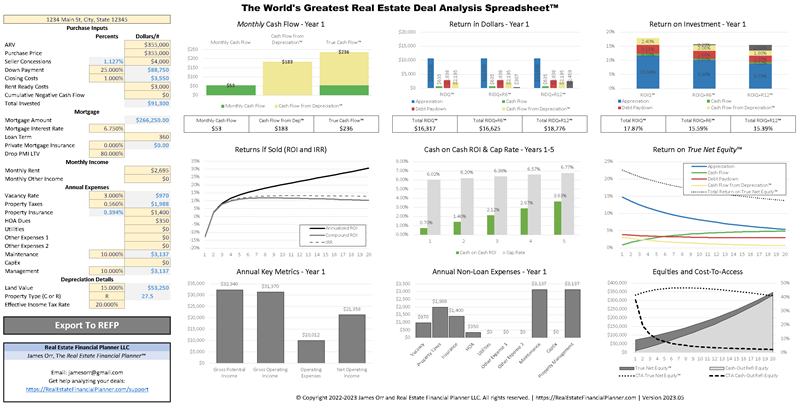
Amortization schedules directly impact three critical metrics in The World’s Greatest Real Estate Deal Analysis Spreadsheet™:
- Cash-on-Cash Return – Your monthly payment (pulled from the amortization schedule) determines your cash flow and therefore your cash-on-cash return
- Total ROI Calculations – Principal paydown is a real return, even though it doesn’t hit your bank account monthly
- Debt Service Coverage Ratio (DSCR) – Lenders use your total payment from the amortization schedule to calculate whether the property qualifies for financing
How to Calculate and Analyze Amortization Schedules
While the mathematical formula for amortization involves complex exponential calculations, understanding the concept matters more than memorizing formulas. Here’s what drives your amortization schedule:
- Loan Amount – Your initial principal balance
- Interest Rate – The annual percentage rate (APR)
- Loan Term – Total number of months for repayment
- Payment Frequency – Monthly, bi-weekly, or other intervals
Step-by-Step Calculation Example
Imagine Marcus purchasing a $275,000 duplex with a 20% down payment. His loan details:
- Loan amount: $220,000
- Interest rate: 6.5%
- Term: 30 years (360 months)
For his first monthly payment:
- Monthly interest rate: 6.5% ÷ 12 = 0.5417%
- First month’s interest: $220,000 × 0.005417 = $1,191.67
- Total monthly payment: $1,389.85 (calculated using amortization formula)
- First month’s principal: $1,389.85 – $1,191.67 = $198.18
- New loan balance: $220,000 – $198.18 = $219,801.82
Notice how little principal Marcus pays in month one—just 14% of his payment builds equity. This ratio improves every month as the loan balance decreases.
Tools and Resources for Creating Amortization Schedules
- Online Calculators – Quick results but limited customization options
- Excel/Google Sheets – Build your own using PMT, IPMT, and PPMT functions for maximum flexibility
- Specialized Real Estate Software – Often integrates with property management systems
- Lender-Provided Schedules – Always verify these for accuracy, especially after loan modifications
Reading Your Amortization Schedule
Focus on these critical milestones:
- The Crossover Point – When principal finally exceeds interest in your payment (typically years 8-12 on a 30-year loan)
- Equity Milestones – When you reach 20%, 50%, and 80% equity positions
- Total Interest Paid – Track both annual and cumulative interest for tax planning
- Remaining Balance Checkpoints – Essential for refinancing decisions
Impact on Property Valuations and Financing
Your amortization schedule directly affects your wealth in three ways:
Effect on Property Valuations
While amortization doesn’t change your property’s market value, it dramatically impacts your equity position:
- Net Equity Position – Market value minus remaining loan balance equals your true ownership stake
- Cash-Out Refinance Potential – Your paid-down principal determines available equity to tap
- Sale Proceeds – The amortization schedule shows exactly what you’ll net after paying off the loan
Financing Implications
Understanding amortization schedules helps you navigate complex financing decisions:
- Loan Qualification – Existing loan payments from your amortization schedules affect your debt-to-income ratio
- Portfolio Lending – Commercial lenders examine aggregate loan balances across all properties
- Refinancing Timing – Identifying optimal points in your amortization curve for refinancing
Imagine Jennifer with a 5-year-old mortgage at 7%. Her amortization schedule reveals she’s paid down $31,000 in principal—enough equity to eliminate PMI on a refinance, saving her $150 monthly. Without checking her schedule, she might have assumed she needed to wait several more years.
Investment Return Calculations
Amortization affects multiple return components:
- Monthly Cash Flow – Your payment amount directly impacts net operating income
- Principal Paydown Return – Often overlooked but represents real wealth accumulation
- Tax Benefits – Interest deductions decrease annually as principal portions increase
Common Mistakes Investors Make
Even experienced investors fall into these amortization traps:
- Ignoring Principal Paydown in ROI – Treating equity buildup as a “phantom” return when it’s real wealth creation. A property with break-even cash flow but $500 monthly principal paydown generates a 15% return on a $40,000 down payment.
- Focusing Only on Payment Amount – Missing how the principal/interest ratio shifts over time. Two identical $1,500 payments might build vastly different equity depending on where you are in the amortization schedule.
- Misunderstanding Prepayment Impact – Not calculating how extra payments accelerate the schedule. One extra payment annually typically cuts 5-7 years off a 30-year mortgage, not the 2-3 years many assume.
- Comparing Different Loan Terms Incorrectly – Evaluating 15-year versus 30-year mortgages based solely on payment differences, ignoring the dramatic difference in equity buildup speed.
- Forgetting About Amortization in Exit Planning – Selling after 5 years versus 7 years might mean $20,000 more in proceeds due to principal paydown alone.
Imagine David who prepaid $100 monthly on his mortgage thinking it would cut his loan term in half. Without checking his amortization schedule, he didn’t realize those payments only reduced his term by 7 years. Still valuable, but proper analysis would have helped him set realistic expectations and possibly allocate that $100 differently.
Strategic Applications for Real Estate Investors
Understanding amortization schedules transforms from academic knowledge to practical wealth-building when applied strategically:
Portfolio Management Strategies
- Equity Harvesting – Time cash-out refinances when you’ve built substantial equity but before the principal paydown acceleration phase. The sweet spot often falls between years 5-10 of a 30-year mortgage.
- Debt Snowball Optimization – Use amortization schedules to identify which property to pay off first. The property with the highest interest rate isn’t always the optimal target—consider remaining balance and time left.
- Interest Expense Management – Front-load property purchases early in the tax year to maximize interest deductions, especially valuable for high-income investors.
Advanced Techniques
- Bi-Weekly Payment Strategy – Making half your monthly payment every two weeks results in 13 full payments annually, shaving 5-7 years off your loan. Your amortization schedule shows the exact impact.
- Recast vs. Refinance Analysis – A recast maintains your interest rate but re-amortizes based on a lower balance. Compare this against refinancing costs using both amortization schedules.
- Commercial Loan Balloon Planning – For 5-year commercial loans with 25-year amortization, your schedule reveals the exact balloon payment due, helping you plan the refinance or sale.
Exit Strategy Optimization
Amortization schedules reveal optimal exit timing:
- Optimal Hold Periods – Graph your equity buildup rate. When it flattens (typically years 15-20), consider selling and redeploying capital into properties with steeper equity curves.
- 1031 Exchange Timing – Calculate proceeds at different sale dates. An extra year might mean $30,000 more equity to roll into your next property.
- Portfolio Rebalancing – Identify which properties have built substantial equity for cash-out refinancing versus which to sell outright.
Integration with Investment Analysis
Incorporate amortization data into The World’s Greatest Real Estate Deal Analysis Spreadsheet™:
- Import monthly principal and interest amounts for accurate cash flow projections
- Calculate true total returns including principal paydown
- Run scenarios comparing different loan terms and prepayment strategies
- Model the impact of refinancing at various points in the amortization schedule
Putting It All Together
The transformation from “payment blind” to “amortization aware” marks a fundamental shift in how you approach real estate investing. While other investors see only monthly payments, you now see the complete financial trajectory of every property—turning a simple mortgage into a strategic wealth-building tool.
This knowledge provides a competitive advantage in multiple ways:
- Better property analysis during acquisition
- Optimized refinancing decisions that save thousands
- Strategic prepayment plans that align with your goals
- Exit timing that maximizes proceeds
Your action items:
- Download the amortization schedule for each property you own today
- Identify where each property sits on its equity-building curve
- Calculate how different prepayment strategies would affect your portfolios
- Run amortization scenarios on your next potential acquisition
Remember Sarah from our opening? After learning these concepts, she analyzed her portfolio’s amortization schedules and discovered one property was just two years from the principal/interest crossover point. She strategically refinanced her other properties but kept this one untouched, saving thousands in unnecessary closing costs while maximizing her equity buildup.
While your competition focuses solely on cash flow, you’re now equipped to see the complete picture—monthly cash flow, principal paydown, tax benefits, and optimal exit timing. That comprehensive view transforms mortgages from necessary evils into powerful tools for building lasting wealth through real estate.