Most real estate investors are leaving thousands of dollars on the table by misunderstanding one of the most powerful valuation metrics in their toolkit: price per bedroom. While everyone obsesses over price per sq ft and cap rates, savvy investors quietly use this overlooked metric to identify deals others miss and avoid properties that look cheap but will drain their returns.
Imagine Sarah, a part-time investor who recently passed on a “overpriced” 4-bedroom ranch listed at $220,000 because she was fixated on finding something under $200,000. Instead, she jumped on a 2-bedroom bungalow for $165,000, thinking she’d scored a deal. Six months later, she discovered the 4-bedroom property she passed on was renting for $2,100 monthly while her “bargain” 2-bedroom barely commanded $1,200. The difference? She never calculated price per bedroom—the 4-bedroom was actually $55,000 per bedroom while her 2-bedroom cost her $82,500 per bedroom.
This guide will transform how you analyze rental properties by revealing why price per bedroom often trumps price per sq ft for building wealth through rentals. You’ll discover how to calculate it accurately, avoid costly mistakes, and use it strategically to build a more profitable portfolio.
What Price Per Bedroom Really Means
Price per bedroom is deceptively simple: take the total purchase price and divide by the number of legal bedrooms. A $240,000 house with 4 bedrooms equals $60,000 per bedroom. But this simplicity masks its power as a valuation tool that directly correlates with rental income potential.
The critical word here is “legal.” A bedroom must meet specific requirements—typically including a closet, window, minimum square footage, and proper egress. That finished basement room might feel like a bedroom, but without proper permits and egress windows, it doesn’t count. Smart investors verify bedroom count through building permits and tax records, not just MLS listings or seller claims.
Why do bedrooms matter more than bathrooms or total square footage for rental properties? Because bedrooms determine your tenant pool and rental income more than any other physical characteristic. A 3-bedroom, 1-bathroom house will typically rent for significantly more than a 2-bedroom, 2-bathroom house of the same size. Tenants—whether families, roommates, or professionals—shop primarily by bedroom count.
How It Differs From Similar Metrics
- Price Per Square Foot – This metric works well for flippers targeting retail buyers who care about overall space, but it poorly predicts rental income. A 1,500 square foot 2-bedroom might have the same price per square foot as a 1,500 square foot 4-bedroom, but the 4-bedroom will generate substantially more rent.
- Price Per Unit – Multifamily investors use this metric, but it ignores crucial bedroom count variations. A building with four 1-bedroom units has very different income potential than one with four 3-bedroom units, even at the same price per unit.
- Gross Rent Multiplier – While GRM focuses on income relative to price, price per bedroom helps you understand WHY a property generates its current income and whether there’s room for improvement.
Relationship to Other Key Metrics
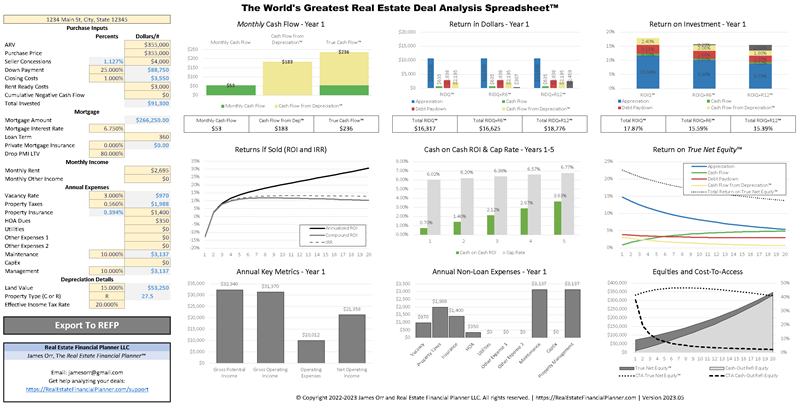
Price per bedroom forms the foundation for several crucial calculations in The World’s Greatest Real Estate Deal Analysis Spreadsheet™. It directly influences:
- Rent per bedroom ratios (monthly rent ÷ bedroom count)
- Cash-on-cash returns (more bedrooms typically = more rent = better returns)
- Tenant pool depth (3-4 bedroom properties attract the largest tenant pools)
- Market positioning (comparing your price per bedroom to area averages)
The metric becomes even more powerful when you understand that bedroom count drives both rental demand and tenant stability. Families needing 3+ bedrooms tend to stay longer than singles or couples in 1-2 bedroom units, reducing turnover costs and vacancy rates.
Calculation and Analysis Section
Step-by-Step Calculation Process
Calculating price per bedroom requires precision and attention to detail:
- Verify Legal Bedroom Count
- Pull building permits from city/county websites
- Cross-reference with tax assessor records
- Compare to MLS listings for discrepancies
- Inspect properties to confirm bedroom legality
- Determine All-In Purchase Price
- Base purchase price
- Closing costs (typically 2-3% for investors)
- Immediate repairs needed for rental readiness
- Any transfer taxes or fees
- Calculate Base and Adjusted Metrics
- Base: Total price ÷ Legal bedroom count
- Adjusted: Include renovation costs if adding bedrooms
- Portfolio: Weight by rental income when averaging
Data Sources for Accurate Analysis
- MLS Data – Search for sold comparables with identical bedroom counts. Watch for listing errors where agents miscount bedrooms or include non-conforming spaces. Export data to spreadsheets for detailed analysis.
- County Records – Most assessor websites show bedroom counts from their last inspection. These tend to be conservative but accurate for legal bedrooms. Building permit databases reveal bedroom additions or conversions.
- Rental Listings – Scan Zillow, Apartments.com, and Craigslist for current rental rates by bedroom count. Build a database showing typical rent premiums for each additional bedroom in your target neighborhoods.
- Property Management Data – Local property managers often share general rental ranges by bedroom count. Their data reflects actual achieved rents, not optimistic listing prices.
Advanced Analysis Techniques
Beyond basic calculations, sophisticated investors adjust for:
- Bedroom Size Variations: A property with one master suite and three tiny bedrooms might warrant a 10-15% discount versus four equally-sized bedrooms
- Configuration Quality: Single-level bedroom layouts command premiums over split-level or scattered configurations
- Bathroom Ratios: Properties with favorable bedroom-to-bathroom ratios (2:1 or better) justify higher price per bedroom metrics
Example Calculation
Imagine Marcus analyzing a triplex listed at $300,000:
- Unit 1: 2 bedrooms renting for $1,100
- Unit 2: 1 bedroom renting for $750
- Unit 3: 3 bedrooms renting for $1,400
- Total: 6 bedrooms generating $3,250 monthly
Base calculation: $300,000 ÷ 6 bedrooms = $50,000 per bedroom
Now Marcus compares this to his market research:
- Single-family homes: averaging $65,000 per bedroom
- Duplexes: averaging $58,000 per bedroom
- Triplexes/fourplexes: averaging $52,000 per bedroom
The subject property’s $50,000 per bedroom falls below the small multifamily average, suggesting potential value. Marcus digs deeper, discovering similar 6-bedroom triplexes traded between $48,000-$54,000 per bedroom recently, confirming this property offers slight value.
Impact on Valuations and Financing
Property Valuation Effects
- Appraisal Considerations – Residential appraisers prioritize bedroom count when selecting comparables. They’ll typically adjust $5,000-$15,000 per bedroom difference between subject and comparables, depending on market conditions. Understanding these adjustments helps predict appraised values.
- Market Positioning – Properties with 3-4 bedrooms consistently achieve the lowest price per bedroom in most markets because they appeal to the broadest buyer and tenant pools. Two-bedroom properties often carry 10-20% premiums per bedroom, while 5+ bedroom homes may trade at discounts due to limited demand.
- Value-Add Opportunities – Converting dens, offices, or bonus rooms to legal bedrooms can dramatically improve property values. Adding a conforming bedroom to a 2-bedroom house might cost $15,000 but increase value by $25,000 or more, while boosting monthly rent by $200-300.
Financing Implications
Bedroom count significantly impacts financing options:
- Conventional Loans: Lenders prefer standard bedroom counts (2-4 for single-family). Unusual configurations like 1-bedroom houses or 6+ bedrooms may require portfolio lenders
- FHA Requirements: Minimum property standards include bedroom requirements. FHA also limits loan amounts partly based on bedroom count in their area median price calculations
- DSCR Calculations: More bedrooms typically mean higher rents, improving debt service coverage ratios for investment property loans
Investment Return Correlation
Statistical analysis across multiple markets reveals:
- Properties purchased below $55,000 per bedroom typically achieve 10%+ cash-on-cash returns
- Each $10,000 increase in price per bedroom correlates with roughly 1% decrease in cap rates
- Portfolio diversification across bedroom counts (mix of 2, 3, and 4-bedroom properties) reduces vacancy risk by 30-40%
The sweet spot for most mom-and-pop investors sits between $45,000-$65,000 per bedroom, depending on local market conditions. Properties below this range might indicate deferred maintenance or location issues, while those above often struggle to generate acceptable returns.
Common Mistakes Investors Make
- Counting Non-Conforming Spaces – The most expensive mistake involves counting illegal bedrooms. That basement “bedroom” without egress windows, the converted garage lacking proper permits, or the den without a closet don’t count. Investors who include these spaces overpay relative to actual rental potential and face code violation risks.
- Ignoring Market Preferences – Some investors chase high bedroom counts without researching demand. Buying a 5-bedroom house in a neighborhood of young professionals wanting 2-3 bedrooms leads to extended vacancies or accepting below-market rents from less-qualified tenants.
- Overlooking Configuration Issues – Properties with bedrooms accessed through other bedrooms, lacking closets, or with windows facing noisy streets rent for less despite technically meeting bedroom requirements. Always evaluate bedroom quality, not just quantity.
- Comparing Across Property Types – Using single-family price per bedroom benchmarks for multifamily analysis creates apples-to-oranges comparisons. Each property type has distinct price per bedroom ranges based on typical buyer profiles and financing options.
- Focusing Solely on the Metric – Some investors become so fixated on price per bedroom they ignore location quality, property condition, or neighborhood trends. A great price per bedroom in a declining area still makes a poor investment.
Strategic Applications
Portfolio Construction Strategy
Building a resilient rental portfolio requires strategic thinking about bedroom mix:
Start with higher bedroom count properties (3-4 bedrooms) because they typically offer:
- Lowest price per bedroom metrics
- Broadest tenant appeal
- Better cash flow per dollar invested
- Easier exit strategies to owner-occupants
As you scale, diversify across bedroom counts to capture different tenant segments while maintaining focus on price per bedroom value. A balanced portfolio might include 20% 2-bedrooms, 60% 3-bedrooms, and 20% 4+ bedrooms.
Market Analysis Applications
- Identifying Undervalued Properties – Screen MLS listings by calculating price per bedroom for all active properties. Sort lowest to highest and investigate outliers. Properties priced 20%+ below area averages often hide value-add opportunities or reflect motivated sellers.
- Timing Market Cycles – Track quarterly changes in median price per bedroom as an early indicator of market shifts. This metric often leads broader price movements by 3-6 months because bedroom count directly impacts affordability.
- Geographic Arbitrage – Compare price per bedroom across adjacent neighborhoods or suburbs. Finding areas with similar rents but lower price per bedroom metrics reveals geographic arbitrage opportunities.
Exit Strategy Optimization
Understanding price per bedroom enhances exit planning:
- Owner-Occupant Sales: Market properties with favorable price per bedroom to families comparing monthly payments across different bedroom counts
- Investor Sales: Highlight below-market price per bedroom combined with strong rent-to-bedroom ratios
- Strategic Renovations: Add bedrooms when price per bedroom premiums justify renovation costs
Case Study Example
Imagine Jennifer discovering a dated 4-bedroom ranch listed at $160,000 in a neighborhood where similar properties sell for $220,000. The $40,000 per bedroom price stands well below the $55,000 area average.
Jennifer’s analysis reveals:
- Outdated kitchen and bathrooms explain the discount
- All bedrooms meet code with good sizes and layouts
- Local rents for updated 4-bedrooms reach $1,800-2,000
She purchases for $160,000 and invests $25,000 in updates:
- Kitchen refresh: $8,000
- Bathroom updates: $7,000
- Paint, flooring, fixtures: $10,000
Total investment: $185,000 ($46,250 per bedroom)
After renovations, Jennifer has two options:
- Rent for $1,900 monthly (exceptional returns at her basis)
- Sell for $240,000 to an owner-occupant
She chooses to sell, achieving a $55,000 profit in four months. The key? Buying below market price per bedroom, adding value efficiently, then selling at slightly above market price per bedroom to owner-occupants who focus on monthly payments rather than investment metrics.
Conclusion and Action Steps
Mastering price per bedroom analysis transforms you from an average investor into a sophisticated deal finder. While others chase properties based on gut feelings or surface-level metrics, you’ll identify opportunities with mathematical precision.
This “hidden” metric becomes your competitive advantage because most investors—and even many agents—don’t track it systematically. By integrating price per bedroom into your analysis framework, you’ll spot deals others miss and avoid overpriced properties others chase.
Take these three actions this week:
- Calculate price per bedroom for your current portfolio. You might discover you’ve been unconsciously following this principle or find opportunities to reposition properties.
- Research local market averages by bedroom count. Build a simple spreadsheet tracking recent sales with columns for address, sale price, bedroom count, and price per bedroom. Sort and analyze patterns.
- Adjust your analysis spreadsheets to include this metric. Whether you use The World’s Greatest Real Estate Deal Analysis Spreadsheet™ or your own system, add price per bedroom calculations to your standard workflow.
Remember: real estate investing success comes from finding edges others overlook. Price per bedroom represents one of the most underutilized yet powerful edges available. Start using it, and watch your deal flow and returns improve dramatically.