While 73% of real estate investors claim they analyze deals thoroughly, most can’t accurately calculate or interpret price per unit—leading to overpaying by 15-30% on multifamily properties. This single oversight destroys more wealth than any other analytical mistake in real estate investing.
Imagine Sarah, a diligent investor who passed on a $400,000 fourplex because the total price seemed high, while eagerly buying a $350,000 duplex in the same neighborhood. Had she understood price per unit, she’d have realized the fourplex at $100,000 per unit was far superior to the duplex at $175,000 per unit. That “expensive” fourplex now generates $4,200 monthly while her duplex brings in just $2,400.
Price per unit is the most misunderstood yet critical metric for multifamily investing success. Master this concept, and you’ll spot opportunities others miss, negotiate from strength, and build wealth faster than investors fixated on total purchase price.
In this comprehensive guide, you’ll learn calculation methods that actually work, market comparison techniques, financing implications most investors never consider, and strategic applications that separate amateur investors from portfolio-building professionals.
What Price Per Unit Actually Means
Price per unit is simply the total purchase price divided by the number of rentable units in a property. A $600,000 sixplex costs $100,000 per unit. This metric matters more than total price for multifamily properties because it standardizes comparison across different property sizes.
The psychology behind why investors overlook this metric is fascinating. Our brains naturally focus on the total price—it’s the big, scary number that triggers emotional responses. But imagine walking into a grocery store and only looking at the total price without checking the per-pound cost. You’d make terrible decisions, yet that’s exactly what happens in real estate investing.
Price per unit transforms emotional decisions into analytical ones. It reveals the true cost of acquiring each income-producing component of your investment. While single-family investors can ignore this metric, multifamily investors who don’t understand it are essentially flying blind.
How It Differs From Related Metrics
Understanding price per unit requires distinguishing it from similar-sounding metrics that serve different purposes:
- Price Per Square Foot – Measures cost relative to building size, not income potential. A 10,000 square foot building with ten units costs the same per square foot as one with five units, but the price per unit doubles.
- Price Per Bedroom – Less accurate for mixed unit types. A building with studio apartments and three-bedroom units becomes impossible to evaluate fairly using this metric.
- Gross Rent Multiplier – Focuses on the relationship between price and income, while price per unit isolates acquisition cost regardless of current rents.
- Capitalization Rate – Measures your return on investment, while price per unit measures your entry cost. Two properties with identical cap rates can have vastly different prices per unit.
Relationship to Other Key Metrics
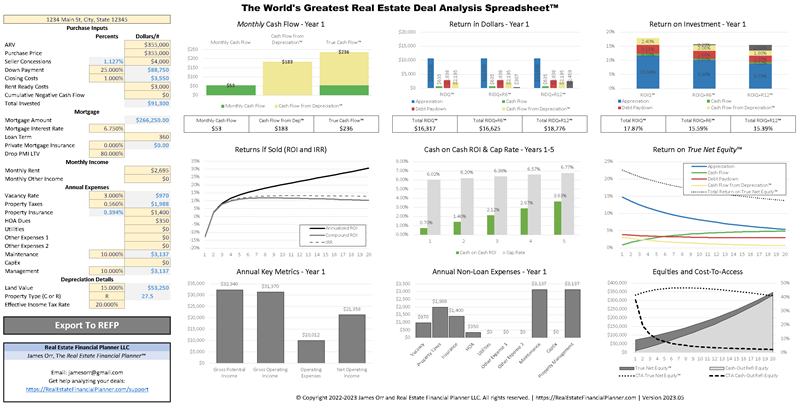
Price per unit connects directly to rent per unit, creating the foundation for rent-to-price ratio analysis. In The World’s Greatest Real Estate Deal Analysis Spreadsheet™, price per unit serves as the baseline input that drives downstream calculations for cash flow, ROI, and portfolio performance metrics.
Lenders rely heavily on price per unit for underwriting multifamily loans. They maintain databases of typical ranges by property class and location, instantly flagging deals priced outside normal parameters. Understanding their perspective gives you negotiating power and realistic financing expectations.
At the portfolio level, tracking average price per unit across all properties reveals your true acquisition efficiency. Portfolio lenders evaluate this metric when considering blanket loans or credit facilities, making it essential for scaling beyond individual properties.
Calculating and Analyzing Price Per Unit
The basic calculation seems deceptively simple: Purchase Price ÷ Number of Units = Price Per Unit. A $480,000 sixplex equals $80,000 per unit. But real-world applications require nuanced understanding.
Consider utilities and common areas. That sixplex might have six apartments plus a rentable basement storage unit. Do you count seven units? Generally, only spaces generating monthly rental income count as units. Storage, parking, and laundry income typically get calculated separately.
Advanced Considerations
Real estate rarely fits into neat categories. Here’s how to handle common complications:
- Non-Conforming Units – In-law suites, converted garages, and unpermitted units require judgment calls. If they generate separate rent and have private entrances, count them. If they’re just extra bedrooms marketed creatively, don’t.
- Mixed-Use Properties – That fourplex with ground-floor retail requires value allocation. One approach: Calculate the commercial space’s value using market price per square foot, subtract from total price, then divide the remainder by residential units.
- Renovation Costs – Include immediate necessary repairs in your price per unit calculation, but not future value-add improvements. If the roof needs immediate replacement, that’s part of your true acquisition cost.
- Closing Costs – Include for accuracy in personal analysis, exclude when comparing to market data. Most published price per unit figures exclude closing costs, so match their methodology for apples-to-apples comparisons.
Data Sources for Market Comparisons
Finding reliable price per unit data requires multiple sources:
Start with CoStar or apartment association reports for professional-grade data. These services track actual transaction prices, not listing prices, providing accurate market benchmarks. Local apartment associations often publish quarterly reports with price per unit ranges by submarket.
For smaller properties, search your local MLS filtering by unit count. A search for “2-4 units sold in last 6 months” quickly reveals market pricing. Export results to spreadsheet format for analysis.
County assessor databases provide free historical data. While assessed values lag market prices, the relative relationships between properties remain useful. Building your own database over time creates the most valuable resource—track every multifamily sale in your target areas.
Practical Analysis Framework
Imagine Marcus analyzing a triplex listed at $375,000. His systematic approach reveals the true opportunity:
First, he calculates basic price per unit: $375,000 ÷ 3 = $125,000. Next, he pulls comparable sales from the last six months, finding similar triplexes sold between $105,000 and $118,000 per unit. The subject property seems overpriced.
But Marcus digs deeper. The comparables averaged 850 square feet per unit while this triplex offers 1,100 square feet units. Adjusting for size, the effective price per unit becomes competitive. He creates a comparison spreadsheet with columns for address, sale date, price per unit, unit size, age, and condition rating.
This framework reveals that seemingly expensive properties might offer value, while “bargains” often reflect deferred maintenance or inferior locations. Setting acquisition criteria based on adjusted price per unit—perhaps “nothing over $110,000 per unit after condition adjustments”—creates disciplined investment decisions.
Impact on Valuations and Financing
Price per unit directly influences property valuations, financing options, and investment returns. Understanding these connections transforms you from a passive price-taker to an active deal architect.
Property Valuation Applications
Appraisers rely heavily on price per unit for multifamily valuations, especially in markets with limited comparable sales. They’ll typically weight three approaches: price per unit comparisons, income capitalization, and replacement cost. In stable markets, price per unit often receives the highest weighting.
This creates opportunity for savvy investors. While cap rates fluctuate with interest rates and market sentiment, price per unit trends move more gradually. A quick valuation formula—market price per unit × number of units—provides surprisingly accurate estimates. If fourplexes typically trade at $95,000 per unit in your market, that’s your baseline expectation.
Financing Implications
Lenders evaluate deals through price per unit lenses, affecting your financing in multiple ways:
- Loan-to-Value Calculations – Banks maintain internal databases of typical price per unit ranges. Pay significantly above market, and they’ll reduce your loan amount regardless of the appraised value.
- Debt Service Coverage – Lower price per unit generally means better cash flow coverage. Lenders recognize this relationship, sometimes offering better terms for efficiently priced acquisitions.
- Portfolio Lending – When packaging multiple properties for portfolio loans, lenders average your price per unit across all properties. Strategic buying below market averages increases future borrowing capacity.
- Refinancing Opportunities – Track market price per unit appreciation separately from rent growth. If market values increase 20% while rents grow 10%, you’ve found refinancing opportunity often missed by income-focused investors.
Investment Returns Analysis
Starting analysis from price per unit clarifies return calculations. If you acquire units at $80,000 each generating $800 monthly rent, that’s a 1% monthly return before expenses—the classic 1% rule expressed through price per unit.
Break-even analysis becomes intuitive: At $80,000 per unit with 50% operating expenses, you need $400 monthly per unit to cover a 6% mortgage. This quick math, impossible with total price figures, enables rapid opportunity assessment.
Common Mistakes That Cost Investors Money
Even experienced investors stumble over these price per unit pitfalls:
- Comparing Across Property Classes – Class A properties commanding $150,000 per unit doesn’t make Class C properties at $50,000 per unit bargains. Different tenant profiles, maintenance requirements, and appreciation rates make cross-class comparisons meaningless.
- Ignoring Unit Mix – A building with all two-bedroom units prices differently than one mixing studios through three-bedrooms. Investors comparing raw price per unit miss this crucial distinction.
- Geographic Blindness – Using city-wide averages for neighborhood analysis leads to terrible decisions. Price per unit can vary 300% within a single city based on school districts, crime rates, and employment access.
- Emotional Decisions – “But it’s only $50,000 per unit!” means nothing without context. In some markets, that’s expensive. In others, it signals serious problems.
- Neglecting Deferred Maintenance – The true cost per unit includes necessary repairs. That bargain at $45,000 per unit needing $20,000 per unit in repairs actually costs $65,000 per unit.
Imagine Jennifer, who bought a “bargain” eight-unit at $45,000 per unit in a market averaging $65,000 per unit. She felt brilliant until discovering $20,000 per unit in foundation repairs, plus outdated electrical systems requiring another $10,000 per unit. Her true cost hit $75,000 per unit—above market price for a building still needing cosmetic updates.
Strategic Applications for Portfolio Growth
Understanding price per unit transforms from academic exercise to wealth-building strategy through practical applications:
Portfolio Building Strategy
Set clear acquisition criteria using price per unit thresholds. “Only properties under $85,000 per unit in B neighborhoods” creates automatic discipline. This prevents emotional overpaying while ensuring consistent deal flow.
Geographic arbitrage opportunities emerge when tracking price per unit across markets. Imagine discovering similar fourplexes cost $120,000 per unit in Market A but only $75,000 per unit in Market B, while achieving identical rent-to-price ratios. This insight drives intelligent market selection.
Timing market cycles becomes clearer through price per unit trends. When prices spike 20% in eighteen months while rents increase just 8%, you’ve identified a selling opportunity. Conversely, flat prices with rising rents signal buying opportunities.
Negotiation Tactics
- Anchoring Arguments – Start negotiations by establishing market price per unit. “Similar properties traded at $82,000-$87,000 per unit” frames discussions better than total price arguments.
- Seller Psychology – Motivated sellers often focus on total price. Offer their desired total by adding units through creative structures—ADUs, basement conversions, or garage apartments.
- Creative Deal Structuring – Propose seller financing based on per-unit values. “I’ll pay $90,000 per unit—above market—with you carrying 20% at competitive rates” often succeeds where traditional offers fail.
Exit Strategy Planning
Track market price per unit appreciation separately from your property’s performance. If the market appreciates 5% annually while your improved property gains 8%, you’ve created real value beyond market movement.
Value-add ROI calculations depend on understanding price per unit spreads. Imagine David investing $15,000 per unit in renovations. If updated properties command $25,000 per unit premiums, he’s created $10,000 per unit in profit—impossible to calculate using total price figures.
Portfolio refinancing strategies optimize around price per unit increases. When your average acquisition cost sits 30% below current market values, blanket refinancing unlocks capital for expansion while maintaining conservative loan-to-value ratios.
Risk Management Applications
Diversification across price per unit ranges reduces portfolio risk. Combining Class B properties at $80,000 per unit with Class C at $45,000 per unit balances appreciation potential with cash flow stability.
Market corrections impact different price points differently. Properties acquired at 70% of market price per unit maintain equity through downturns, while those bought at market peaks face underwater mortgages. Building in this margin of safety protects long-term wealth.
Your Path Forward
Master investors think in price per unit while amateurs fixate on total price. This shift in perspective—from emotional reaction to analytical framework—separates successful portfolio builders from perpetual beginners.
Start implementing these concepts immediately. Pull recent multifamily sales in your market, calculate price per unit for each, and build your comparison database. Download The World’s Greatest Real Estate Deal Analysis Spreadsheet™ to integrate price per unit analysis into comprehensive deal evaluation.
The next time you analyze a multifamily property, resist the total price sticker shock. Instead, calculate price per unit, compare to market data, adjust for property specifics, and make decisions based on data rather than emotion. This single change in approach will reveal opportunities others miss and protect you from overpaying in competitive markets.
Remember Sarah from our introduction? She learned from her mistake. Today, she owns twelve units acquired at an average of $72,000 per unit in a market now averaging $95,000. That $276,000 in equity came not from timing or luck, but from understanding and applying price per unit analysis to every acquisition decision.
Your multifamily investing success depends on mastering this fundamental metric. Stop looking at total prices. Start thinking price per unit. Your future portfolio will thank you.