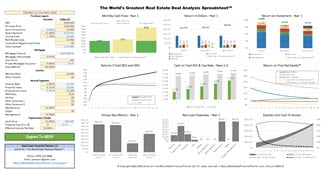
Scenario
  Charts which we sometimes write by combining the icons and text as
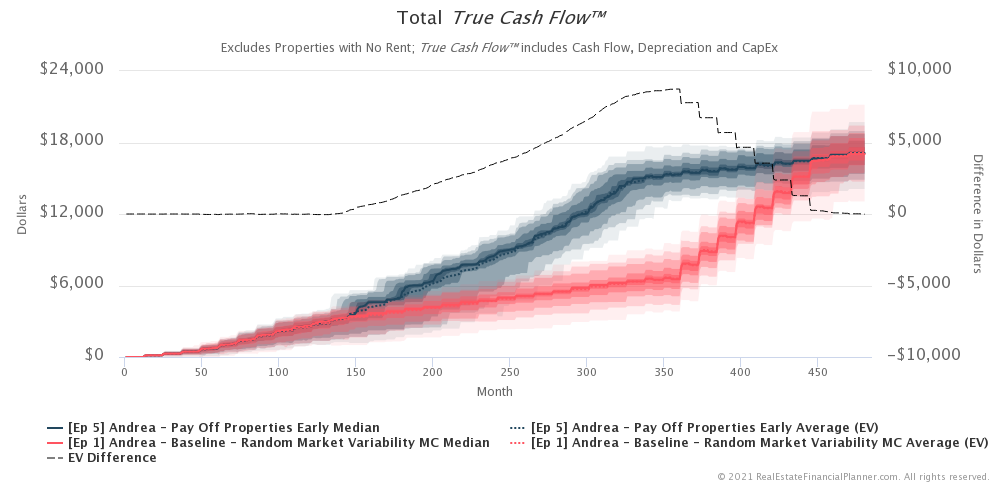
Cash Flow
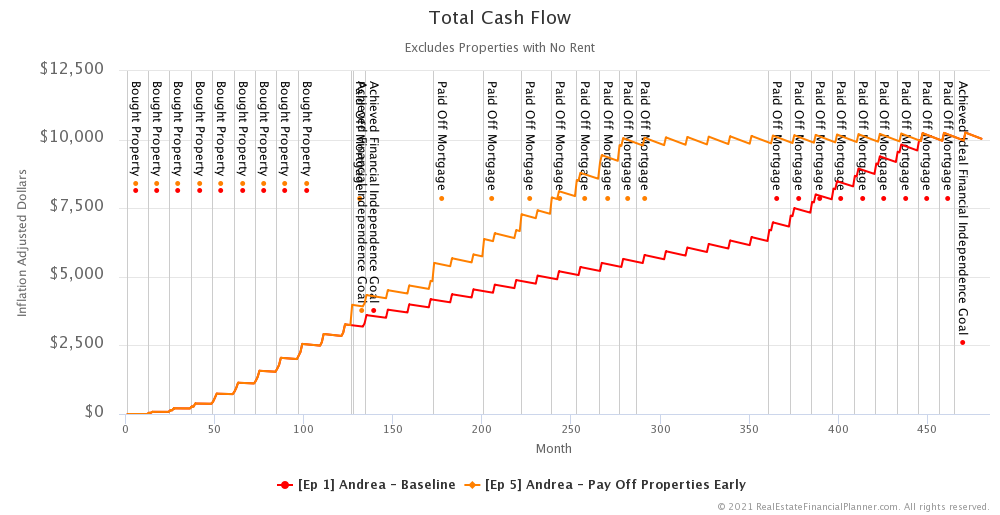
What is cash flow for rental properties? Why is it important? How is it calculated? And cash flow reports for your investments. That’s what we’ll cover here. First, what is cash flow for rental properties? Cash flow is the money generated from your rentals after you account for all the income from the property and subtract all the expenses for the property. Income from your property might include: Rent from properties Option fees on properties Additional mid-month payments Utility bill back Income from onsite amenities like laundry or internet Appliance rent IMPORTANT NOTE: We do not typically consider Cash Flow … Read more