This class was taught live by James Orr on Black Friday November 25, 2022.
In this class James walks you through the  Baseline Nomad™
He created over 300  Scenarios
Click to Select Your City Model
Of course, you can change any of the assumptions in case your unique situation is different than what he used.
Go to the Models page and select your city, then the Baseline Nomad™ Scenario
This class lays the groundwork for a whole series of future classes, so it is recommended that you go through it.
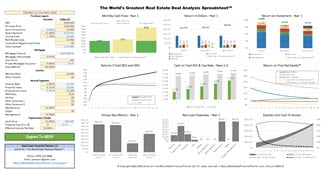
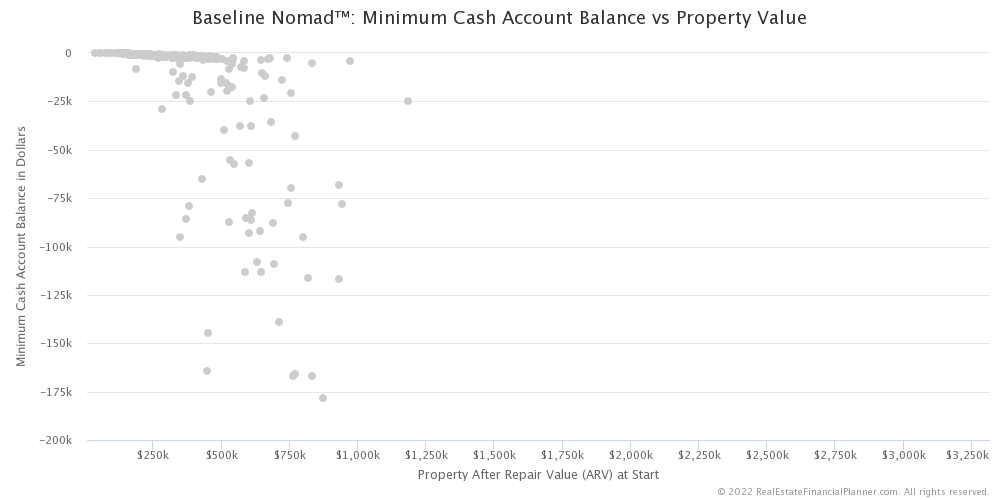
Summary Charts
After James walks you through the assumptions for Baseline Nomad™ Scenario Baseline Nomad™ Scenario
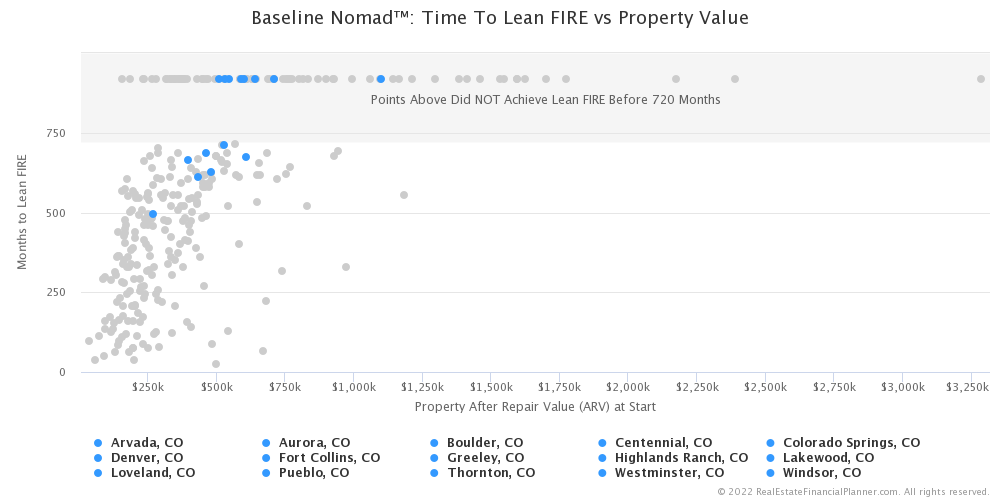
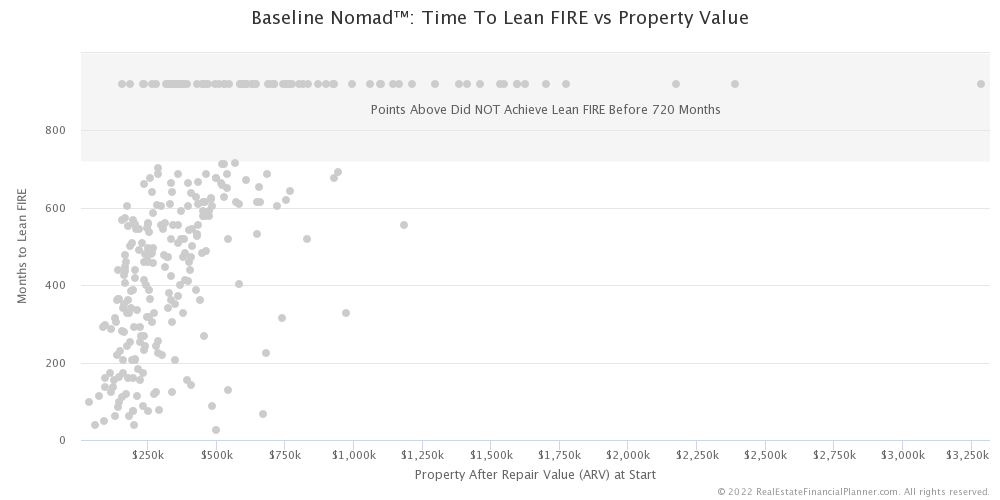
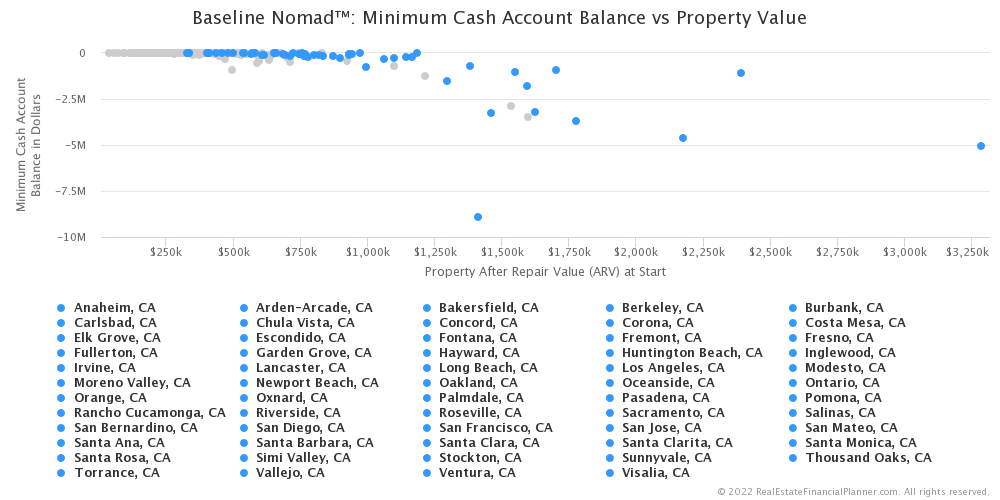
For example, here’s a chart showing you how long it would take for someone to achieve financial independence (lead FIRE) doing Nomad™ in each city charted versus the price of properties in that. See the dynamic version of this chart that you can mouse over and see which city each dot is.
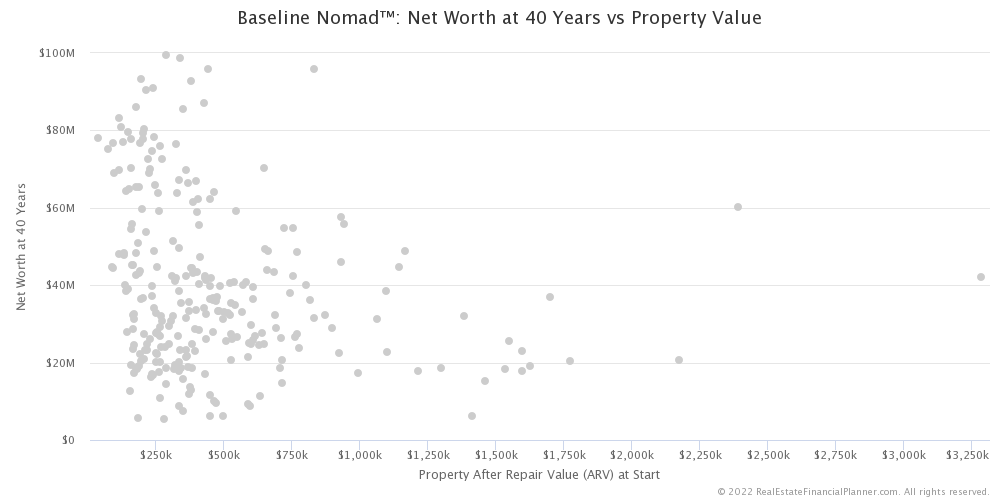
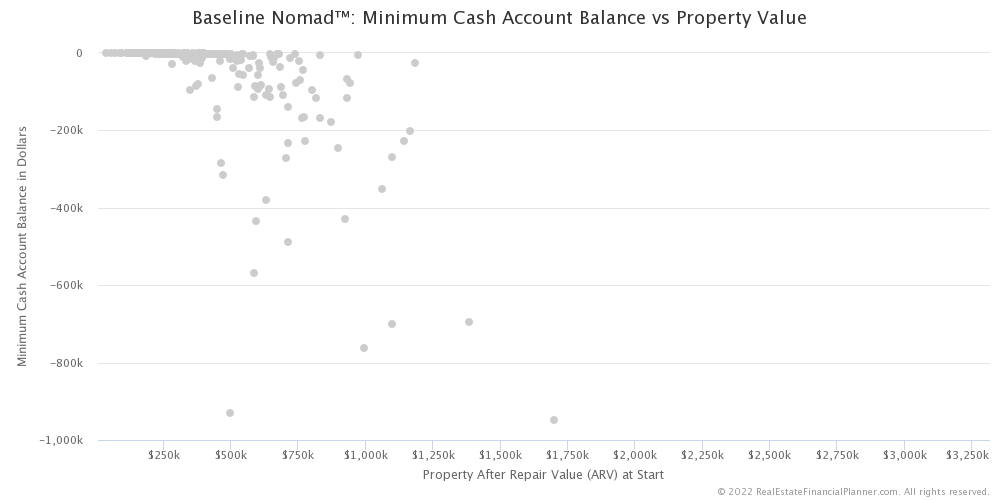
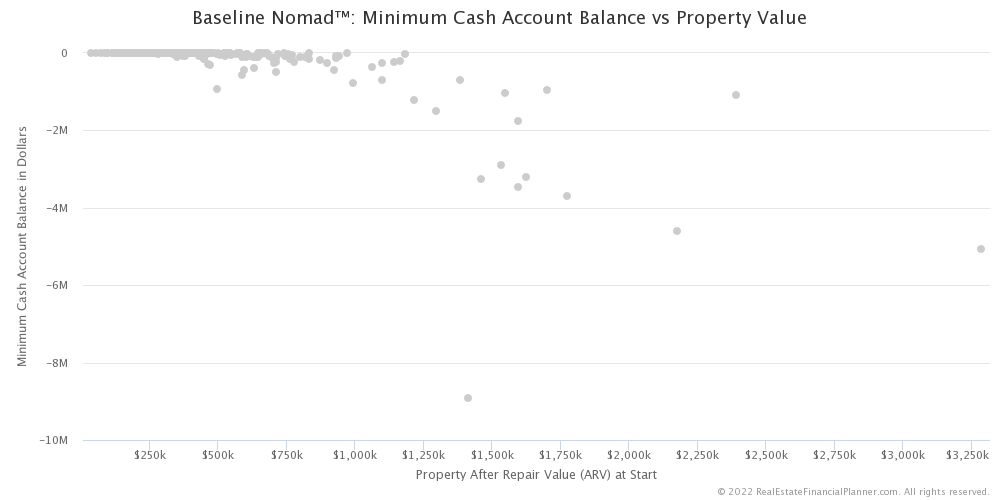
The following are similar charts but instead of showing how long it takes to achieve financial independence, it shows their net worth 40 years after starting the strategy. Again, this is plotted against the property prices.
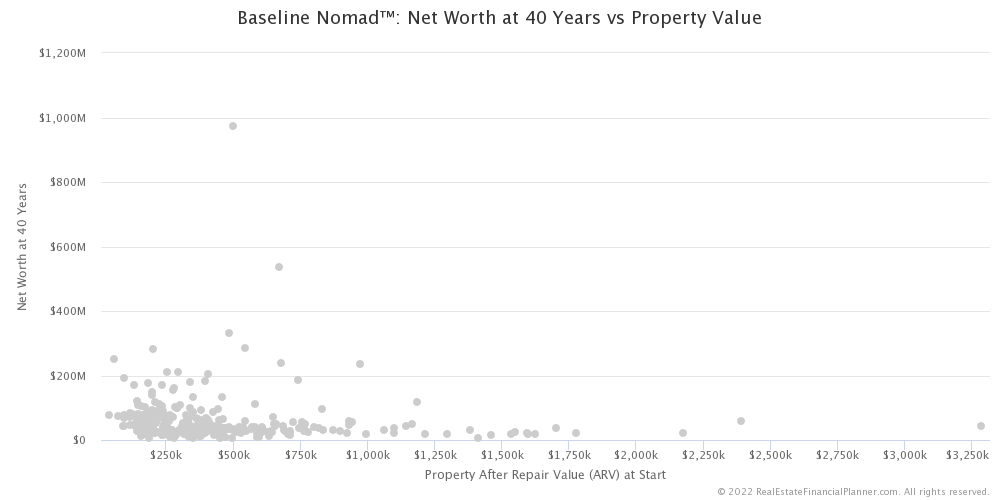
Since that chart is hard to see because there are a few data points where it results in a very, very high net worth… here’s the same chart but excluding anything over $100 million net worth.
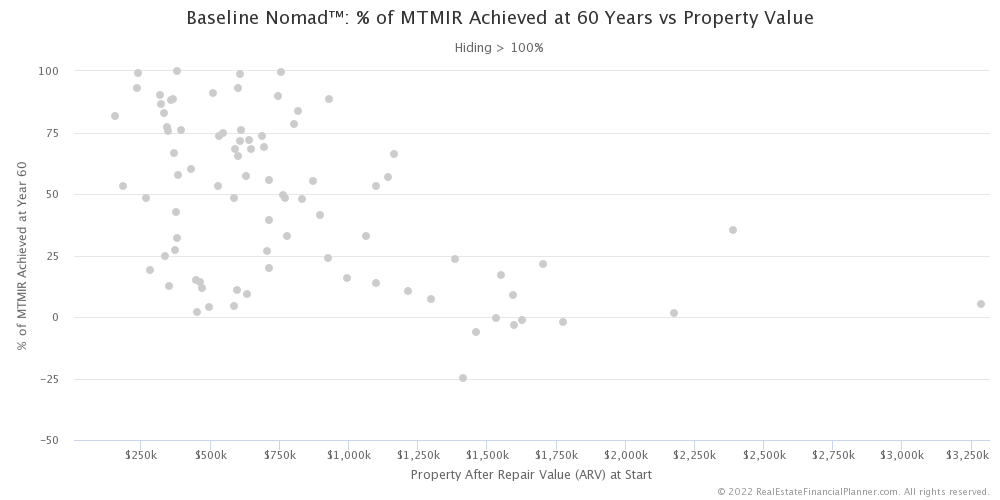
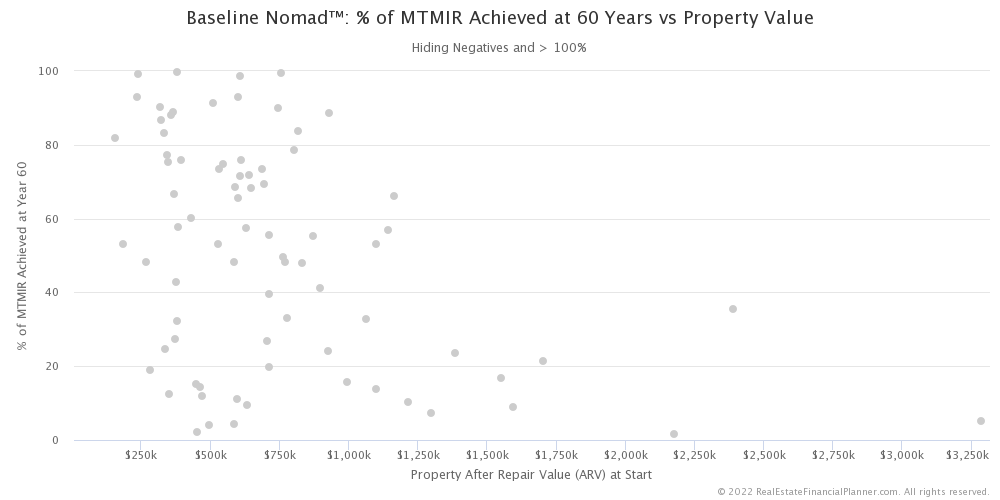
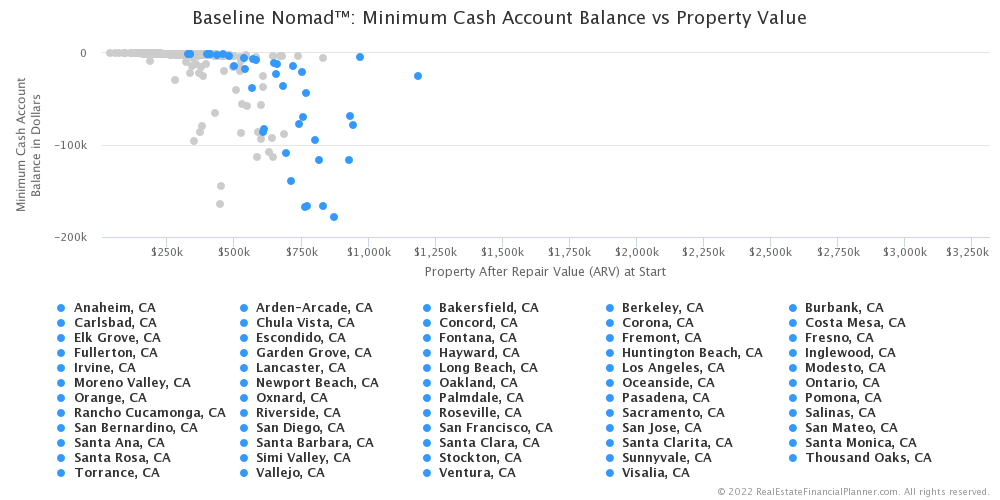
These are additional charts explained in the video.
Resources Mentioned During the Class
The following were some of the resources mentioned during the class:
- Cash Flow Power Meter™ – Learn about the Cash Flow Power Meter™ that appears at the top of assumptions for every
 Property
 - Return Quadrants™ – Learn about all the different Return Quadrants™ and how we use them to show you how a property is performing.
- Everything You Learned About Deal Analysis is Wrong – ROIQ+R™ – A full class on the Return Quadrants™ and both the why we use reserves in our return calculations and how to use reserves when doing these cacluations.
- Model – Select YOUR CITY and see the
- Real Estate Investor FIRE – Learn about the different types of Financial Independence Retire Early (FIRE) for real estate investors with this full class.
- Asset Allocation Secrets of Real Estate Investors – Learn about asset allocation for real estate investors in this special class recording.
- The Ultimate Guide to Private Mortgage Insurance – Learn all about Private Mortgage Insurance (PMI) in this special class recording.