Are 2 to 3 Rental Properties
Enough to Retire Comfortably
in Northern Colorado?
February 7, 2019
Dear Northern Colorado Real Estate Investor…
Can you retire comfortably in Northern Colorado on 2 to 3 rental properties?
It seems like such a simple question, but it is more nuanced than you might imagine. I’ve been teaching real estate investing classes in Fort Collins since 2003—about 40 different classes each year covering topics from asset protection to deal analysis to bookkeeping for rentals to financing to tenant screening and property management to local market stats and achieving financial independence and retiring early (FIRE). You can attend these classes for free near Drake/Shields in Fort Collins just about every Wednesday and even access previously recorded versions of them or listen to them on the go via our podcast. More info on that in a bit. Back to our story for now…
Do you know one of the things I learned teaching weekly classes and talking to hundreds of real estate investors over that time? Your financial situation is different than most other people. Sure there are similarities, but your income, your tax situation, your charitable giving desires, your extended family of children, grand-children, parents and loved ones, your starting assets and your desired standard of living in retirement are all unique to you.
And, these nuanced personal differences impact the answer to questions like Can you retire comfortably in Northern Colorado on 2 to 3 rental properties? or Can you retire comfortably in Northern Colorado on $1 million?
Heck, your numbers may not even be 2 to 3 rentals. Maybe you already have 5. Or, it might not be can I retire on a million… maybe it’s: can I retire on far less?
Of course, the answer depends on your unique situation and the assumptions you make. I don’t know about you, but I find it annoying when I click through to an news article or listen to a podcast about investing or retiring and they give such a generic example that it is hard to figure out exactly how that even applies to me and my personal situation. Click-bait titles like: “this simple trick to retiring in your 30’s”, or “how johnny went from $0 to retired in 10 years” only lead me to stories of people working $500,000 per year jobs and saving 90% of their income. I could retire in 10 years too if I was saving $450,000 per year for 10 years. So frustrating…
What about the rest of us? Over the years teaching investor classes, I began writing software that would allow us to run what-if scenarios to model a variety of investing strategies and plans. With your permission, I am going to share with you links to be able to copy some of the more common paths to some common goals, but I will be empowering you to change the assumptions to match your personal situation and see how that plan might work for you and your personal assumptions.
We’ll get to the real estate ones in a moment, but let’s first start with a couple basic ones modeling you saving and investing in stocks.
Model Your Personal Situation: Investing $100/mo in Stocks
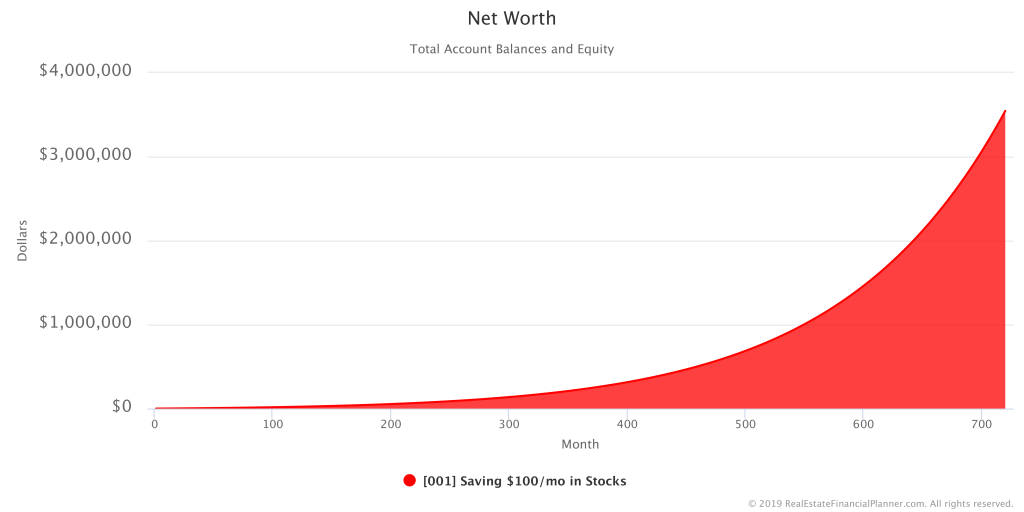
For this first strategy, we’re going to assume that you’re saving $100 per month and investing in the stock market. The $100 per month is a variable that you can change. I’d rather not sound like a parrot constantly repeating myself that “you can modify each assumption”. Rather than repeat myself incessantly, I will show you numbers that you can easily adjust by include Variable By You after each number that you can adjust to match your unique situation. OK?
So, we’re going to assume this strategy is for you to save $100 Variable By You and earn 8.97% Variable By You per year when invested in the stock market.
Here are some of my other assumptions for this (again, you can adjust these to better match your situation).
- Starting with $0 Variable By You invested in the stock market at the beginning – vary this to see what impact starting with some money at the beginning has when you can retire. What if you do have a small nest egg or a full war chest already? Easily adjust how much you’re starting with by changing the Opening Balance on the
 VTSMX with CAGR of 8.97% over 1871-2017 account to the amount you currently have. Easy… now the system will allow you to re-run it and see how that impacts the results of your strategy.
 - Earning $48,000 per year Variable By You – This is based on you and your spouse earning $12 per hour and working 2,000 hours per year each. 2,000 hours × $12 = $24,000 for you and another $24,000 for your spouse = $48,000 per year. What happens if you make more? What if you’re single? What if you earn less? What if you work two or more jobs or have a side hustle? Just adjust the Paycheck field on the
 Paycheck and Personal Expenses rule to change this assumption.
 - Effective Income Tax Rate of 17.49% Per Year Variable By You – This is based on married filing jointly for that $48,000 per year earnings, with exemptions for you and your spouse, but no other deductions. This is both federal tax and state of Colorado tax combined. What if you’ve got deductions or are in a different tax bracket than our assumptions? Easy… just change the Tax Rate on the Paycheck and Personal Expenses rule.
- Target Monthly Income in Retirement of $3,900 Variable By You – This is the $4,000 per month that you’re earning minus the $100 Variable By You per month that you’re saving. If you’re earning $4,000 Variable By You and saving $100 you’re really living on $3,900 per month so this is the target to maintain your current lifestyle in retirement. The software will automatically adjust this number for inflation for you. What if you could live on less in retirement? What if your expenses in retirement will be higher? Change the Target Monthly Income in Retirement field on the
 Saving $100/mo in Stocks scenario edit page and see the impact when you rerun it.
 - Yearly Safe Withdrawal Rate of 4% Variable By You – This is the percent of your stock market investments that you feel you can safely withdraw each year and not run out of money in retirement. It is kind of an important assumption. We’re using the assumption from the “Trinity Study” here, but some would argue you may want to be more conservative and use 3.25% or even 3%. How does this work? When you your stock market balance has enough money that 4% of it would be greater than or equal to your target income in retirement (for the year), then you’ve reached financial independence where your assets can provide you an income to be able to live your passion and/or retire. What happens if you’re OK running out of money in retirement and want to use a higher safe withdrawal rate than 4%? What if you want to be conservative and use a lower number like 3% or 3.25%? To adjust your assumption from our 4%, change the Yearly Safe Withdrawal Rate on the Saving $100/mo in Stocks scenario edit page.
- Inflation is 3% Per Year Variable By You – $1,000,000 today is not the same as $1,000,000 in thirty years. This is inflation. We’re using an inflation rate of 3% because the long-term US average of CPI has been in the 3% range. Some people believe we may see hyper-inflation. Do you? Some people believe we may see lower inflation. Do you? It is easy to change… just edit the Inflation Rate on the Saving $100/mo in Stocks scenario edit page. I’m getting ahead of myself, but you can even model periods of high inflation where inflation is higher for a period of time then returns to more common levels using Rules… everything is customizable and set by you.
- Your Paycheck and Personal Expenses Are Increasing With Inflation Variable By You – We are assuming that your expenses are increasing each month with the inflation rate. As is your income. As is your target income in retirement. As is the $100 Variable By You you save each month. You can choose to turn off each of these if you wish. I wouldn’t personally, but that’s the beauty of this software… it allows you to model your perception of reality and not have to deal with the generic garbage you find in articles, blog posts and podcasts across the internet. To change whether these values adjust with inflation just toggle the Inflation Adjusted checkbox on the Paycheck and Personal Expenses rule page.
- Run The Strategy for 720 Months (60 years) Variable By You – This should give you some time to see the results, but if you’re younger than 40 years only, I’d personally adjust this to run until you’re 100 if you think you’ll live that long. What happens if you live past 70? 80? 90? 100? 110!? Change the Number Of Months variable on the Saving $100/mo in Stocks scenario edit page. Rerun it and see the newest results.
So, is saving $100 Variable By You and investing in the stock market earning 8.97% per year Variable By You enough to allow you to retire comfortably in Northern Colorado? The answer will likely surprise you. Use the button below to copy this Scenario into your own Real Estate Financial Planner™ account and run it as is or change any or all of the assumptions to better model your unique personal situation.
This Scenario
Scenario into my Real Estate Financial Planner™ Software
If you believe this is an error and should be available to copy, please contact support and include a link to this page.
So, how was it? Did you have enough to retire comfortable? How did you know?
Net Worth
Did you look at the  Chart of Net Worth? How much did you end up with?
How Do I View Charts? If you need help figuring out how to view charts, check out our help section on that. We have 100+ different Charts you can view to give an unparalleled insight into any investing strategy.
Did your Net Worth number seem higher than you thought it was going to be? Remember, $1 million 60 years in the future isn’t the same as $1 million today. Did you click on the Inflation Adjusted button on your Net Worth Chart to see what that Net Worth is in today’s dollars? Was that eye-opening? Big difference, right?
Did You Achieve Financial Independence?
Did you have enough invested in stocks such that, at 4% safe withdrawal rate Variable By You, the returns from stocks could provide you enough income to cover your Target Monthly Income in Retirement? How did you know?
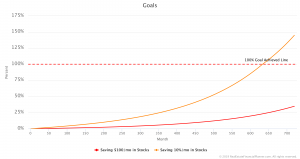
Did you look at your  Goals and specifically the Goal of Safe Withdrawal Rate and Cash Flow Toward Target Monthly Income in Retirement? That will will show you what percent of your Goal of hitting your Target Monthly Income in Retirement you’ve achieved.
When you’ve achieved 100% of that Goal, you’ve reached the point where the income from your safe withdrawal rate and any cash flow from rentals (you don’t have any in this Scenario) is meeting your full Target Monthly Income In Retirement. Is that financially independent for you? Everyone has their own definition you know.
Before we get to more sophisticated real estate modeling, let’s do one more common examples with stocks. We can always come back to do different modeling with stocks later.
Model Your Personal Situation: Investing 10% of Your Income in Stocks
In this next Scenario, we’re going to assume you’re saving 10% of your income Variable By You and investing it in stocks. This is up from the $100 per month you were invested before. Does that make a big difference? How much of a difference does it make?
We are using the same assumptions as above (the parrot says: which you can still modify), except:
- Target Monthly Income in Retirement of $3,600 Variable By You – This is the $4,000 per month that you’re earning Variable By You minus the 10% per month that you’re saving Variable By You. If you’re earning $4,000 and saving $400 you’re really living on $3,600 per month so this is the target to maintain your current lifestyle in retirement. The software will automatically adjust this number for inflation for you Variable By You. What if you save more or less? To change how much you’re saving adjust your Personal Expenses on the Paycheck and Personal Expenses rule.
Is saving 10% of your income Variable By You and investing in the stock market enough to allow you to retire comfortably in Northern Colorado? Copy this Scenario saving 10% of your income into your own Planner™ and change any of the assumptions to fit your own personal situation.
This Scenario
Scenario into my Real Estate Financial Planner™ Software
If you believe this is an error and should be available to copy, please contact support and include a link to this page.
Now that you’ve had a chance to view it. Here are some questions for you:
Did You Reach Your Target Monthly Income in Retirement?
How much faster did you achieve financial independence by saving 4 times as much ($100 versus 10% or $400 per month) Variable By You? Did you check the Goal chart? What did it tell you?
What’s Your Net Worth Saving 10% of Your Income?
What does your Net Worth Chart show you?
How much more (or less) is it than the previous Scenario?
If you adjust for inflation by clicking on the Inflation Adjusted button on the Chart page, how much is it like having in today’s dollars?
What If You Save More or Less Than 10%?
What if you save 15% or 20% of your income? Or… more? Reduce your personal expenses in your Paycheck and Personal Expenses rule and adjust your Target Monthly Income in Retirement and rerun the Scenario. How much faster do reach financial independence?
Model Your Personal Situation: Buying a Home to Owner-Occupy and Investing 10% of Your Income in Stocks
We will eventually loop back around to stocks when we talk about  Monte Carlo modeling later, but let’s change it up.
In this next Scenario, we are going to add in your first property… a home for you to live in.
We will use the same assumptions for saving 10% (which you can still modify… remember the parrot?), except we’ve added these additional assumptions that you can also modify:
- Save up $5,000 Variable By You in Cash Reserves Plus Down Payment, Plus Closing Costs Before Buying
 Property – This is the $5,000 that you have in cash reserves for emergencies. Need more? How much will that impact your ability to achieve financial independence? Adjust the Minimum Account Balance field in the Buy Property When Account Has Down Payment to find out.
 - Your Rent is $1,500/month Variable By You Until You Buy A Property To Live In – Once you buy a property, you’re rent of $1,500 is removed from your expenses and the actual cost of the mortgage, taxes and insurance are included as expenses. What if your rent is higher than $1,500? Or, lower? Does that have any impact? Adjust the Dollar Adjustment After Buying Owner Occupant Property field in the Paycheck and Personal Expenses after copying it to your Planner™ to find out.
These are the assumptions we made about the home you bought to live in. Again, these are all Variable By You… meaning you can change any of them.
| Variables | Typical Home 5% DP |
|---|---|
| Property Type | Dynamic Nomad™ |
| After Repair Value | $300,000 |
| Purchase Price | $300,000 |
| Appreciation Rate | 3% |
| Down Payment | 5% |
| Closing Costs | 2.5% |
| Mortgage Interest Rate | 4.375% |
| Mortgage Term | 360 months |
| Monthly Rent (If Rented) | $1,800 |
| Rent Appreciation Rate | 3% |
| Vacancy Rate | 3% |
| Maintenance Rate | 10% |
| Property Taxes Rate | 0.7% |
| Property Insurance Rate | 0.4% |
| Residential/Commercial | Residential |
| Land Value Percent | 15% |
I will comment on a few of the assumptions we made about your Property.
- You’re buying a $300,000 Variable By You home in Northern Colorado. – You can buy less expensive homes locally, but our entry-level price point has been rising rapidly. You can modify Purchase Price and After Repair Value by editing the Property to change these assumptions.
- Property Values are Appreciating at 3% per Year Variable By You – The last few years make that number seem ridiculously low. Over a long period of time, that number is pretty close to what we’ve seen on average. Of course, feel free to model it the way you see the world by changing Appreciation Rate on the Property edit page for this Property. And, if you’re super advanced, you can actually use additional Rules to change the Appreciation Rate over time. You can model a market dip for a period of months or years or growth then a dip or growth then a dip then more growth… really it is up to you. With Monte Carlo modeling, we can run hundreds of variations with a range of Appreciation Rates, Rent Appreciation Rates, stock market rates of return and much more. Again, I am getting ahead of myself here.
- 5% Down Payment Variable By You – We are assuming you’re getting a 5% down payment mortgage. There are nothing down loan programs now so you could technically do 0% down. And, I am assuming you’ve opted to save up a little more and do a single up-front private mortgage insurance (PMI) payment Variable By You instead of paying the PMI monthly. You could do either… insert parrot here. Adjust the Down Payment Percent field on the Property edit page to change this. And, adjust the Closing Costs Percent if you’ve been quoted different closing costs or decide to do PMI a different way (there are 3 ways to do it you know… we cover those in the classes on financing which you have access to).
- Mortgage Interest Rate of 4.375% Variable By You – I am also assuming you’re able to get a mortgage for 4.375% Variable By You. That’s based on a quote from a lender right before I write this. What if this out of date by the time you read this? Oh yeah… that’s right… you can modify all this stuff… so it doesn’t matter. You just use what your lender is quoting you. Adjust the Mortgage Interest Rate on the Property edit page.
- We’re not using your Monthly Rent, Rent Appreciation, Vacancy Rate, Maintenance Rate becauses we’re not renting the Property in this Scenario. We will add a rental Property next! and then we will use those assumptions. Since we’re not renting the Property, it doesn’t matter if it is a residential or commercial type of property or what the % of the property purchase price is considered the value of the land for the tax benefits of depreciation.
Does buying a home to live in locally speed up how quickly you’re able to achieve financial independence? Copy it to your own Planner™ and see for yourself. Go look at your Goals Charts and see for yourself.
This Scenario
Scenario into my Real Estate Financial Planner™ Software
If you believe this is an error and should be available to copy, please contact support and include a link to this page.
Now that you’ve had a chance to view it. Here are some questions for you:
How Long Did You Need To Save To Buy Your Home?
How long did it take you to save up to buy a home? Did you check out the Chart of Number of Properties Owned? That shows you when you buy each Property and how many Properties you own in total (1 in this Scenario).
This Chart be especially cool Chart to look at later when we’re acquiring several Properties at different times.
Faster Financial Independence?
So, did buying a home instead of renting speed up your journey to financial independence? Could you retire or live your passion earlier? How much earlier? Did you check out the Chart of your Goals to see it for yourself?
Did you make any changes to the assumptions? How did that impact the speed of your journey?
Personal Expenses and Your Standard of Living in Retirement
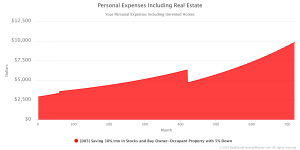
Did you look closely at the Chart showing Personal Expenses Including Real Estate?
Did you see the slight increase in personal expenses from buying a personal residence? Did you see what happens though when you pay off your mortgage?
If you’ve been used to living a $3,600 per month Variable By You lifestyle which includes your housing expenses (rent or mortgage, taxes, insurance) and you no longer have a rent or mortgage payment, what does that do to your standard of living? With lower required housing expenses, are you living a higher standard of living or lower? Interesting, right?
Did you also look at the Chart showing Total Saved? If you maintain the same standard of living (until you retire) and invest what was the mortgage payment, how does that impact your situation? This Chart can help answer questions like: What happens to your savings when you buy your house? What happens to your savings rate when you no longer have a mortgage payment? What impact on your ability to achieve financial independence does that have? I’d encourage you to explore them and see.
How Risky is Buying a House?
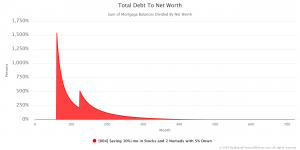
If you’re trying to measure risk, one way to do it is to look at the ratio of your debt to your overall net worth. Did you look at the Chart showing Debt To Net Worth? How does it look buying just one Property?
As you look at other Scenarios, you will be able to compare this measure of risk across multiple strategies to get a feel for how much risk you’re taking on from debt compared to your net worth.
Your Growing Equity
Did you look at the Chart of your Equity? There are several “flavors” of equity.
How about the Chart of Sell With Agent Equity? That ones shows you how much you might net if you sold the Property with a real estate broker and paid a 6% commission and 1% in closing costs.
What about the Chart of Cash Out Refi Equity? Did you see that one? That one shows you how much money you might be able to borrow from your Property if you needed it assuming you could go up to 75% loan-to-value.
Of course, there is the Chart showing the difference between what the Property is worth and what you owe. That’s a plain-vanilla flavor of Equity.
Net Worth: Are You A Multi-Millionaire?
What was your overall Net Worth? Did you look at the Chart)?
Net Worth includes your stock market Account balance plus your equity in any Properties you own.
Was your Net Worth more or less than not buying a Property? With a Premiumn you can compare Scenarios on the same Chart side-by-side.
Model Your Personal Situation: Add A Rental Property!
What if you do the same plan we just discussed above, but with one little addition. After you move into your Property, you continue to save your money for your next owner-occupant home. When you finally save up enough to buy your second owner-occupant Property, you covert the first property to a rental and move into the new Property.
We call this strategy of buying owner-occupant Properties and eventually converting them to rentals the Nomad™ strategy because you’re moving from house to house like a nomad on their woolly mammoth might have moved from cave to cave.
We have probably half-a-dozen two-hour-classes specifically on the Nomad™ strategy that you can access from inside your Planner™ and probably dozens more classes that mention or discuss Nomad™. It is an important strategy because it is one of the best strategies my clients are using in Northern Colorado to acquire Properties with little or nothing down and then eventually converting them to rentals to build their passive income from rental Properties.
FREE Real Estate Investing Classes and FREE Nomad™ Book
We’d love for you to attend our FREE real estate investing classes near Drake and Shields in Fort Collins on just about every Wednesday evening. If you do decide to attend as my guest, I’ll even give you a copy of book on the Nomad™ strategy I wrote. Again, the classes and the book are FREE. I’ll send you an invite to the next class after you copy any Scenario to your Planner™.
Back to this Scenario: with this new Scenario you end up buying two Properties. The first one you bought and lived in. Then, once you buy the second Property, you convert the first one to a rental.
All of the previous assumptions are still exactly the same. And, by now, you also know that you can modify any of the assumptions anyway.
In a moment I will provide you with links to copy Scenarios with 3 and 4 Nomad™ Properties (that would be 2 and 3 rentals respectively) so you can just copy them. But, you could just as easily modify the Maximum # of this Dynamic Property to Buy in the Buy Property When Account Has Down Payment rule to buy more or fewer Properties.
Here’s the link to copy the 2 Nomad™ Property Scenario to your own Planner™. There’s quite a lot to see in this one since it is your first rental. Go ahead and copy into your Planner™ now using the button below.
This Scenario
Scenario into my Real Estate Financial Planner™ Software
If you believe this is an error and should be available to copy, please contact support and include a link to this page.
Now that you’ve been able to copy it to your own Planner™ and dig in, here are some questions for you.
Faster Journey Toward Financial Independence with a Rental Property?
So, how much did a single rental Property help you achieve financial independence? Was it significant?
Did you check out the Chart of Goals to see how many months it took you to hit your Target Monthly Income in Retirement number and get out of the rat race? What did you think: was that as interesting to you as it has been for me when I see the results? Did you use a Premium plan to be able to compare the number of months to other Scenarios to see how big of a difference there was?
Cash Flow From Rental Property
Are you concerned about the cash flow from the rental and jumped right into looking at those Charts: in particular Cash Flow and True Cash Flow™?
The Cash Flow Chart just shows you a full cash flow calculation for the Property for each month that you are renting it.
That means taking all your income on the Property—accounting for vacancy—then subtracting all your expenses on the Property like property taxes, property insurance, maintenance and property management. That’s if you had property management—we assumed you’re managing your property in this particular Scenario. But, you know what I am going to tell you right… you can modify and add in property management by editing the Property and changing the Property Management field and re-running the Scenario to see the new results. Heck… with a Premium plan you can even run the Scenario with and without property management and compare them side-by-side… see for yourself how much faster or slower you achieve financial independence when you have a property management.
*GASP* Negative Cash Flow!
Did you have negative negative cash flow at first? If you zoom in on the Cash Flow Chart for first years what do you see? Is there negative cash flow on this Property?
Other Charts to check are: Total Cumulative Negative Cash Flow and Total Invested in Rentals Including Negative Cash Flow. Each shows a slightly different perspective of cash flow.
If you had put 20% down payment down and bought this Property as a straight rental instead of putting only 5% down payment and living in the Property for a period of time before converting it to a rental… would it have had negative cash flow then? Change the assumptions by adjusting Down Payment Percent on the Property edit page and check for yourself.
How about another question: if you did have negative cash flow, how much negative cash flow did you end up paying until cash flow became positive? Hint: go look at the Chart of Total Cumulative (Invested and Negative Cash Flow). That Chart will show you how much you invested total including any negative cash flow and the initial down payment. Now, after looking at this Chart, let me pose a question: if you had invested a full 20% down payment (which is going to be at least $60,000 in this case since the Property started at $300,000), would you have invested more by putting 20% down payment or 5% down payment plus all the negative cash flow? Another way of wording this same question is: did you invest more than $60,000 when you put 5% down payment and all the negative cash flow?
That’s an interesting question to pose for many folks. Even with a little bit of negative cash flow (if there is any), it may have required less of an investment from you than putting a full 20% down payment.
Of course, if you can find a Property that is a good rental that does not have negative cash flow, buy those before you buy Properties with negative cash flow; that just makes sense. That’s not what we’re discussing here.
Is Cash Flow Really Negative?
Furthermore, even if you are showing negative cash flow… which you’ll need to check the Chart to see… is it really money of pocket to you each month? Maybe, maybe not.
I told you above that we were going to ignore the tax benefits of depreciation for the Property we were living in. But, when we have a Property that we are renting, we do get tax benefits from owning rental Property that we can depreciate.
If you check the Charts related to depreciation you can see the tax benefits we get from depreciation by owning this rental Property. Charts like Total Cumulative Depreciation. But you might be most interested in seeing what happens to when we look at what depreciation does when we multiply it by your Effective Tax Rate Variable By You and see how much extra cash in our pocket we get from being able to depreciate the buildings (not the land) on the rental Properties. I called this Cash Flow from Depreciation since it is money you get back by not paying taxes in your paycheck or money you get back at the end of the year by not having to pay taxes then; how you end up getting it depends on how you set up your exemptions on your paycheck.
When we talk about cash flow plus cash flow from depreciation and any capital expenses you have on the Property, I call that True Cash Flow™. Did you look at the Chart of True Cash Flow™? What did you see there? Did you have negative cash flow at all? Significantly less? Or, maybe it took slightly positive cash flow and made it more positive?
Another Measure of Risk
Do you remember me mentioning that the ratio of your Debt to Net Worth is one measure of risk for your Scenario? Did you compare that Chart to this Scenario? How much riskier is having a second Property? Does that surprise you? It surprises a lot of folks that see it.
There are other Charts that can give us insight into risk as well. One is Resiliency™. That’s the measure of how much something like rent can drop before you have negative cash flow. The more resilient your portfolio is to declines in things like rents, the less risky it is from that perspective.
Did you check out the Charts for resiliency like Average Rent Resiliency™ Dollar which shows, on average for all your rentals…even though you just have one in this Scenario… how many dollars rent can drop before you have negative cash flow. Or, the Average Rent Resiliency™ Percent which measures, again on average for all your rentals, what percent rents can drop before you have negative cash flow.
When you get more rentals, you may also want to look at Total Rent Resiliency™ Dollar and Totla Rent Resiliency™ Dollar which shows up the total amount for all your rentals
Net Worth
Did you check out the Chart of your Net Worth? Pretty cool, right? How things change when you have a rental Property and your owner-occupant Property plus the extra you had left over for investing in stocks, right?
Speeding It Up
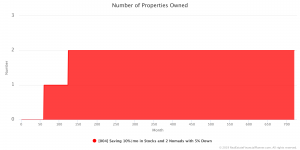
How long did it take you to buy your first Property? The second Property?
You can tell this by looking at the Chart of Number of Properties Owned. That Chart shows you when you bought each Property and how many Properties you own at any given time in the Scenario.
So, it begs some questions: if you could buy Properties sooner, would that allow you to achieve financial independence earlier? Try it and see… maybe add some money to your Account when you start if you have some money that you’re starting with. Or, maybe increase the percentage of your income that you’re saving. Or, maybe adjust the price of the Property you’re trying to buy. Or, maybe reduce your cash reserves required before you buy a Property. Obviously, some of these strategies are better than others in real-life. The Real Estate Financial Planner™ software allows you to quickly see the impact on your overall plan though.
Total Saved
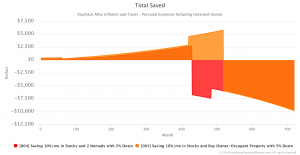
Some of these Charts can be truly nuanced. For example, did you get a chance to look at Total Saved and especially using a Premium plan where you can look at how much you’re saving toward your financial independence between buying just one Property to live in versus the 2 Properties with one as a rental? It is a fascinating Chart to see and really think about what is happening? Which are you saving more with? What if you decided to pay off loans more aggressively (you can use Rules to do that, you know).
Return On Investment and Return on Equity
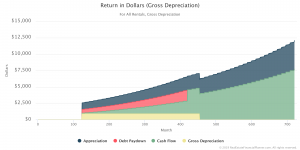
Maybe you like numbers like me. If you do, I bet you’d love to dig into all the return on investment and return on equity Charts. For example, you can look at the return on investment for each of the four primary areas of return for rental properties: appreciation (the tendency for property values to go up over time… often from inflation), debt pay down (paying off what you owe on the mortgage), cash flow (the profit after collecting rent and paying all your expenses on the property including your mortgage, taxes, insurance, vacancy and maintenance) and finally the tax benefits from depreciation. There are individual Charts for each of those both for each individual rental and also the entire Scenario as a whole.
The same holds true for return on equity which shows you the return you get divided by the current equity in the Properties. Return on investment tells you how well you are doing for the amount of money you initially invested. But, over time as the loan is paid off and the Property likely increases in value, your equity grows. If you sold the Property, you could take that money and invest it elsewhere. So, looking at the return you’re getting on the equity you could access and invest elsewhere becomes a more important metric and Chart to look at.
We have return in raw dollars, return on investment and return on equity Charts. You’re welcome. 🙂
So, you can really drill down and get views of your investments and strategies you just can’t get anywhere else. Did you check out some of these Charts for yourself? They’re amazing!
For each of the possible changes to you investing strategy that you can make, how much does it change you achieving your Goal of financial independence? With a Premium plan you can compare multiple Scenarios on the same Chart and quickly and easily see.
Model Your Personal Situation: Two and Three Rentals
So, our entire story began with me asking you a question. Do you remember it at this point? Can you retire comfortably in Northern Colorado on 2 to 3 rental Properties? Moment of truth. Fingers crossed. What do you think?
We will keep all the same assumptions we’ve had to this point, except we will set our Buy Property When Account Has Down Payment rule to limit us to buying 3 Properties and 4 Properties respectively.
The Scenario with the 3 Property limit will mean we have 2 rentals and a Property to live in. The Scenario with 4 Properties will have 3 rentals and 1 Property to live in.
Without further delay, I give you the Scenario with 2 rentals (3 Properties total) to copy to your own Real Estate Financial Planner™ account:
This Scenario
Scenario into my Real Estate Financial Planner™ Software
If you believe this is an error and should be available to copy, please contact support and include a link to this page.
And, here is the Scenario with 3 rentals (4 Properties total):
This Scenario
Scenario into my Real Estate Financial Planner™ Software
If you believe this is an error and should be available to copy, please contact support and include a link to this page.
I can hardly wait until you get a chance to copy them to your own Planner™ and see for yourself what I am so excited about. Did you do it? Did you copy them to your own Planner™? What do you think?
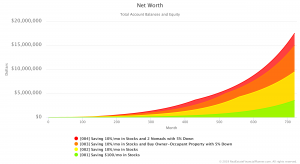
Net Worth of Real Estate Magnate
So, how much of an impact did buying the extra Properties have on your Net Worth? Did you view the Chart? Was it worth buying the extra Property?
Retiring Young and Rich
Did buying the extra rentals get you to the point where you could reach your Target Monthly Income in Retirement fast enough that you’re able to retire young and rich if you so desire?
Do you wonder what would happen if you bought more rentals? Here comes that pesky parrot: you can change the assumption for the number of Properties you buy. Just change the maximum on the current Rule and it will buy that many Properties.
A Secret?! Do Tell James!
I’m going to tell you something now that was a huge reveal for a special 2 hour class I did where I really dug into these models. Not to get too far off topic, but it is a class recording you have access to in your Planner™ by the way. Back to the secret. Well, it is not so much a “secret” because the answer has always been in front of us this whole time; few people ever took the time to do this level of analysis and share it with you. Are you ready for it? Here it is: sometimes buying fewer houses will get you to financial independence faster, but often buying more Properties will increase your standard of living once you are living on your investments. That’s it. Seems obvious, but now you can add (or subtract) rentals and see this for yourself by comparing the Goals using the Premium plan.
The End or Just The Beginning?
I started off asking Can you retire comfortably in Northern Colorado on 2 to 3 rental Properties? and I think I delivered on that promised answer.
Not only did I give you the answer, I gave you a specific, personalized answer that reflects your unique financial situation. You can copy the Scenario you’re most interested in to your Planner™ and change any of our assumptions to see if *you* can retire comfortably. Not just anyone, but you specifically… with your income, your savings rate, your family and loved ones, your perception of your reality of our stock and real estate markets, your standard of living and much more.
So, is that the end of the story? I hope not.
Here’s what I do hope:
- I hope you enjoyed this enough to check out the 200+ hours (over 130 class recordings) that we have, for free, in your Planner™.
- I hope you attend a free, local, live class on Wednesday evenings near Shields/Drake in Fort Collins to see the latest info, get your questions answered and meet other local real estate investors implemented variations of these Scenarios. I will also give you a free Nomad™ book for coming. A link to RSVP is located in your Planner™ as well.
- I hope you’ll analyze your own real estate deals and consider using what I consider to be the best deal analysis spreadsheet ever designed for Excel. You can download a copy of that spreadsheet for free and there are probably a dozen different recorded classes on how to use the spreadsheet and analyze deals as well. Links again in your Planner™.
- If you want to listen to the classes on the road in your car, while out and about or while you’re keeping busy around the house, we also have the 130+ classes available as a free podcast. Again, linked in your Planner™.
- When you buy your first or tenth rental, you may want to know what we use to do bookkeeping and accounting. Some of my clients do use Quickbooks, but most use the special free bookkeeping and account spreadsheet we give out for free. Plus, as you may have guessed, we have classes on how to set up your bookkeeping and best practices. It is one of the 130+ classes.
- I hope you might decide to become a serious student of your own investment strategy and run your own, customized Scenarios using the Real Estate Financial Planner™ software.
- If you want to be able to run more sophisticated Scenarios or want to compare Scenarios side-by-side, we have a Premium plan for that.
- If you want to do advanced modeling or need a little one-on-one time with me to go over your strategy, we have a Premium plan for that.
- If you decide to upgrade to a
 Premium, paid plan from a free one, I do appreciate you supporting the on-going development of the software and all the other resources (recordings, spreadsheets and more) you now have access to—that’s access now whether you opt to pay for a Premium plan or not.
 - And, finally, if you decide you want to buy a home in Northern Colorado (or be referred to another agent in another real estate market), I hope you’ll consider calling me to give me the honor to represent you in the purchase or sale of your property as a real estate broker.
- If you use me to buy or sell a home (or allow me to refer you to another agent in another market and get paid a referral fee), I will rebate any fees you paid to get a Premium plan.
- If you do decide to buy or sell a property with me, you will also get access to my $6,000 lease, lease-option and related leasing documents plus access to the special classes we taught that go over the lease and lease-option paperwork.
- And, finally, my clients also get access to our special asset protection class recordings; anyone can attend when we do them live, but the recordings of the two asset protection classes are only available to clients.
Model Your Personal Situation: Additional Basic Scenarios
These are some additional Scenarios that you may want to copy to your Planner™ and adjust to match your personal situation. These will work in Premium plan.
- Saving 10%/mo in Stocks and 4 Nomads with 5% Down Payment and 10% Property Manager
- Saving 10%/mo in Stocks, You Rent, Buy 1 20% Down Payment as Rental
- Saving 10%/mo in Stocks, You Rent, Buy 10 20% Down Payment as Rentals
- Starting with $100K, Saving 10%/mo in Stocks and 4 Nomads with 5% Down Payment
- Saving 10% in Stocks, 11 Nomads with 5% Down Payment – 10 Rentals and Your Owner Occupant
Model Your Personal Situation: More Sophisticated Scenarios
These are more sophisticated Scenarios that you may want to copy to your Planner™ to model your personal situation. These require a Premium plan like a Premium plan.
- Saving 10% in Stocks, 4 Nomads, $400/mo Side Hustle For The First 5 Years
- Saving 10%/mo in 60% Stocks/40% Bonds (Rebalanced Monthly) and 4 Nomads with 5% Down Payment
- Saving 10%/mo in Stocks and 4 Nomads with 5% Down Payment, Pay Down Mortgages ASAP
- Saving 10%/mo in Stocks and 4 Nomads with 5% Down, Two Roommates at $600/mo Each for First 3 Years
- Saving 10%/mo in Stocks and 4 Nomads with 5% Down, $1,400/mo in Social Security Starting in May, 2030
This Scenario
Scenario into my Real Estate Financial Planner™ Software
If you believe this is an error and should be available to copy, please contact support and include a link to this page.
Model Your Personal Situation: Even More Advanced Scenarios
These are our most advanced and sophisticated Scenarios that you may want to copy to your Planner™ to model your personal situation. These require the highest level Premium plan: the Premium plan.
- 100 Monte Carlo runs: Saving $100/mo in Stocks, Stock Market Return Variable
- 100 Monte Carlo runs: Saving 10%/mo in Stocks, Stock Market Return Variable
- 100 Monte Carlo runs: Saving 10%/mo in Stocks, Buy Owner Occupant Property with 5% Down, Stock Market and Real Estate Returns Variable
- 100 Monte Carlo runs: Saving 10%/mo in Stocks, 2 Nomads with 5% Down, Stock Market and Real Estate Returns Variable
This Scenario
Scenario into my Real Estate Financial Planner™ Software
If you believe this is an error and should be available to copy, please contact support and include a link to this page.