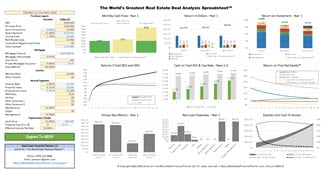
The 
 Scenario Chart for the Inflation Rate shows you what the inflation rate is for the Scenario.
For many of the basic real estate financial planning models and podcast episodes that we do, we use a static Inflation Rate for the entire Scenario
However, I don’t believe this is the best way to do it.
Whenever possible, I strongly suggest using Alternate Universe Modeling™ (aka  Monte Carlo
For example, when we apply the  Add Market Variability to a Scenario
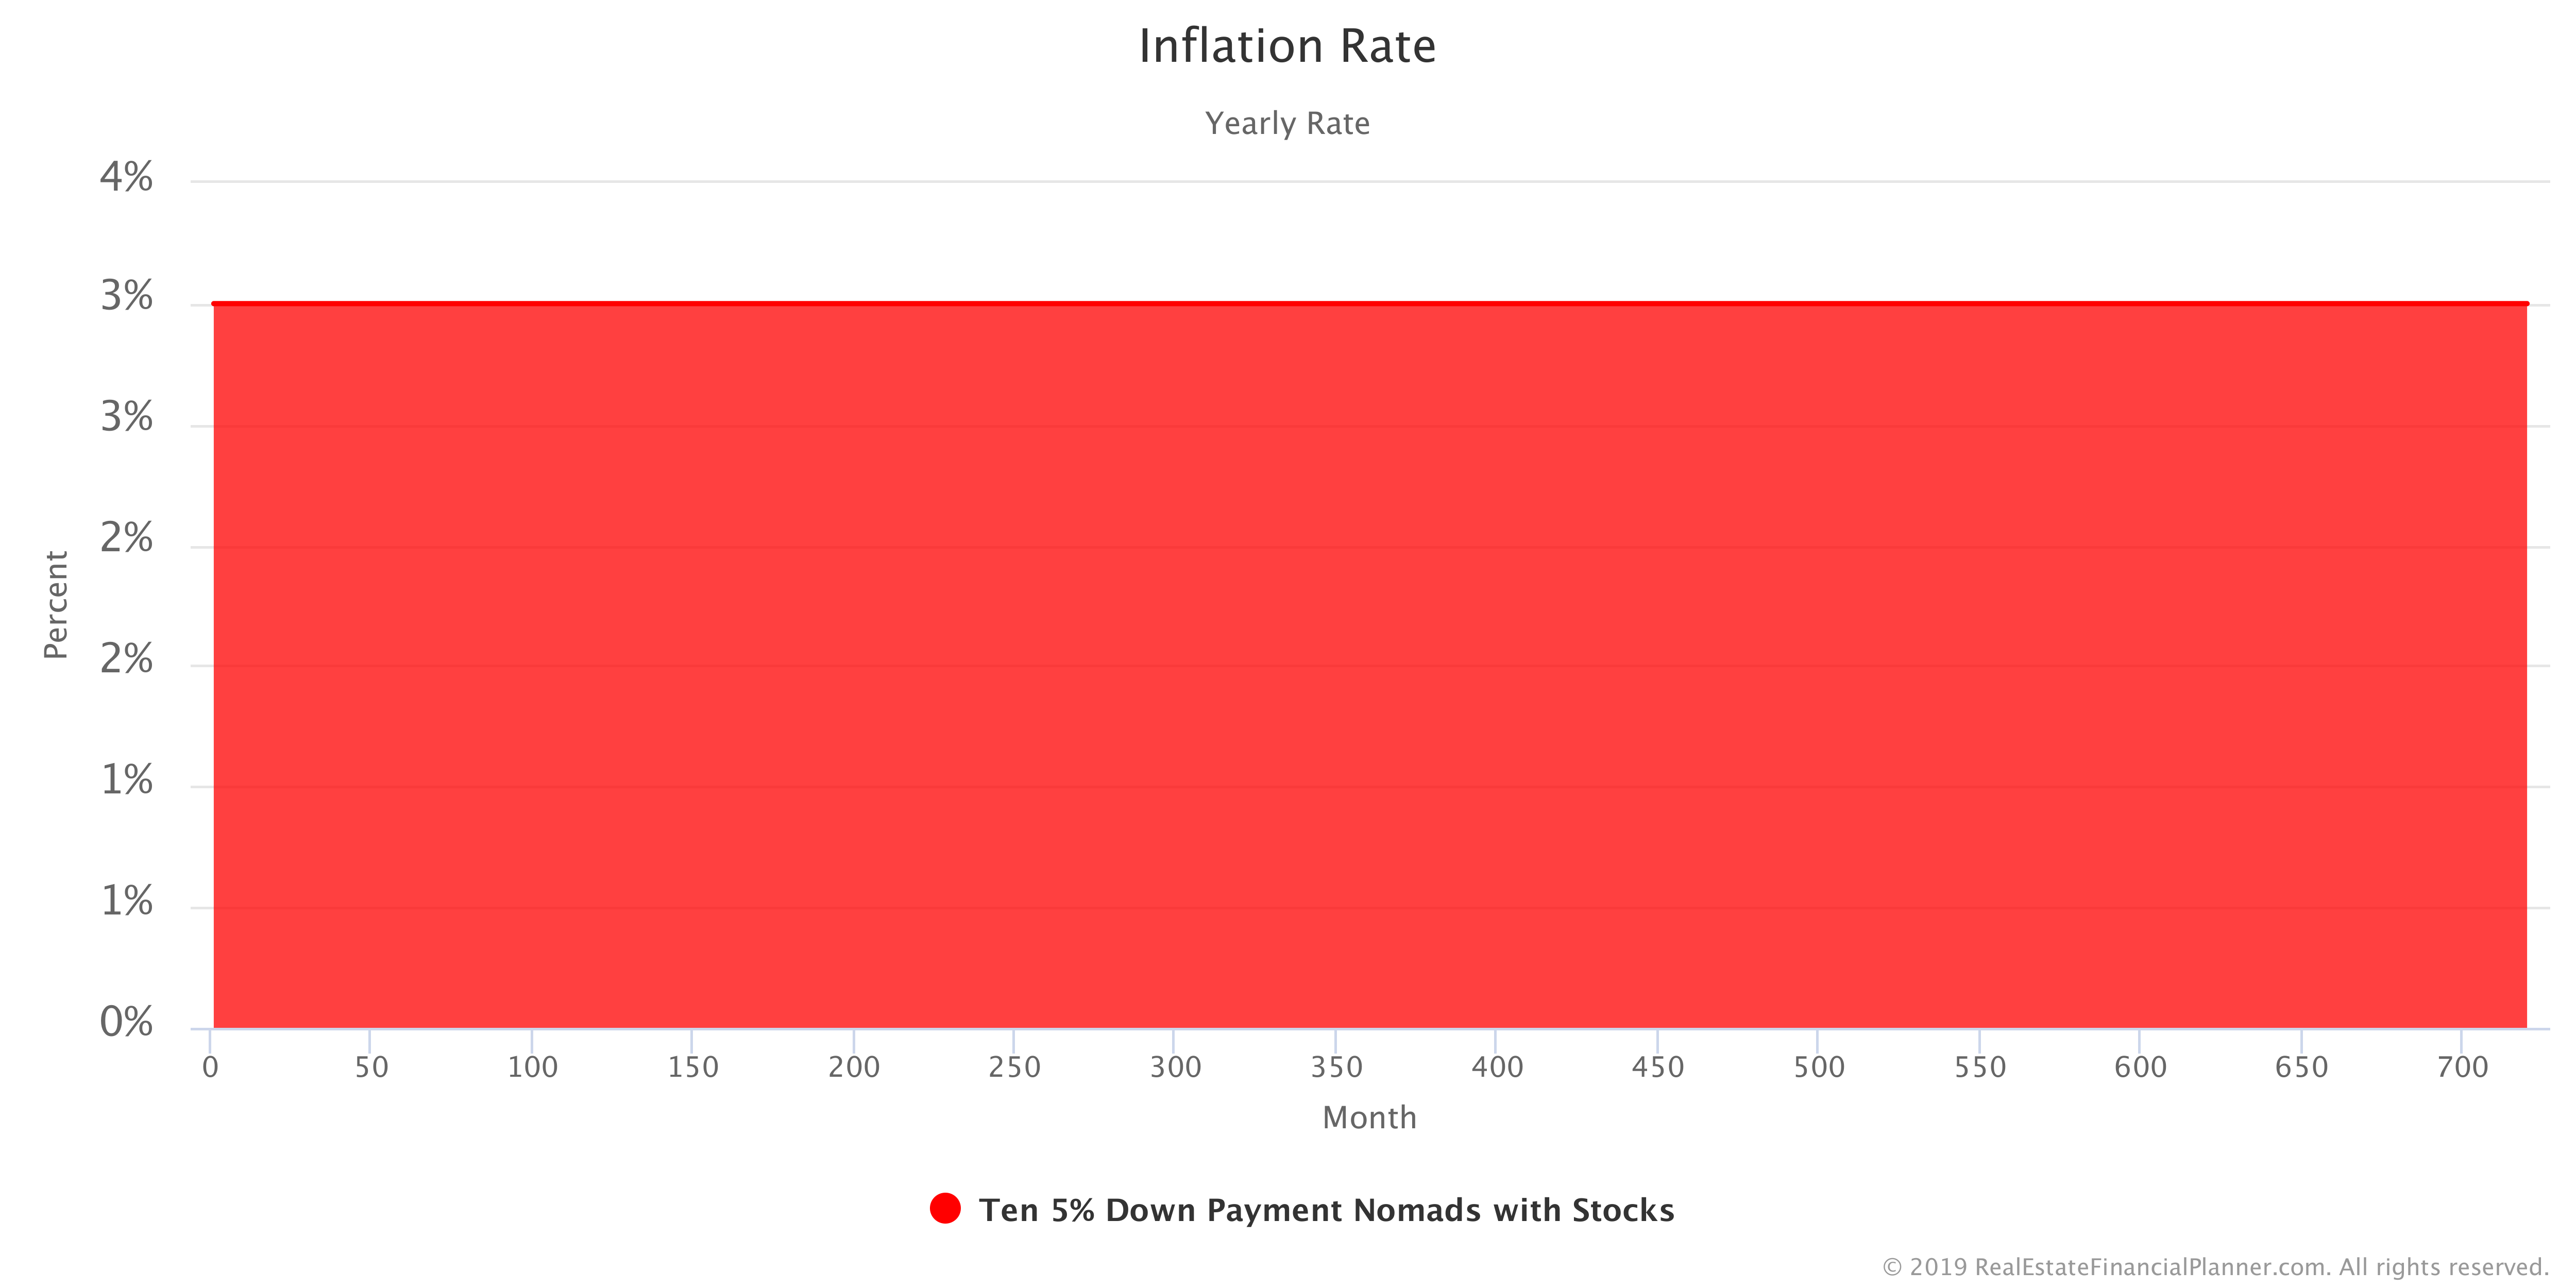
Typically, we make it range from -3% per year to 9% with an average of 3%. About 2/3 of the values (1 standard deviation) will be between 1% and 5% using a  Set Value On Scenarios
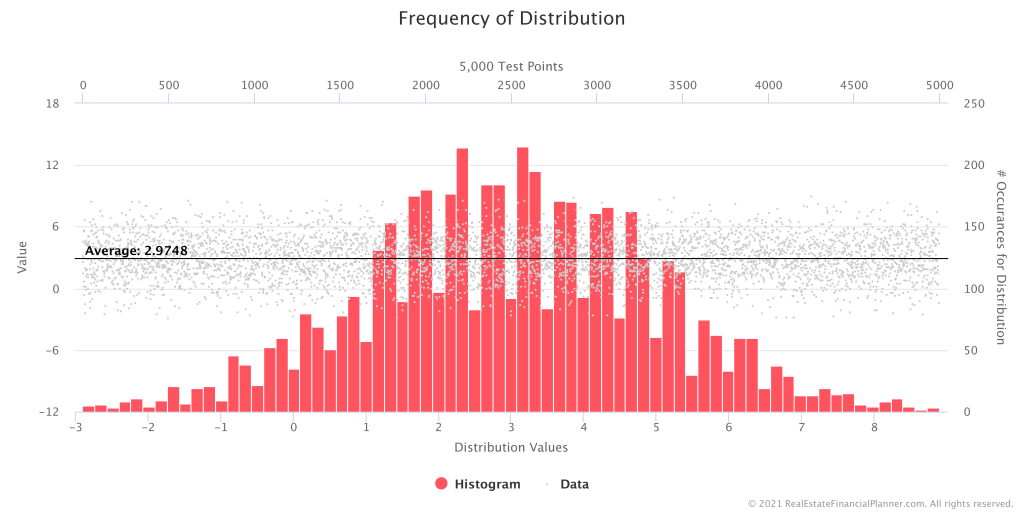
This variability for a single run might make inflation range like the following.
When running 100 times using Monte Carlo Chart
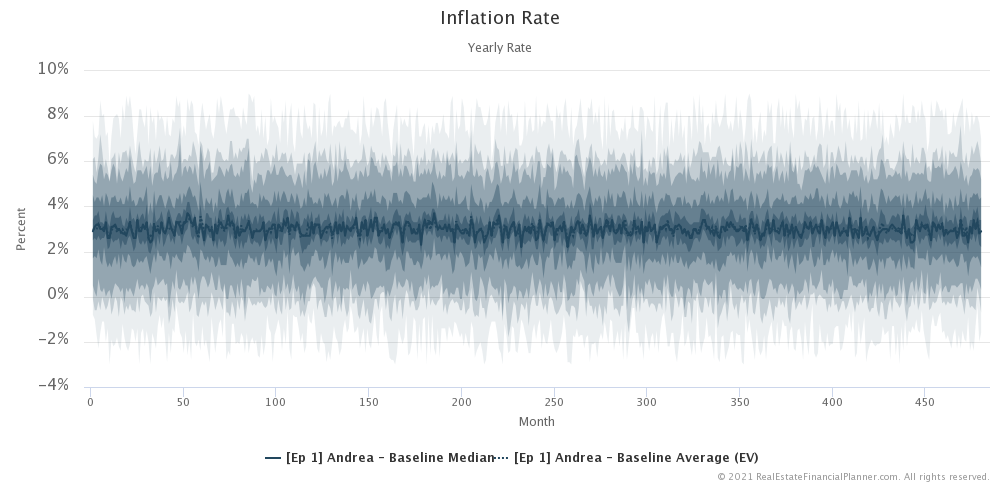
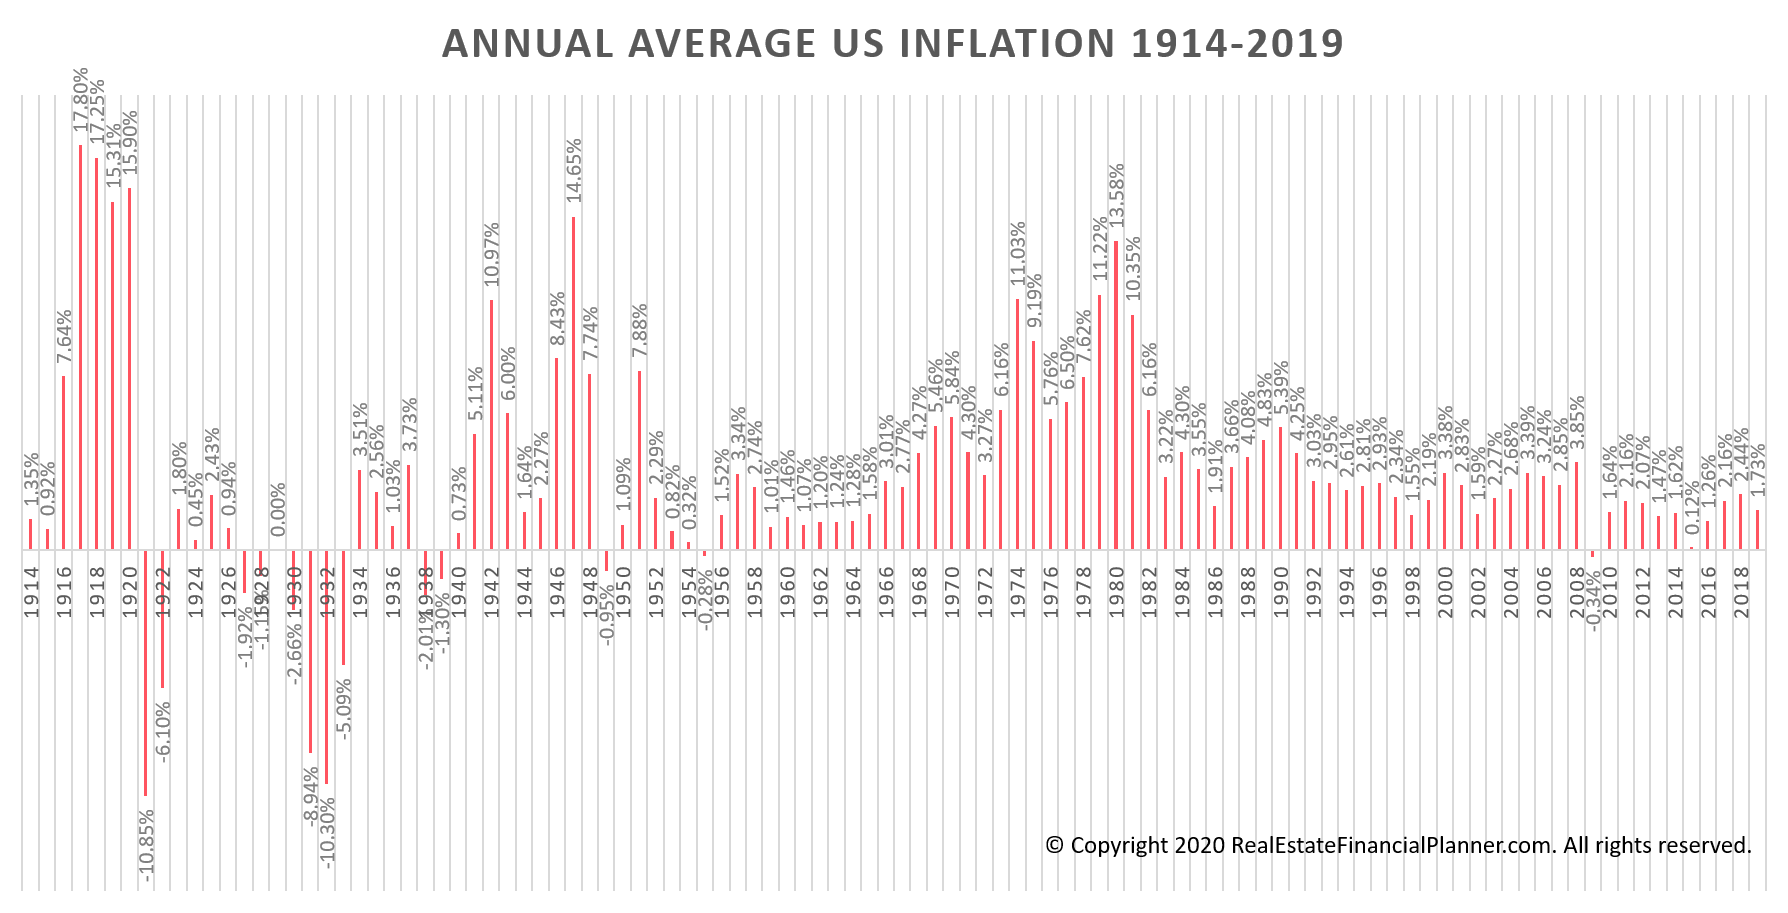
US Target Inflation Rate
Historically, from 1914 through 2019, the United States has averaged 3.23% per year. The median for the same period has been 2.59% per year and the geometric mean has been 3.12%.
According the Federal Reserve, the United States targets a 2% per year inflation rate as of January 2012. Here’s how they’ve actually performed during since they stated their target.

How do you think we’ve done? Considering how difficult it is to accurately control inflation, I find they’ve done a remarkably good job.
Recommended Inflation Rate for Real Estate Financial Modeling
However, James will typically use 3% for the Inflation Rate when modeling his Scenarios
Why? Because hitting a target rate of 2% is difficult to do. Even given what happened in the past.
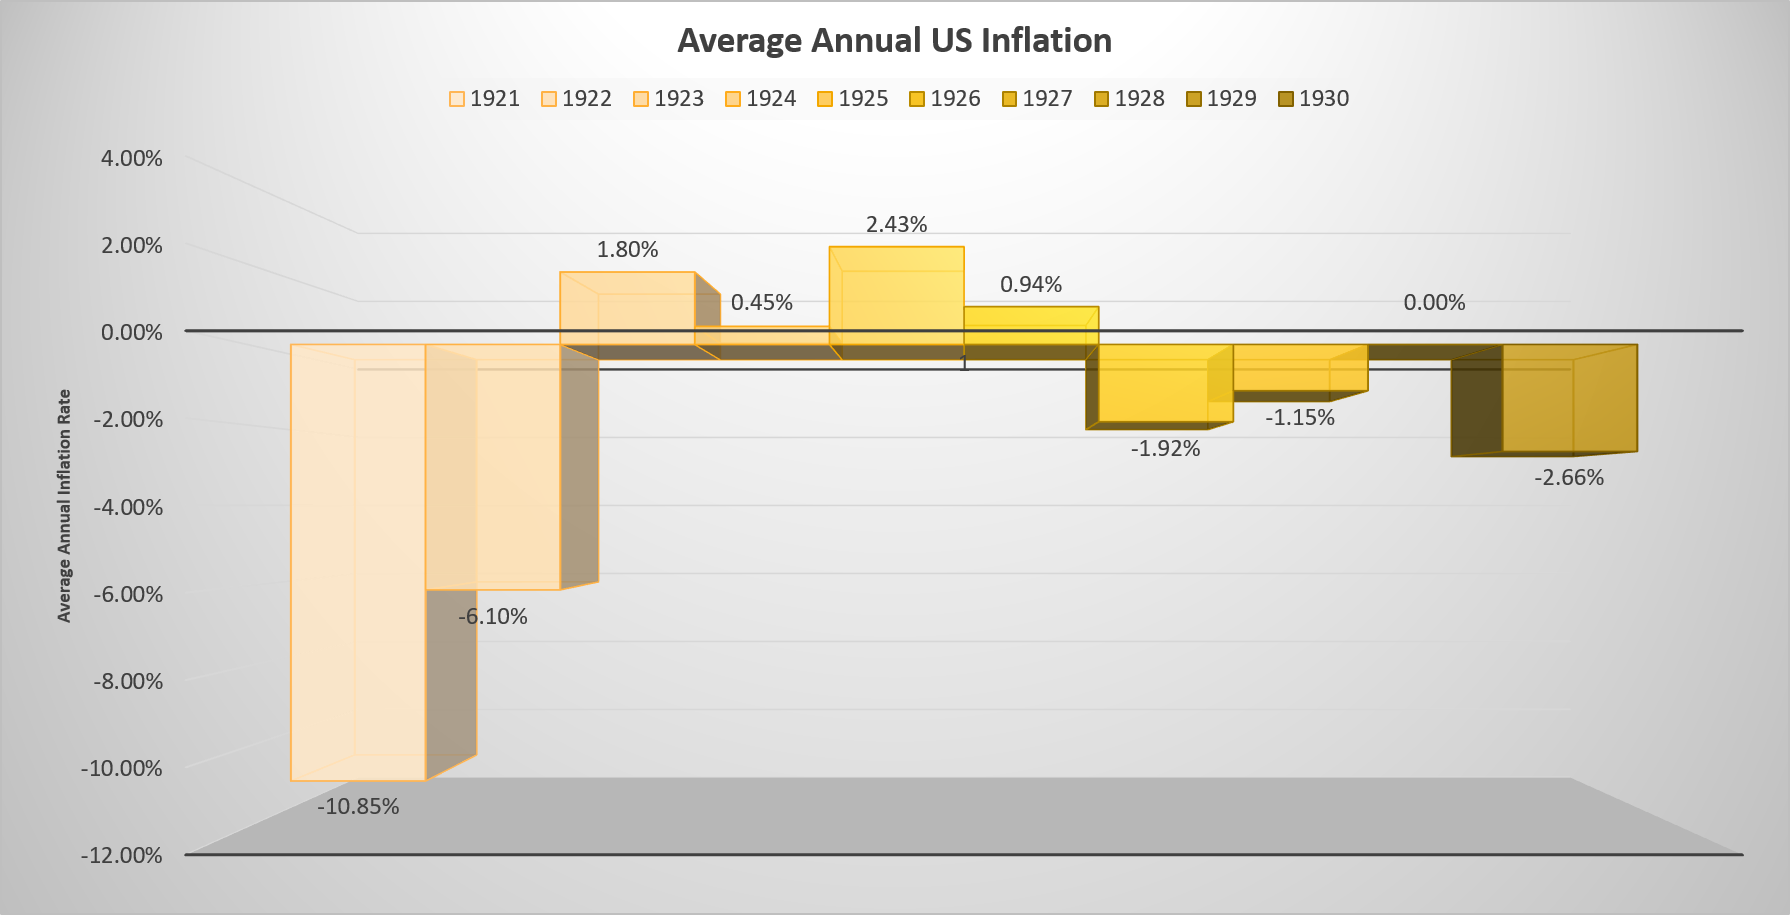
For example, here’s the inflation the US saw between 1914 and 1920.

Try to predict what inflation would be the next decade. What do you think? Here’s what it actually was.
In an ideal world, you’d model your entire strategy using a range of Inflation Rates to see the impact deflation, reasonable inflation and hyper-inflation has on your plan.
Impact of Inflation
I taught a class about the impact of inflation on real estate portfolios: