If you’re interested in learning more about low ball offers then you’ve found the right place with The Ultimate Guide to Low Ball Offers for Real Estate Investors.
Wondering how to make an offer on a house as a real estate investor? Should make an offer lower than the price that is listed in the MLS? After you read this guide you will be better prepared to answer that question than 99.9% of all buyers ever.
I can say this with confidence because I will be sharing with you real-world, hard data on low ball offers. Both data in aggregate to give you an idea of what the odds are of you getting a below-asking-price-offer accepted. But that’s not enough. I will also show you info about the properties that were purchased with low ball offers. Who knows… you may decide the properties you can buy with low-ball offers, might not be the ones you want after all.
Ultimately, you will need to decide if making a below list price offer is right for you and your real estate investing strategy. I will show you the math of how low ball offers impact your returns for a variety of real estate investing strategies like fix and flips, buy and holds, BRRR and Nomad™ to help you make that decision as well.
Table of Contents
- What is a low ball offer?
- What to offer on a house
- The fallacy of “it can’t hurt to ask”
- How to deal with a low ball offer when you’re the seller
- Nomad™ and low ball offers
- Class Recording on Low Ball Offers
- Low ball offer case studies
- Conclusion
What is a low ball offer?
The real estate investing world is full of pithy expressions like “never pay full price”, “always ask for a discount” and “offer 70% of the after-repair-value minus the cost of repairs”. But how practical are those sayings in the real world of real estate investing?
There are investors who refuse to buy something they haven’t purchased by coming in low on asking price. There are also investors that have purchased properties with offers well above asking price where the property was still an amazing deal.
For the sake of this guide, we will consider a low-ball offer any offer than is significantly below asking price.
The definition itself is problematic though. What is “significant”?
Let’s dig into some data to see what might be a significant discount from list price.
Sold Price/List Price
To dig into the data, we should start by defining the data that we will be digging into. The metric I will be using is going to be the ratio of the sold price of a property divided by the list price:
A property that is listed for $300,000 and sells for $300,000 would have a sold price/list price of 100.00%.
A property that is listed for $300,000 but sells for $270,000 would have a sold price/list price of 90.00%.
If people are bidding properties up above the asking price and paying $330,000 for a property that was listed for $300,000, the sold price/list price on that property would be 110.00%.
List Price Isn’t Value
Before we go too far down this rabbit hold, you should know that: list price does not mean the value of the property.
You should be able to easily see this with a brief reflection about an unreasonable seller. The unreasonable seller, having heard about how much their neighborhood properties have been selling for and falsely believing their property is located on a superior lot, with superior views and in superior condition, believes that their property should be worth at least $50,000 more than the highest recent sale.
The unreasonable seller interviews a couple experienced real estate brokers who all conclude the seller is unreasonable with their desired sale price. The brokers and the seller do not come to an agreement for representation. Eventually though, the unreasonable seller happens to find a brand-new real estate broker fresh out of real estate school and hungry to do their first deal. The new real estate broker figures it is better to have an over-priced listing than no listings at all. So, they agree to list the property for $50,000 more than they believe it is worth.
Now, a hypothetical:
Let’s say this was a property worth $100,000 and they listed it for $50,000 above the true value at $150,000. If green-horn, naive real estate investor comes in, makes an offer for 70% of the list price and buys the property for $105,000 (70% of the overpriced $150,000), they still over-paid for the property by $5,000. If they figured I am making an offer at 70% of list price so I feel comfortable waiving my right to an appraisal and paid cash for the property (which does not require an appraisal) they would have no second-check on their value by an appraiser.
Can you see now that list price does not necessarily mean that’s the true value of the property?
It works the other was as well. Sometimes a seller list their property at a price that is below the current fair market value of the property. Sometimes they do this intentionally as they know the property needs work and they estimate the work that is required is a large dollar amount. It is possible that the seller’s estimate of the amount of work and the cost to do that work is different than the amount of work and the cost to a real estate investor that can get work done a fraction of retail prices.
Not Sold Price/Value
So, now that you realize that list price does not equal the value of the property, please do remember that as we discuss sold price/list price, we are not discussing sold price/value.
If you’re wondering why I don’t discuss sold price to value, it opens up an entire discussion on what value is and how hard it is to really determine value—especially on a large data set of properties. If you’ve ever experienced a property value on an automated valuation website like Zillow.com, Trulia.com or Realtor.com that you knew was not accurate and you can see how even companies that are well funded and working very hard at solving this problem of providing automated valuations struggle to solve this problem. I should probably write an entire guide on automated real estate valuations, but that won’t be here. It is incredibly difficult to know the true value of a property so it would be very difficult for me to analyze sold price/value.
Furthermore, some would argue that the price a “willing and able buyer” would pay to a “willing and able seller” in an arm’s length transaction is the true value of the property. Sellers don’t typically give away their equity. They trade it for solutions to problems… usually either problems with the property (condition, location, repairs required, terms) or problems with the seller (job transfer, promotion or job loss, marriage or divorce, etc).
With that logic, if a property is being sold for a discount from list price, the price that the seller is paying is the then true value of the property. The new owner may change the characteristics of the property through adding value to the property (maybe through repairs, or improved financing) or maybe by the new owner having a different personal situation (not being transferred, still having a stable job, not living in the property, not getting married or divorced, etc). Changes to the property or owner’s situation may then change the value of the property.
Sold Price is NOT the Same as Offer Price
Ultimately, we’re really looking to take away lessons about being able to make low ball offers on properties as real estate investors. However, the data I am about to show you is sold price. Sold price is not the same as offer price.
Offer price is not publicly available (at least in our real estate market) because agents don’t publish the offer the seller accepted. As a seller, I would not automatically want a potential backup buyer to know the offer price and terms I accepted previously. That might encourage them to make a lower offer if the property fell out of contract and the new buyer knew what was accepted previously.
Further, if the property fell out of contract, the old price and terms may no longer even be relevant. What if the seller did work based on what the buyer who ultimately terminated objected to. Or, what if the terminating buyer’s inspector did not find quite the extent of damage/work the seller thought would need to be done on the property. A seller may have a very different perspective on property price from real working being or perceived work that needs to be done.
There are other reasons why sold price may not have been offer price.
First, imagine a situation where the buyer made a full price offer on a property. But, during the inspection period it is discovered that there is $15,000 worth of work that needs to be done to the property (maybe a roof is unacceptable, termite damage and high levels of radon gas). Instead of doing the work and keeping the full price offer, the buyer and seller agree that the buyer will purchase the property as-is with the needed repairs and reduce the price by $15,000.
In that case, even though the offer was made for full price, it would show up in our sold price/list price ratio as having a $15,000 discount.
Here’s another example where the initial offer to purchase was for full price but it would show up in the sold price/list price as less than 100%.
Buyer is under contract for full price, but the appraisal comes back and the property does not appraise for full price. In fact, the property appraised for $6,000 below the contract price. The buyer and seller negotiate and agree to split the difference with the seller coming down in price by $3,000.
Again, in this situation, what was a full price offer is now showing up as having sold for a small discount (less than 100% in the sold price/list price data).
In hot real estate markets (with multiple offers), these types of adjustments happen less. That’s because buyers in hot markets will often consider waiving (or at least voluntarily weakening) their inspection and appraisal rights to get offers accepted. The thought is that there are other buyers who would buy it if this buyer doesn’t.
However, in softer real estate markets, there is often more room for negotiating on inspection and more flexibility should properties not appraise. The thinking is that it may take another 3 months to find the next buyer, let’s see if we can come to an agreement with the current buyer and not let them walk away.
To further complicate the discussion on sold price to list price, there are some real estate agents who will adjust the list price after an offer is accepted. It is not a super common occurrence, but I have definitely seen it happen. I’ve seen it when a property has been bid up and there is an offer accepted above asking price.
For example, let’s say a property was listed for $300,000. However, the market is scorching hot and in the first day of being listed there were 10 offers on the property with 8 of them above asking price. And, for those of you who have never seen this, it does happen. The offer they accept is for $310,000. The agent representing the seller starts to wonder if they listed it too low (they didn’t but that’s a discussion for another epic blog post). After talking with their seller, the seller and agent agree that just in case it falls out of contract, they want to get at least $310K the next time. They had 10 offers after all. Why not make the new listing price $310K in case someone wants to make a backup offer.
Plus, as the thinking might go, the appraiser may just look at the list price and be influenced by the sale price matching the list price. Most appraisers won’t be influenced by such silliness, but I digress.
So, what just happened? A property that originally would have shown up in our list as being over 100% on the sold price to list price ratio is now showing up as just 100%.
Ready for another curveball? What happens if while the property is under contract for the $310,000… the buyer and seller negotiate a small discount for something… a small repair, an appraisal issue, change of closing date that benefits the seller, etc. In this case, the property that originally was bid up $10,000 from $300,000 to $310,000 but then had their price changed to match the $310,000 offer and then had a small price negotiation down is showing as having a sold price to list price as less than 100%—that it sold as a discount from list price. This is even though it really sold for above asking price.
Again, these are very rare, but I want you to be aware of how wacky some of this stuff is. In case you think I’m making this stuff up. Here are three examples from our local MLS.
This first example is a property that increased its list price once it went under contract (from “Active” to “Active/Backup”) then closed for even higher than it raised the list price. This would show up as over 100% in the data of sold price to list price.
This example is a property that also increased its list price once it went under contract (from “Active” to “Active/Backup”). The agent did the update in two steps… on the same day. Then the property closed for the new, higher list price. This would show up as 100% in the data of sold price to list price even thought it should have been an above 100% sold price to list price data point.
And the third example, the property went under contract and raised the list price from $325,000 to $365,000. Then, by the time it actually closed, it sold for below the new, higher list price. This would show up as a below 100% ratio of sold price to list price even though it still sold for more than 10% above the original list price.
I’ve warned you about some of the data issues we’re likely facing, but these are all relatively uncommon cases. Now, let’s look at some data.
Historical Average Sold Price/List Price
What does the average property sell for as a percentage of list price? I’ll use my local market as an example because I happen to know it and have the data for it. Your local real estate market might be very different or it might be very similar. That will depend largely on your local real estate market conditions.
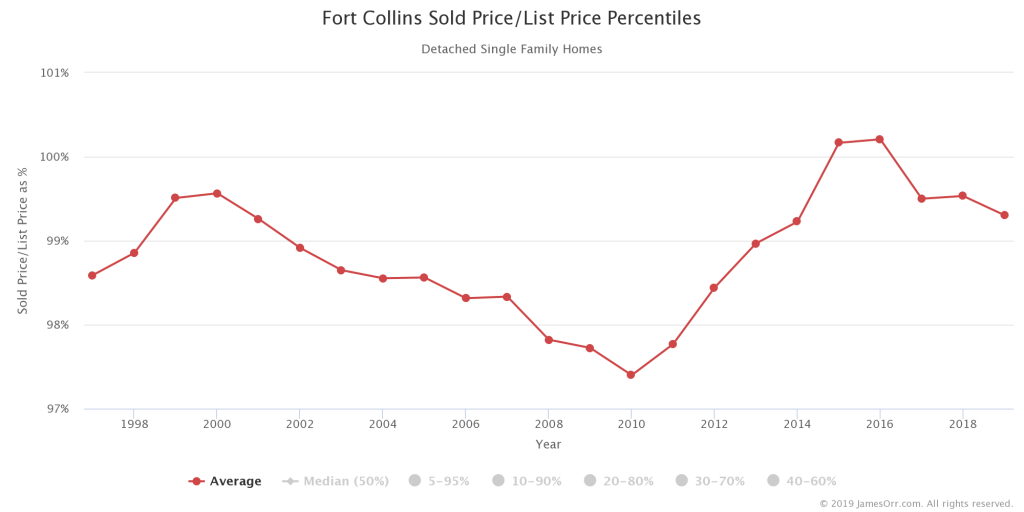
Each data point on this chart is the average sold price to list price for all one unit detached properties (think single family homes) with all bedroom configurations in that city for that year. I’ll talk about the impact of seasonality on making low ball offers in a bit.
I go back to the start of when I have data, 1997, and go through the last full year of data that I had when I sat down to write this, 2018.
In this historical view, you see a strong market leading up to 1999 then a steady softening and decline as we bottom out around 2010. Then, from 2010 through 2016 you see us enter a hot, seller’s market and a small softening into 2018.
So, what I am going to suggest for evaluating low ball offers is that we look at 2010 (the softest real estate market with the biggest average discount from list price) and the craziness that was 2016 with the biggest premium over list price.
Just from this chart though, I want to point out that even during the worst real estate market of our lifetime… the great recession… the average discount people were seeing in this market for the entire year was just over 2.6% with a sold price to list price ratio of 97.4%.
Pause for dramatic effect.
On average, if you were buying a $300,000 property, you were able to “low ball” them for $292,290. That would be a “savings” of $7,800. If you think about that in terms of buying a rental property, you might want to consider how much financing $7,800 more might look like. If you were able to get 4% interest rates on a investor or Nomad™ loan, that’s a savings of about $37 per month in financing costs (ignoring that fact that you’re really likely only financing 80% of that if you’re putting 20% down).
This is a problem with averages though. Because, we’re not really concerned with averages. We want to know what kind of low ball offer deals people were getting accepted. For that, we’d need to dig in a little deeper.
But before I start digging a little deeper, I did want to mention I ran this same chart for other cities near me and they’re similar. Even the city in the county with the most foreclosures of our entire state during the great recession as only at about 1% larger discount from list price on average (approximately 97% versus 96% in 2008).
Average Discount versus Median Discount
The chart above shows the average discount (sold price/list price). To get the average you add up all the discounts and divide by the number of data points.
The chart below shows the median discount (sold price/list price). To get the median you sort all the discounts from smallest to largest. Then, you select the middle most one. It is the one where you have half of the discounts above that number and half of the discounts below that number.
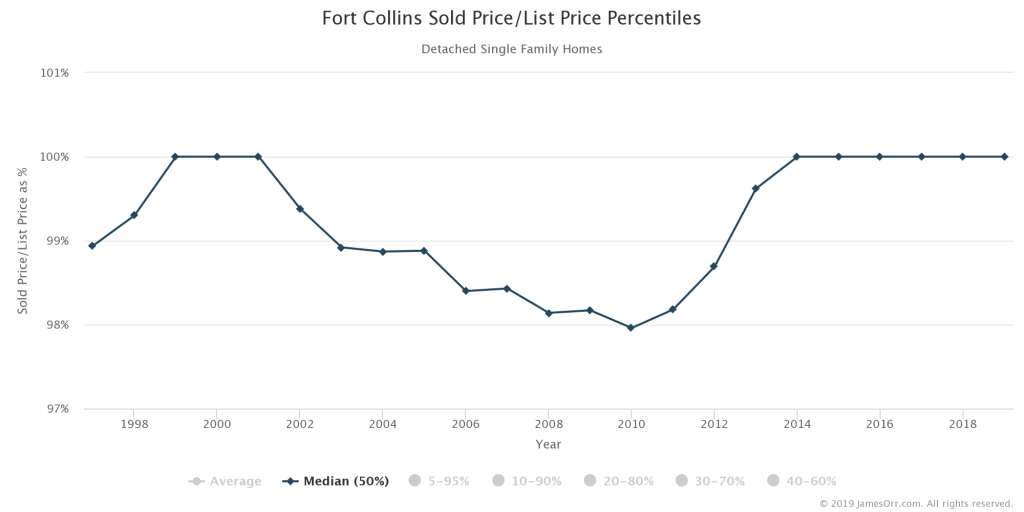
One thing to note about median is that we have several years (1999-2001 and 2014 through the time of this writing, 2019) where the median is a full price offer. That means, in those years, the middle most offer is a full price offer.
If we compare both the average and the median on the same chart, you can see the difference between the two.
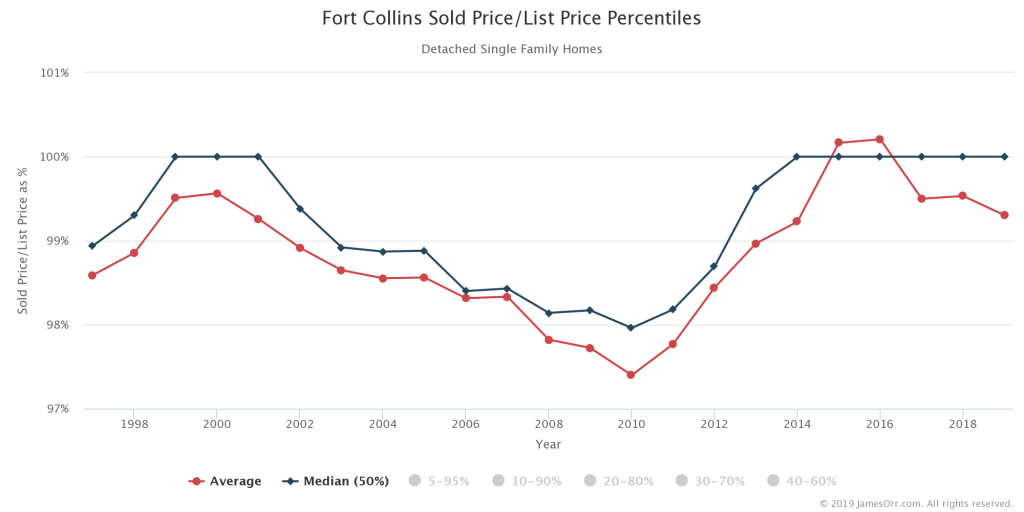
By looking at the average and median sold price to list price, we can get a feel for the middle of the data. But really, as real estate investors looking to make low ball offers, we’re more concerned about what is possible on the low-ball end of things.
So, what if look at what the sold price to list price ratio needs to look like to be in the top 5% of the biggest discounts from list price. That would require us to sort all the sales from smallest sold price to list price and figure out what the cutoff is to be in the bottom 5% (the 5th percentile). While we’re at it, we will also look at the top end and see what it takes to be in the top 5% (the 95th percentile).
Here’s a chart showing a band of the 5th percentile and the 95th percentiles.
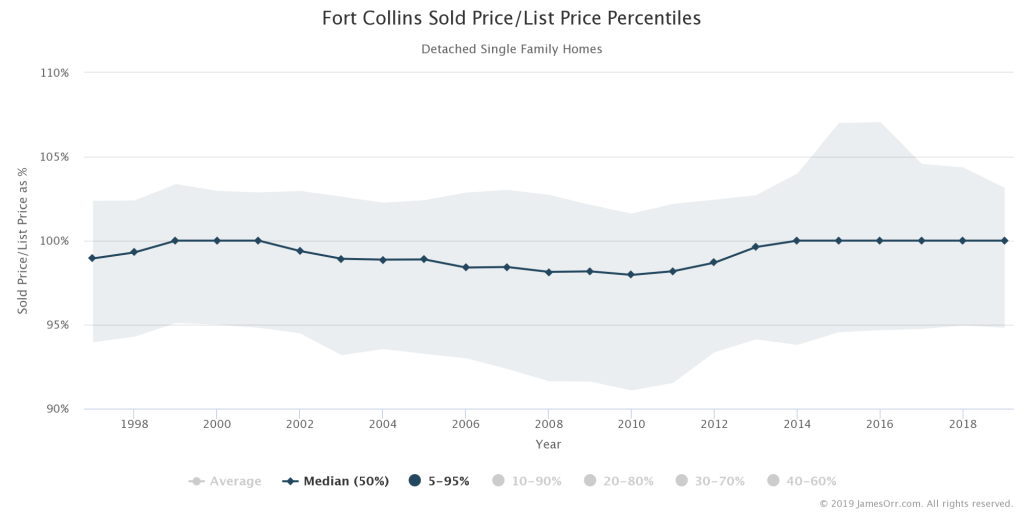
The chart above shows that in 2010, 1 in 20 properties sold for less than 91.08%. That’s almost 9% discount in what was the worst real estate market of our lifetime (around the great recession). In the same year, 1 in 20 properties sold for more than 101.6% of list price. That’s a 1.6% premium above asking price in a really soft real estate market. That’s the same great recession.
The chart also shows that in a really hot market in 2016, 1 in 20 properties sold for 107.06% or greater of list price. That means that 1 in 20 properties sold for more than 7% above asking price. On a $300,000 property, that would mean bidding $21,000 above asking price. 1 in 20 properties! That same hot year, 1 in 20 properties sold for 94.67% of list price. That means that even in a very, very hot market, 1 in 20 properties still sold for more than a 5% discount from list price.
Recent Low Ball Offers
Do you have a good feeling now for some historical data on what you might be able to do 1 time out of 20 with a low ball offer? Well, let’s keep going then.
What if I took every property that sold for the last 12 months and listed them in order from highest sold price to list price to the lowest sold price to list price? It might look like this chart.
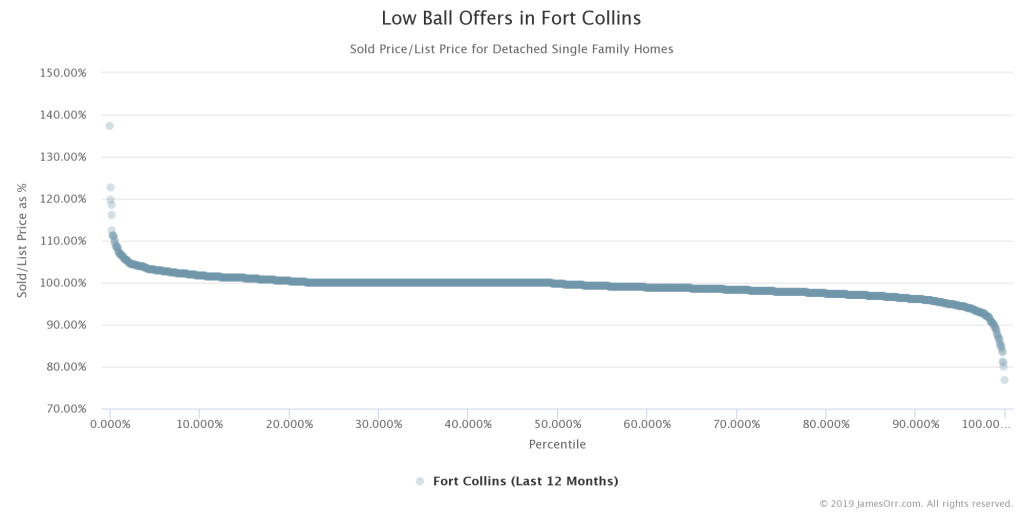
In the chart above you can see each transaction that sold above list price on the left side. They are the dots above 100% of the sold price to list price as percentage.
On the right side of the chart, you can see the transactions where a buyer was successfully able to come in low and purchase the property for below list price.
The large number of dots in the middle at 100% are all the transactions where the property sold for exactly list price.
I am going to focus on the properties that sold for below list price, but before I do that, I did want to show up just the properties that sold for a premium above list price. That’s this chart.
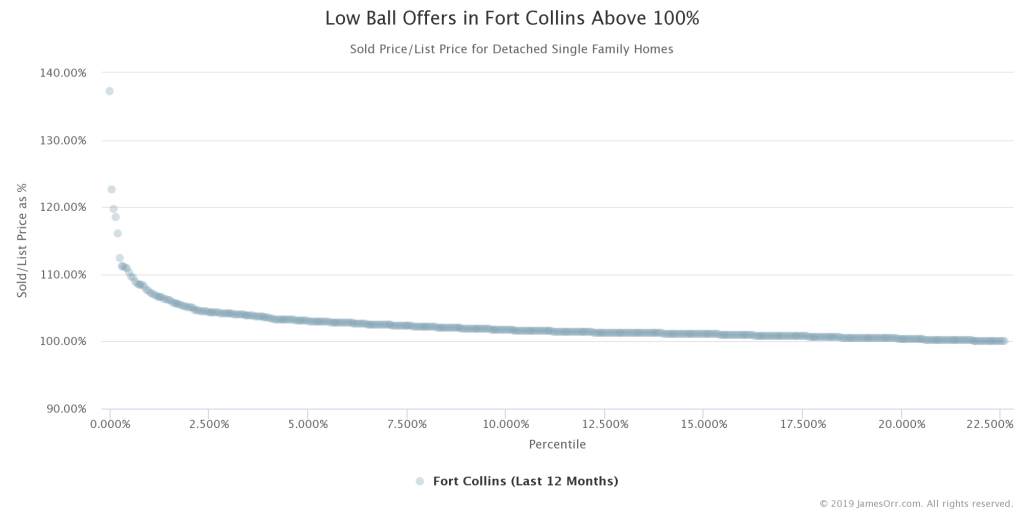
You can see in that chart above that 22.6% of all the transactions sold for above list price. You can see one sold for almost 40% above list price. One sold for over 20% above list price. There were a few that sold between 10% and 20% above list price. Then, there were a whole slew of them at sold between 10% above list and just over list price.
But let’s do the same type of chart for low ball offers that sold for below list price. That’s this chart below.
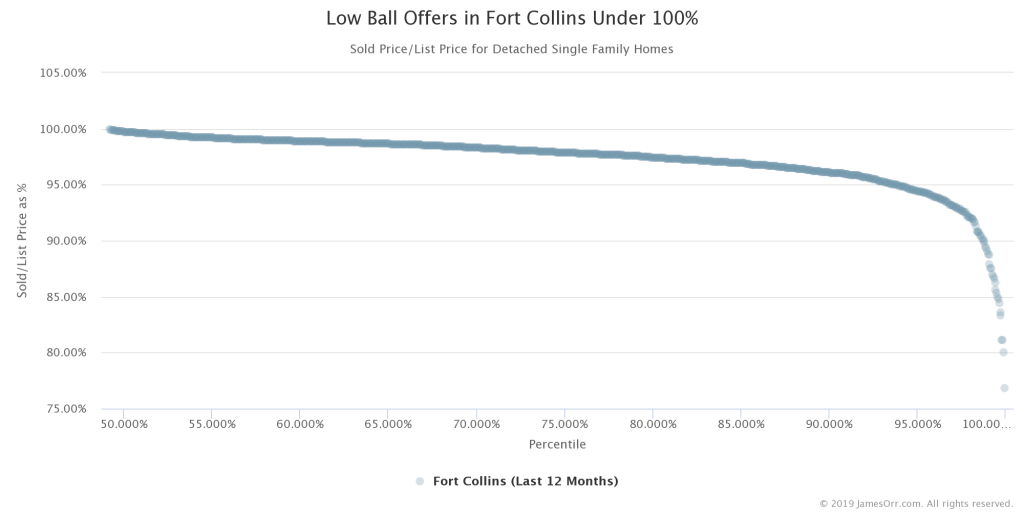
As you can see in the chart above, there are more than half the transactions that sold for below list price. A large number of them for a very small discount.
In fact, let’s zoom in even more and only look at the top 10% of all the transactions that sold for below list price.
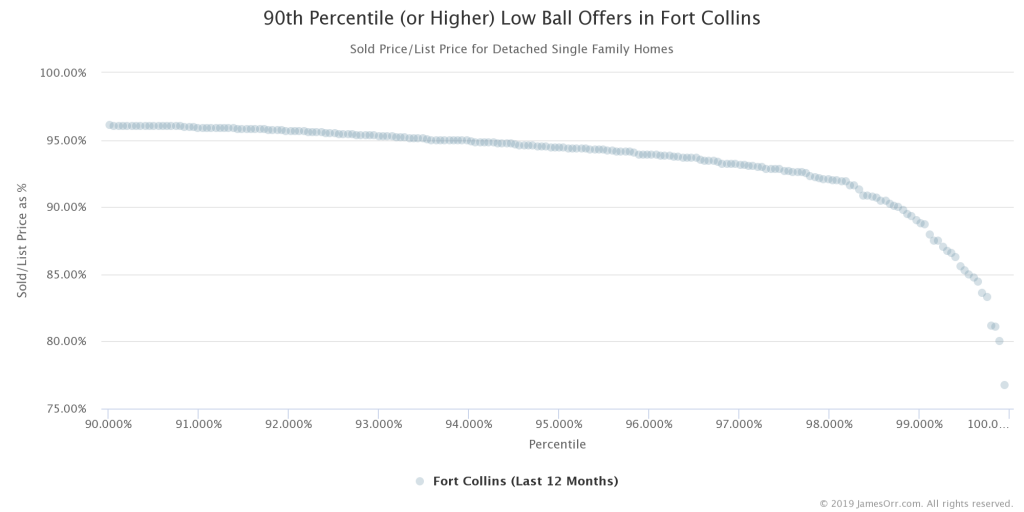
To be in the top 10% of low ball offers, you’re only able to get less than a 5% discount. That means that less than 1 out of 10 of all the transactions that closed got bigger than a 5% discount.
Let’s zoom in more and look at the top 5% of transactions that got the biggest discount from list price. That’s the chart below.
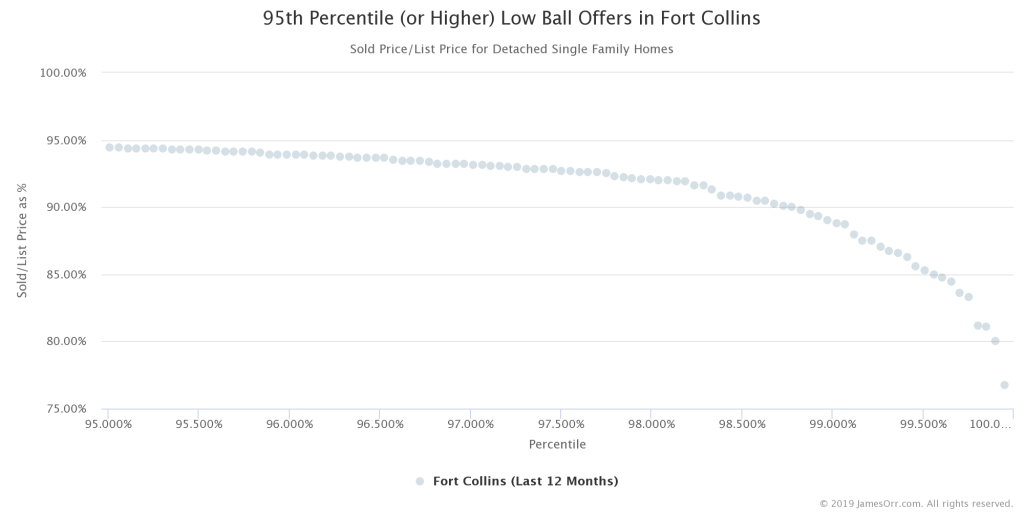
In the chart above, you can see that to be in the top 5% of best low ball offers that closed, you barely broke a 5% discount. That means that only approximately 1 out of 20 offers got a discount bigger than 5% from list price.
What if we zoom in more? Let’s look at the top 1% of all transactions.
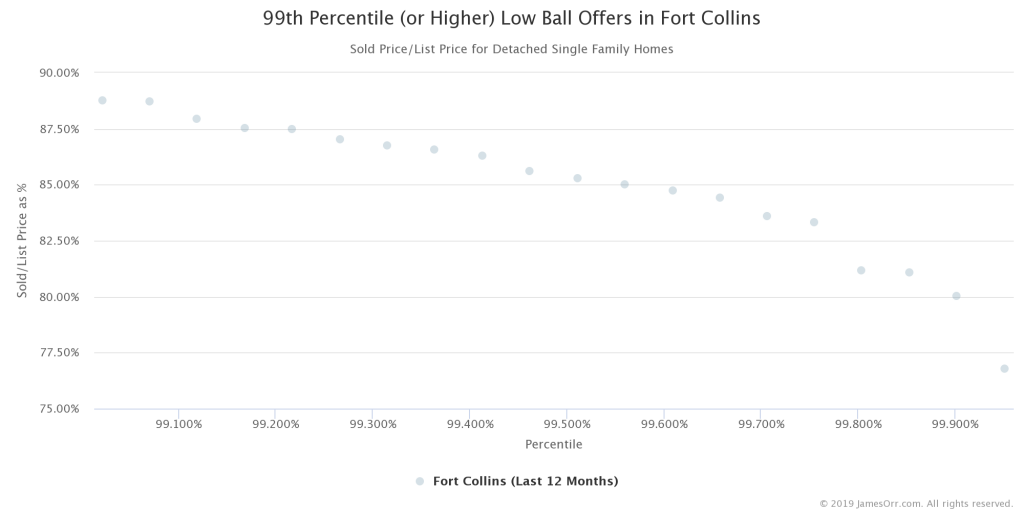
The chart above shows the best 1% of transactions. These are the transactions with the biggest discount from list price.
To make this top 1% list of best low ball offers, you barely broke a 10% discount from list price.
And there’s only a handful of transactions that got a discount greater than 15% from list price.
And there was a single transaction that got a discount bigger than 20%. Just one.
Comparing Recent Hot Market to Coldest Market We’ve Ever Seen
In the previous charts I shared with you the most recent 12 months of sold price to list price data. But we’re coming out of one of the hottest seller’s markets we’ve ever seen. The last 12 months haven’t been the hottest, but it has been pretty hot.
But, how does it compare to the same period in 2009/2010?
Why don’t we take a look?
Comparing 2009/2010 to This Year
Just looking at the chart below comparing the best buyer’s market we’ve ever seen (October 2009 through September 2010) we can see some differences.
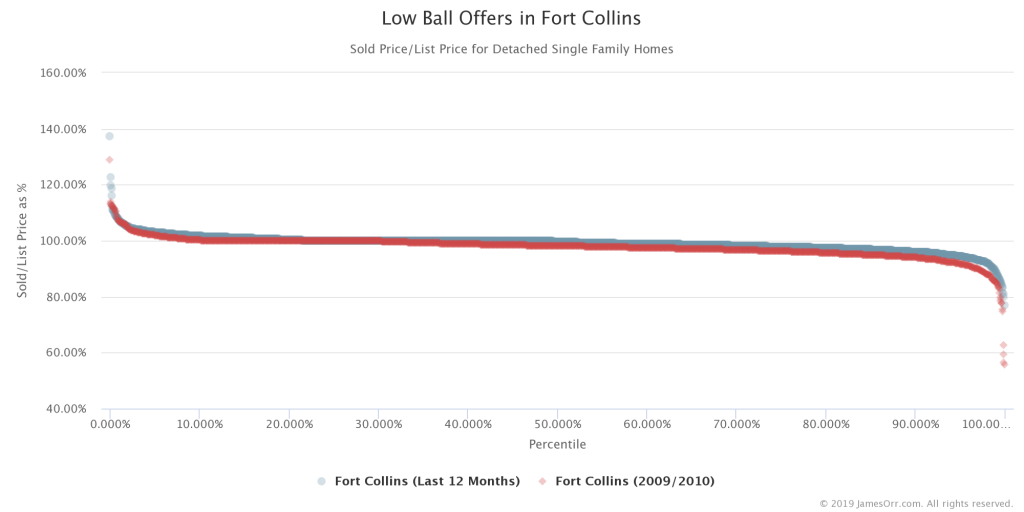
First, there are fewer and lower above asking price offers (the red data points of 2009/2010 are below the blue data points of 2018/2019) for the left-side, above asking price transactions.
Second, there are more and bigger discounts (the red data points of 2009/2010 are below the blue data points of 2019/2019) for the right-side, below asking price transactions.
Let’s zoom in and look at the above asking price transactions for our comparison of the best buyer’s market we’ve ever seen to a strong seller’s market.
Approximately Twice As Many Above Asking Price Offers In Hot Markets
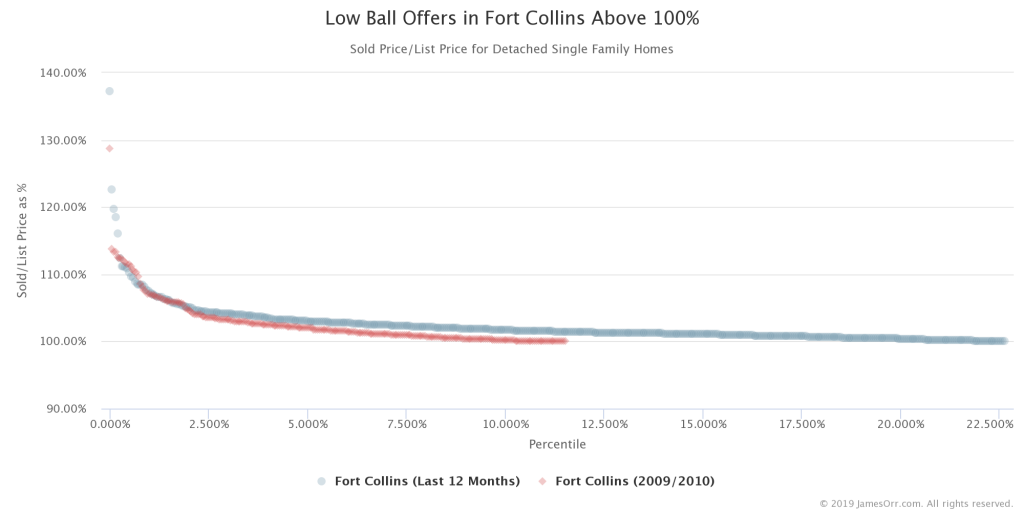
As you can see in the chart above there are quite a few extreme above asking price offers. Most are in the strong seller’s market (2018/2019). Although we do occasionally see some even in the “worst” market we’ve ever (during the great recession).
I believe this shows that there are still highly desirable properties worth making strong offers on even in soft markets.
Only about 11.5% of all the transactions in 2009/2010 closed above the list price (over 100%). Compare that to 22.6% of all transactions in 2018/2019. That’s almost double.
Furthermore, the above asking price offers in the buyer’s market are less extreme (less above asking price) than in a seller’s market. This makes sense… people need to bid up properties in seller’s markets to get offers accepted. The difference between the two though is not that much, maybe 1.5% more. So, people are not needing to bid up properties nearly as much as I would have thought. Having recent memory of the strong seller’s market, I will also point out that the properties for sale already seemed to be pushing price in many cases. So, these premiums are above what seemed like high list prices to me.
But, what about comparing the low-ball, below list price transactions? Let’s look.
More Low Ball Offers and Bigger Discounts
If we look at and compare just the transactions that closed for below list price, you can see there are more of them and they are for bigger discounts.
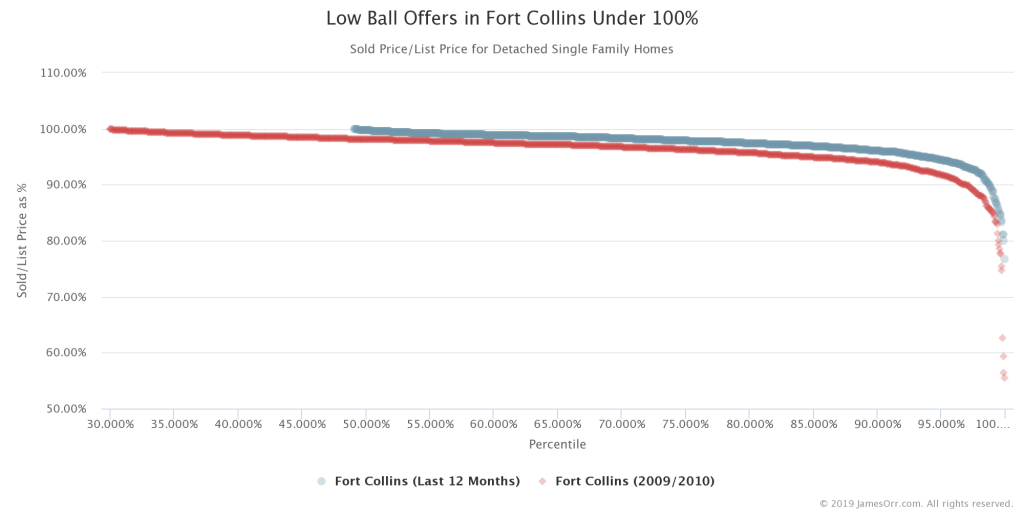
Over 70% of all transactions during 2009/2010 closed below list price. During the seller’s market of 2018/2019, it was just over half of all transactions. That’s almost 40% more transactions closing for below list price.
But it is not just quantity, it is magnitude as well.
The red dots showing transactions in 2009/2010 are all lower than the blue dots showing the more recent, stronger seller’s market. Again, and this is unscientific, but eye-balling the chart, it seems like the difference is about 1% to 1.5%. So, we’re seeing about 1% to 1.5% bigger discounts at the same percentile rank comparing the two time periods.
However, the extremes are even more extreme. Let’s zoom in.
Comparing the “1 in 10” Low Ball Offers
If we look at the top 10% of low ball offers… the 10% of the transactions with the biggest discount from list price for the two periods of time… you can see we’re getting bigger discounts during the great recession.
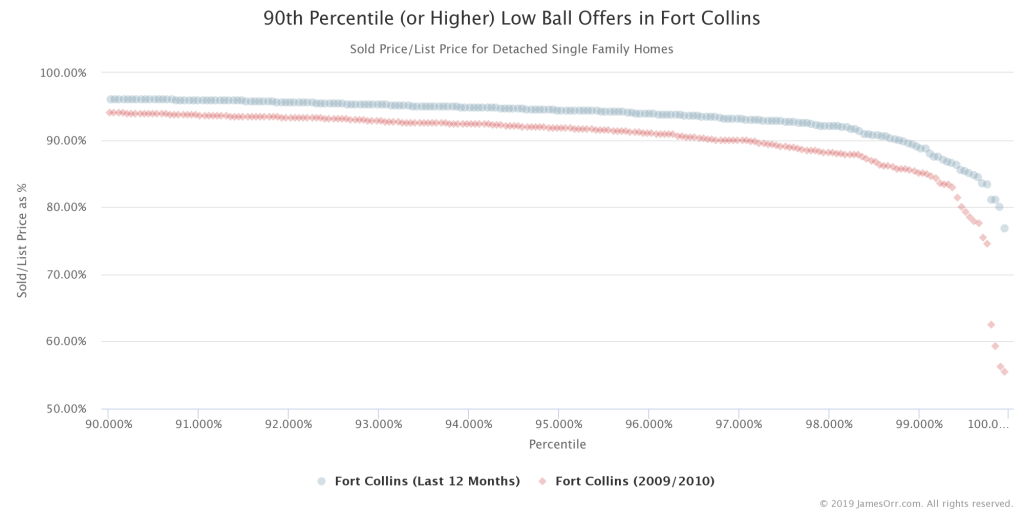
I am a little surprised it is not more of a discount, but the data is what it is.
Let’s look at the 1 offer out of 20 data or the 95th percentiles.
Comparing the “1 in 20” Low Ball Offers
The lowest “low ball” offers, the lowest 5% of sold price to list price is shown in the chart below.
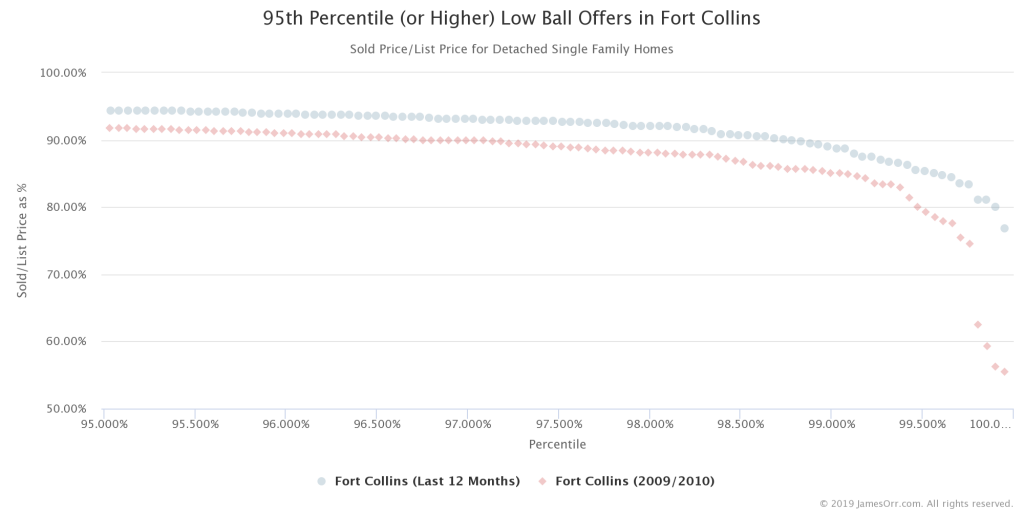
The most interesting part of the chart for me is seeing the most extreme low ball offers. The 4 or so offers that have broken away from the pack during the great recession and are being sold at a huge discount.
The 1% of Low Ball Offers
Here is a chart comparing the best of the best in low ball offers: the 1%.
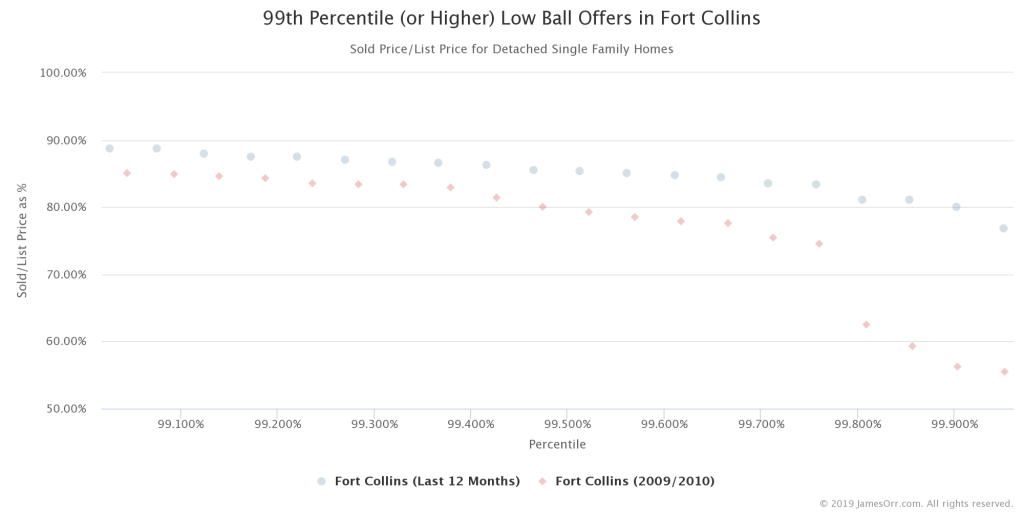
In the last year, we’ve only seen one offer that sold for less than 80% of list price. During the great recession, I wouldn’t call them commonplace, but we did see more than half-a-dozen.
It took the great recession for us to see people able to get a property for 40% or more off of list price.
Just a reminder, that this is not 40% off of the actual value… it might be more or less than that. This is 40% off of the list price.
What to offer on a house
“Past performance is no guarantee of future results.”
You may have read that when investing in stocks, bonds and commodities. Just because the market has done X in the past, does not mean it will do X in the future.
“History doesn’t repeat itself but it often rhymes.” — Mark Twain
Just because some folks in the past were able to buy a house for 5% off list price with 1 out of every 20 offers, it does not mean you can do the same.
Each seller is an individual with unique motivations. Each property is uniquely desirable. Each competing buyer has unique motivations and resources at their disposal.
Sure, we can use previous data to help us establish reasonable expectations for what is likely to happen based on what has happened in the past. But, can it really tell us what we can offer on a specific property? Not really.
There are additional factors that can help you determine whether a low ball offer will be accepted. Time for more data.
Low Ball Offers For Christmas: Seasonality
Turns out, there are better times of the year to be able to get a low-ball offer accepted. Looking at the same sold price to list price broken out month by month, we can see a pattern.
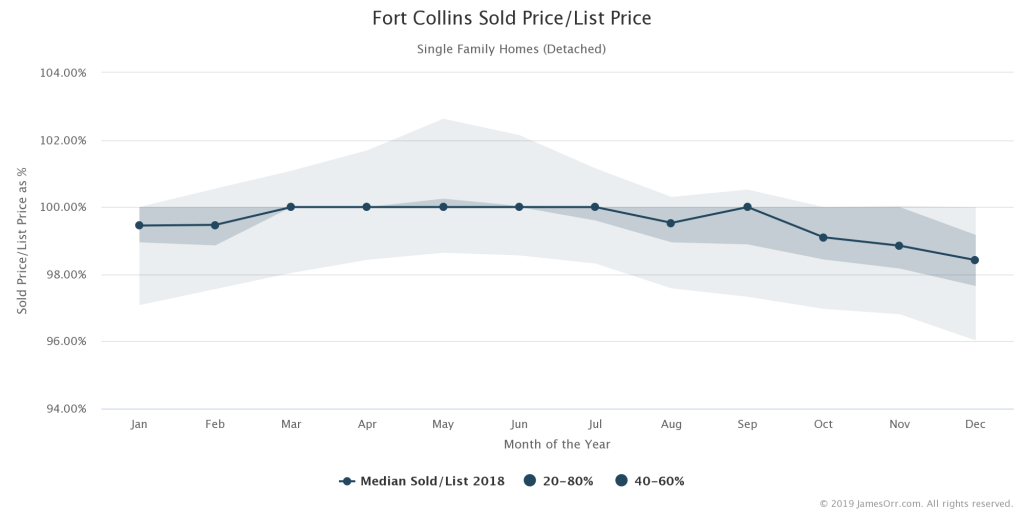
It turns out you are more likely to get a low ball offer accepted outside the spring and summer months.
Low Ball Offers More Likely on Higher Priced Properties
Most long-term buy and hold real estate investors are investing in either the bottom price quartile (lower priced, slightly better cash flowing, but typically more hassle and higher percentage of maintenance rentals) or the second price quartile (slightly higher priced, slightly worse cash flow, slightly less hassle and better maintenance percentages).
Most Nomads™ are going to be investing in the second price quartile.
Most fix and flip investors are going to be flipping in the bottom two price quartiles as well.
So, it is unfortunate that I need to show you this next chart which breaks down where we are most likely to be able to buy at a bigger discount from list price by list price.
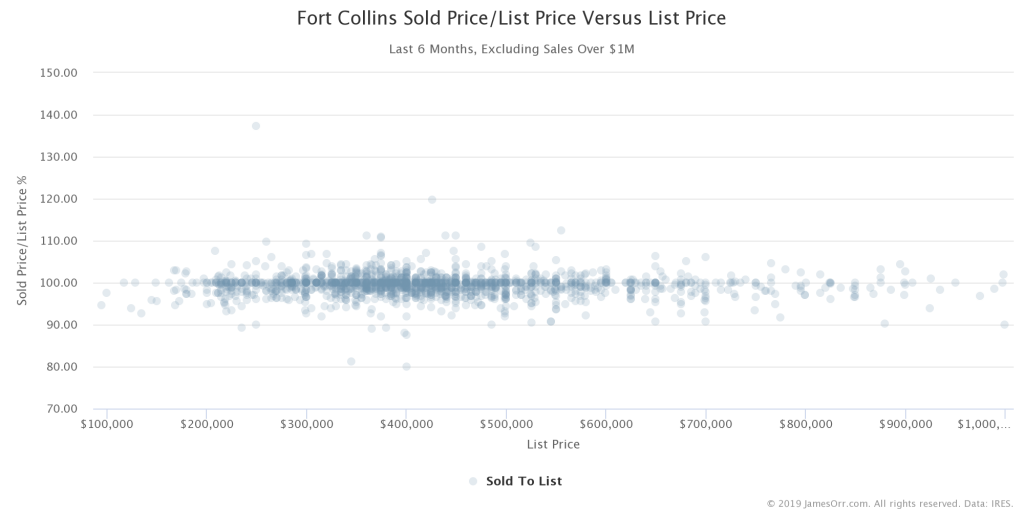
As you can see in the chart above, we definitely see both above asking price transactions and below asking price (low ball) transactions on the lower end of list price. But, we are more likely to be able to get a low ball offer accepted the higher the list price of the property.
In other words, a greater percentage of all transactions at the higher list prices are selling for below list price. So, you’re much more likely to be able to get a discount at the higher price points.
Low Balling Stale Inventory Is More Effective
Are you able to low ball a property that just hit the market? Anecdotally, you’d imagine that a seller is most optimistic when the property just hits the market. Typically properly marketed properties see the most traffic in the first week of hitting the market when the email notifications that the property was just listed hit buyer’s email inboxes and the yard sign appears in the yard.
If interest is highest early on, a seller is least inclined to accept a below asking price offer when a listing is new. And the data shows this.
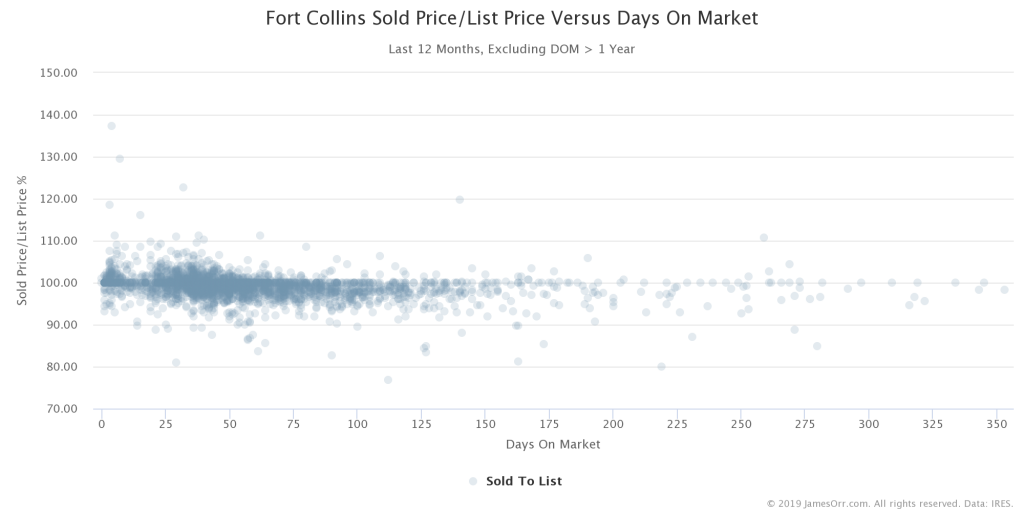
As the chart above shows, you see a gap in low ball offers closing when days on market is at its lowest.
As days on market increases and the interest in the seller’s property fades, they become more open to offers below asking price.
The longer the property sits on the market they more likely it is to sell for below list price.
I will also point out that what this chart does not show is that sellers also tend to drop their list prices over time. The chart is showing the percent of the last list price (not the original list price).
So, what low ball offer can you make?
It depends. And, there are exceptions to each of these math based suggestions.
- Is it listed in the summer? Harder to low ball. Is it a Thanksgiving or Christmas listing? May be easier to low ball.
- Is it a low priced property? Probably can’t be successful low balling as much as a higher priced property.
- Is it a property that just hit the market? Probably not much at first, but if it is still around later, then much more likely to be able to low ball.
The fallacy of “it can’t hurt to ask”
Have you ever heard the saying, “it can’t hurt to ask?” Have you ever really thought about what that means?
Let’s take it to an extreme using a non-real-estate example. Would it hurt me to ask my wife of almost 25 years: “do you mind if I start seeing other people?”
I hope you can see that the question alone does damage and has negative consequences. In this case, it does hurt to ask. It hurts the relationship and it destroys trust built up over 25 years.
While you may not have 25 years of trust built up with a seller, your real estate agent or the real estate agent representing the seller, making a unrealistic, trust-damaging ask—especially early on in the relationship—can impede your ability to come to an agreement.
And, I’m not just talking about your agreement on this offer. I am talking about your ability to come to an agreement on future transactions as well.
I wouldn’t consider my real estate market a “small town”. Our population in the area I work is about half a million people and there are a lot of real estate agents that I have not done a deal with. But, I will tell you that I know for a fact that my reputation for fair dealing, doing what I said I was going to do and being reasonable has gotten my clients deals. Deals where they were not the highest offer in competitive situations. Deals where offers were accepted even before my clients had a chance to even see the property and where offers were $50,000 higher than our offer was after everyone was able to see the property.
Sellers Hold Grudges, So Do Real Estate Agents, Brokers, and Attorneys
I remember meeting an attorney (whose name I can’t even remember at this point) at a property once many, many years ago and somehow we started talking about other attorneys in town we knew. I mentioned an attorney I was using to do some real estate contract work for me. He become very animated and tried very, very hard to get me to use another attorney… any other attorney. He told me he (and some of his attorney friends) would go out of their way not to do business with them and they’d tell their clients to avoid doing business with them if possible. Imagine, having your offer ignored because of who wrote the offer up because the professional writing it up has a bad reputation.
I know I’ve had to disclose bad experiences I’ve had with other agents to my clients when an offer comes in. I’d rather a client know that we’ve had problems dealing with this agent before so they know what to expect during the transaction. If two offers are similar, they may want to chose the one that is going to be easier to work with.
I’ve also had sellers hold a grudge for an ask a buyer made when buying a property.
Low Ball Offers Have Consequences
“For every action, there is an equal and opposite reaction.” — Isaac Newton
Every low ball offer has consequences.
Sometimes, as the data above suggests, you are able to get a below list price, low-ball offer accepted and close a deal. That would be a positive consequence.
Sometimes, as the data above does not necessarily show, this does have consequences for you and the real estate agent you’re using. These could have the positive consequences of letting a wider group of people know that you’re a real estate investor and looking for deals. It can also have the negative consequences of diminishing your reputation with people you may want to do a deal with in the future.
Making blind low-ball offers may not be worth the consequences. I am sure there are “ends justify the means” folks that disagree with my opinion.
Am I opposed to making a smart, well-calculated below-asking-price offer? Not at all. When and where it makes sense, I can and have made offers that are below list price for my personal purchases as well as for clients I’ve represented as a real estate broker.
How to deal with a low ball offer when you’re the seller
Sellers can choose not to reply to low ball offers. They can also choose to counter back at full list price.
Or, if they have some flexibility in price, they can choose to counter back at a small discount from list price.
Nomad™ and low ball offers
Since this is the official home of the Nomad™ investing strategy, I would be remiss if I did not specifically address how we think about the Nomad™ investing strategy in terms of low ball offers.
You don’t need to make low ball offers as a Nomad™.
The strategy works fine without low ball offers or even buying properties at a discount.
Most Nomads™ are going to be selecting quality properties that would make great rentals in great neighborhoods rather than trying to get a discount and perhaps buying properties in less-than-ideal areas or with less-than-ideal attributes.
The Nomad™ philosophy is more like Warren Buffett’s quote: “It’s far better to buy a wonderful company at a fair price than a fair company at a wonderful price.”

As Nomads™, we’d rather buy a wonderful property at a fair price than a fair property (or worse) at a wonderful price.
Low Ball Offer Class Recording
Every once in awhile I will teach a class on low ball offers. For example, I taught a class called Low-ball Offer Case Studies.
Low ball offer case studies
Earlier I shared with you data about making low ball offers and buying deeply discounted properties from the MLS.
Now, I will pose you a question: are the properties you can buy for significantly below list price the types, quality and condition of properties you would like to buy as a real estate investor?
That’s what I intend to help you determine next by going through a case study of the 20 properties that got the biggest discount from list price.
I have included two reports.
The first report is the listing history. This report shows you:
- What the property was originally listed for so you can see what they originally thought they’d sell it for.
- How long it took to go under contract which you can use to deduce how fast you would have needed to act to buy this property.
- Any price changes so you can see if they had to reduce the price to get someone to take action
- What the property ended up closing for so you can see how big of a discount they were able to purchase it with.
- How long it took to close once it was under contract.
You can download this “Listing History” report here:
The next report is the MLS sheets for the same 20 properties. This report will show you:
- A photo of the property so you can get a feel for what it looked like.
- The address in case you want to look up where the property was located.
- The terms of the purchase (cash, conventional, FHA, etc).
- The days to offer and days on market until it closed.
- The last listing price and the ultimate sale price.
- The final description of the property so you can see how they were describing it and may look for clues if you’re looking for similar properties you can buy in the future.
- And much more…
You can download the “MLS Sheets” report here:
By reading through these examples as case studies you should be able to determine whether you’d consider these properties.
Would you buy and own these properties as long-term buy and hold rentals? Most of them I would not personally for a variety of reasons like meth contamination, condition, location.
Would you buy these to fix and flip? If I was looking to do fix and flips to generate cash to invest, I might consider buying some of them to rehab them and resell them.
Would you buy these to buy, rehab, refi and ultimately rent out (the BRRR strategy)? Personally, there are very few that I’d consider using as a BRRR.
Would you buy these to live in as a Nomad™ for a year (or more) and then convert them to a rental? Again, I probably would not.
But, it is not whether I would or not… it is all about whether you would. Use these case studies to learn about what types of properties are able to be purchased significantly below list price and how you can use that information when you’re considering using low-ball offers.
Conclusion
Low ball offers are a controversial subject.
Some real estate investors insist that you can’t be successful investing in real estate without making low ball offers and buying properties significantly below list price (which, as we now know, is not always really the true value).
Other real estate investors feel more like Warren Buffett and believe that “Price is what you pay. Value is what you get.”
Sometimes, the properties you can get with a low ball offer are not ones we’d desire to hold in our portfolio as long-term buy and hold rentals.
On the other hand, if you’re buying properties buy, fix up and resell (fix and flip), you need to be buying properties where you can add value and make a profit in the short-term. This may require you to make offers lower than list price on some properties.
While I’ve tried to present a comprehensive, balanced discussion of low ball offers, I’m curious what you think. Please join the discussion and leave a comment below. Very few readers will. Will you?
[tvo_shortcode id=1666]


As a fix and flipper i always offer a little less than i think they would take. But i always use my formulas to make sure the deal makes sense.
What percentage of your offers are accepted?